Abstract
Objectives
Carbon dots (CDs) are one of the most promising carbon‐based materials in bioimaging and drug/gene delivery applications. In this study, we have attempted to study the drug carrying capacity of highly fluorescent CDs for delivery of doxorubicin (DOX) and investigate the therapeutic activity of the CDs‐DOX drug delivery system.
Materials and methods
Carbon dots were synthesized by means of a hydrothermal approach with mixing citric acid and ethylenediamine. The properties of CDs were characterized in respects of spectral property, zeta potential, particle morphology and chemical composition. The drug loading efficiency (DLE) and release profile of CDs‐DOX were determined by a fluorescence spectrophotometer. We investigated the cellular toxicity and pharmaceutical activity of CDs and CDs‐DOX in L929 cells and MCF‐7 cells by the CCK‐8 assay. We also studied the cellular uptake of CDs‐DOX with the methods of confocal microscopy and flow cytometry. In addition, the effect of CDs‐DOX on cell apoptosis was assessed by flow cytometry.
Results
The obtained CDs possessed good biocompatibility and showed a potential capacity of promoting proliferation. DOX was successfully conjugated to CDs through electrostatic interaction, and the results of the DLE and loading content (DLC) suggested a relatively high drug loading capacity of CDs. Compared with free DOX, the CDs‐DOX complex had a higher cellular uptake and better anti‐tumour efficacy on MCF‐7 cells.
Conclusions
The results of this study indicated that the CDs‐DOX drug delivery system had a potential value in cancer chemotherapeutic application.
1. INTRODUCTION
Carbon dots, a newly emerging star in carbon‐based nanomaterials, have attracted tremendous attention due to their excellent features in terms of fluorescent properties, chemical stability, solubility and biocompatibility.1 These properties made CDs have wide applications in the field of bioimaging, biosensors,2 drug delivery,3 photocatalysis4 and optoelectronics. In recent years, many studies have been conducted concerning the synthesis of CDs, and various methods have been developed such as hydrothermal cracking or microwave‐mediated synthesis of organic compounds, oxidation of carbon nanotubes, graphite and candle soot.5 Among these methods, the hydrothermal route has been widely applied because of its simplicity, low cost and controlled reaction conditions.6
Cancer is a worldwide major disease, posing a great threat to human health. Chemotherapy, as the traditionally principal treatment mode, is subjected to poor specificity and serious side effects.7 However, drug nanocarrier systems play an important role in improving the cancer treatment efficiency and diminishing side effects.8, 9, 10 In recent years, with the fast development of nanotechnology in the field of biomedicine,11, 12, 13, 14, 15 nanocarriers, such as liposomes, polymeric micelles, carbon nanotubes, and organic or inorganic nanomaterials, have gained considerable attention.16, 17 Especially, CDs with excellent biocompatibility, good surface activity and enhanced cellular uptake come to be promising carriers for drug delivery.3, 18 There are a large number of functional groups such as −NH2, −OH or −COOH on the surface of CDs; consequently, it is possible for CDs to carry different therapeutic agents via electrostatic interaction or covalent bonding. Doxorubicin, a widely used anti‐tumour drug with good anti‐tumour effect, enters the nucleus to inhibit the nucleic acid synthesis and thus destroys DNA.19 Moreover, delivery of DOX possesses inherent fluorescence, which can form a dual‐emission delivery system with CDs.
In this study, CDs were prepared by one‐step hydrothermal treatment and characterized in terms of spectral property, zeta potential, particle morphology and chemical composition. Moreover, we developed the CDs‐DOX drug delivery system and then accessed its drug loading and release efficiency by a fluorescence spectrophotometer. In order to explore the anti‐tumour activity of the CDs‐DOX in cancer therapy, we studied the in vitro cytotoxicity, cellular uptake and therapeutic effect in MCF‐7 cells with the methods of CCK‐8 assay, flow cytometry and confocal microscopy.
2. MATERIALS AND METHODS
2.1. Materials
Citric acid, ethylenediamine and doxorubicin hydrochloride (DOX HCl) were obtained from Aladdin Chemical Inc. (Shanghai, China). The syringe filter and dialysis bag (MWCO = 500‐1000 Da) were purchased from Millipore Ltd (USA). Furthermore, Dulbecco's modified Eagle's medium (DMEM), RPMI 1640 medium, foetal bovine serum (FBS) and 0.25% trypsin‐EDTA were purchased from GIBCO, Invitrogen Co. (Carlsbad, USA). Mouse fibroblast cell line (L929) and human breast adenocarcinoma cell line (MCF‐7) were obtained from the Key Laboratory of Oral Diseases of Sichuan University (Chengdu, China). The above cells were cultured in RPMI 1640 or DMEM medium containing 10% FBS, 100 U/mL of penicillin, and 100 μg/mL streptomycin at 37°C, 5% CO2 humidified incubator. The Annexin V‐FITC Apoptosis Detection Kit I and Cell Counting Kit‐8 (CCK‐8) were supplied by Dojinda Laboratory (Japan). 4′,6‐Diamidino‐2‐phenylindole (DAPI) was obtained from Beyotime Biotechnology (Shanghai, China).
2.2. Preparation of CDs and CDs‐DOX
Carbon dots were prepared as the procedure of Zhu et al20; 1.050 g citric acid and 335 μL ethylenediamine were dissolved in 10 mL deionized water. Then, the mixed solution was transferred into 30 mL stainless steel autoclave to react at 200°C for 5 hours. After that, the autoclave was cooled down to room temperature. Subsequently, the obtained product was subjected to dialysis and filtered to obtain pure CDs. The final CDs solution was brown‐black and transparent, kept at 4°C for further treatment. To prepare the CDs‐DOX complexes, 1 mL DOX solution (400 μg mL−1) was added to 1 mL CDs solution (4 mg mL−1), and then the mixed solution was stirred at 28°C for 24 hours. Unreacted DOX and CDs were removed by dialysing the resulting solution against 20 mL deionized water for 6 hours. The obtained CDs‐DOX samples were stored at 4°C in the dark.
2.3. Characterizations of CDs, DOX and CDs‐DOX
Fluorescent measurements were performed with a RF‐5301PC spectrofluorometer (Shimadzu, Japan). UV‐vis spectroscopy was carried out with a U‐3900H UV‐vis spectrofluorometer (Hitachi, Japan). Surface morphology analyses were carried out using a HITACHI S‐4800 scanning electron microscope (SEM, Oxford, UK) and a SPM‐9700 atomic force microscopy (AFM, Shimadzu, Japan). Zeta potential was characterized by a Nano ZS90 Zetasizer (Malvern, UK). X‐ray photoelectron spectroscopy (XPS) patterns were obtained from an ESCALAB‐MKII XPS spectrometer (Thermo Scientific, USA). The Fourier transform infrared (FTIR) spectroscopy was carried out by a 5DX FT‐IR spectrometer (Nicolet, USA) within the spectral window in the range of 500‐4000 cm−1.
2.4. DOX loading and release
The DLE and loading content were determined by a fluorescence spectrophotometer. The amount of DOX was calculated by the absorbance of DOX at 485 nm according to a standard calibration curve which was graphed based on various concentrations of DOX solutions. DLE and DLC were calculated according to the 2 experimental equations below:
To investigate the pH‐dependent release property under physiological conditions, 5 mL CDs‐DOX solution was put into a dialysis bag (molecular weight cut off: 500‐1000 Da) against 100 mL PBS at different pH values (pH = 5.0, 6.8 and 7.4), which represented different environments of human tissues (endochylema of cancer cells, interstitial fluid of cancer and physiological environment). The release systems were kept stirring in the dark with speed of 200 rpm/min. In some time intervals, we took out 2.0 mL of the release medium and then replaced it with the equal volume of fresh PBS. Finally, a fluorescence measurement was used to quantify the amount of released DOX with the same method mentioned above.
2.5. Cytotoxicity assay
The cytotoxicity and pharmaceutical activity study of CDs, DOX and CDs‐DOX were carried out by the CCK‐8 assay. To evaluate the cellular toxicity of CDs, the L929 cells and MCF‐7 cells were grown overnight at a density of 104 cells/well in 96‐well plates. Then, the above cells were further incubated with fresh medium containing different dose of CDs solutions for 24 and 48 hours. For the pharmaceutical activity tests, bare DOX and CDs‐DOX (at the same DOX concentrations of 0.2 μg mL−1 and 0.5 μg mL−1) were, respectively, added into MCF‐7 cells and incubated for 24 and 48 hours. After that, the cells were treated with CCK‐8 reagent (10%) followed by fluorescence intensity measurement with a VariOskanFlas 3001 microplate reader (Thermo, USA) at a wavelength of 450 nm. The cytotoxicity activity was determined from the relative cell viability (%). The IC50 values (half maximal inhibitory concentration) were calculated with the GraphPad Prism Version7.0a software (GraphPad Software, USA).
2.6. Confocal microscopy detection
The MCF‐7 cells were seeded in confocal microscope dishes at 2 × 10⁴ cells/well and cultured for a whole night. Then, the cells were exposed with bare DOX and CDs‐DOX (at a DOX dose of 1 μg mL−1) for 0.5, 1 and 4 hours, respectively. After the residual particles were removed, the cells were fixed with paraformaldehyde (4%), and the cell nuclei were stained with DAPI (1 μg mL−1). Finally, fluorescence images of free DOX and CDs‐DOX were acquired by a Leica TCS‐SP8 laser scanning confocal microscopy (Wetzlar, Germany).
2.7. Intracellular uptake
To study the intracellular uptake of free DOX and CDs‐DOX, MCF‐7 cells were seeded in 6‐well plates at 2 × 10⁵ cells/well and cultured overnight. Afterwards, the cells were treated with bare DOX and CDs‐DOX at the same DOX dose of 0.5 μg mL−1. After different incubation time (1, 2 and 4 hours), cells were collected using centrifugation at 1000 g. Finally, the cells were suspended in 500 μL PBS, and the uptake of DOX was analysed by a Coulter FC500 flow cytometer (Beckman, USA).
2.8. Apoptosis analysis
MCF‐7 cells treated with DOX and CDs‐DOX (at a DOX dose of 0.5 μg mL−1) were harvested after 24 hours. Subsequently, the obtained cells were stained with Annexin V‐FITC and propidium iodide (PI) in the absence of light. The percentage of apoptotic cells was analysed by flow cytometry.
2.9. Statistical analysis
Statistical difference analyses were assessed through t test by GraphPad Prism Version7.0a software (GraphPad Software). The data are expressed as mean ± SD, and P < .05 was considered as statistical significance (*P < .05, **P < .01, ***P < .001 and ****P < .0001).
3. RESULTS
3.1. Characterization
The particle morphology of the CDs, DOX and CDs‐DOX complexes was characterized by SEM and AFM. As shown in Figure 1A‐C, these particles displayed well‐dispersed quasi‐spherical morphology. However, the CDs‐DOX complexes owned the largest size among the 3 particles. Moreover, as depicted in Figure 1D, the AFM result showed the CDs possessed a narrow particle size distribution with an average height of approximately 0.5 nm. As for DOX and the nanocomplexes (Figure 1E,F), they were spherical and had a mean height of about 4 and 20 nm, respectively. The differences in height among these particles may provide evidence for the attachment of DOX to CDs.
Figure 1.
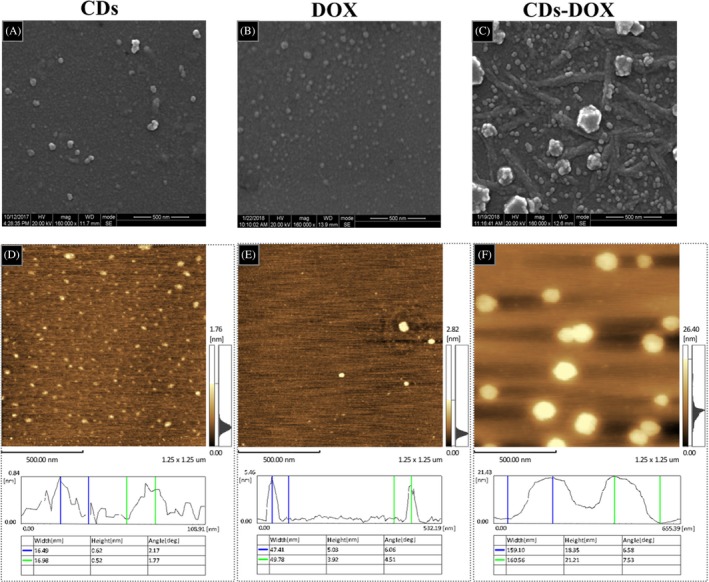
Morphological characterizations of carbon dots (CDs), delivery of doxorubicin (DOX) and CDs‐DOX. A, B, C, SEM images of CDs, DOX and CDs‐DOX. D, E, F, Atomic force microscopy images of CDs, DOX and CDs‐DOX and the width and height results of CDs, DOX and CDs‐DOX. The average height of the CDs, DOX and CDs‐DOX were about 0.5, 4 and 20 nm, respectively. The measurements were conducted in triplicate
The optical properties of materials are crucial to their biological applications, especially for biological imaging and drug delivery; thus we investigated the UV‐vis absorption and photoluminescence (PL) spectra of CDs. As shown in Figure 2A, CDs in aqueous solution showed an enhanced UV‐vis absorption located at 340 nm. With regard to the fluorescence spectra, the maximum excitation and emission wavelengths were located at 360 and 450 nm, respectively. The inset image of the CDs dispersion was yellow and transparent in daylight and showed strong blue luminescence under UV light. Excitation‐dependent PL behaviour was observed in Figure 2B, which could be useful in multicolour biological imaging applications.20 In addition, the CDs‐DOX complexes were investigated by photoluminescence spectroscopy as well. As represented in Figure 2C, the CDs exhibited a strong absorption at 360 nm. By contrast, a sharp decrease in peak intensity of the CDs‐DOX complexes was observed, which suggested that the DOX molecules probably quenched the CDs fluorescence to a certain degree.21 More importantly, the diminished peak intensity proved the successful loading of DOX on the CDs. Figure 2D shows the zeta potential measurements of CDs, DOX and their complexes. The zeta potential value of the CDs was −5.12 mV, and after loading the positively charged DOX on CDs via electrostatic interaction, the zeta potential value increased up to 1.03 mV, which sufficiently indicated the successful preparation of the CDs‐DOX complexes via electrostatic interaction. Figure 2E shows the FTIR spectra of the CDs, DOX and CDs‐DOX complexes, which revealed these particles possessed the similar characteristic peaks. The broad peak centring at 3400 cm−1 could be attributed to O‐H bonding, and the absorptions at 2900 cm−1 represented C‐H stretching vibrations. Moreover, the absorption peaks at 1600, 1550, and 1050 cm−1 were in accord with C=O, N‐H and C‐O bonds, respectively.20 These data suggested that these particles were functionalized with hydroxyl, carbonyl, oxygen and nitrogen‐containing groups. The wide scan XPS results of samples CDs, DOX and CDs‐DOX complexes were shown in Figure 2F, which revealed the existence of carbon, oxygen and nitrogen as well as a difference of N1s content among the 3 particles. In CDs sample, the amount of N1s accounted for 11.04%, while in DOX and CDs‐DOX, the ratio dropped slightly, 2.09% and 5.77%, respectively.
Figure 2.
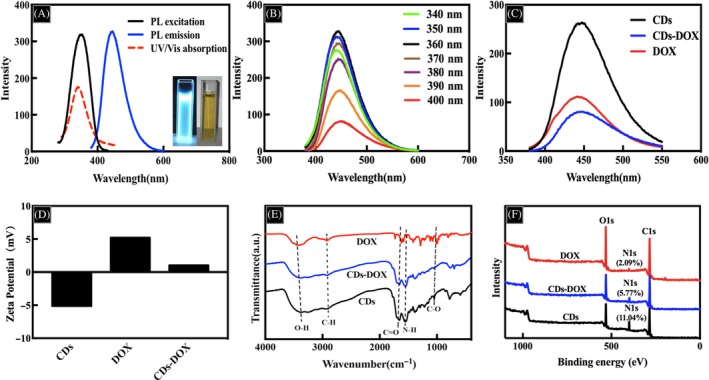
A, UV‐vis and fluorescence spectra of Carbon dots (CDs). Inset: optical images of CDs in aqueous solution under UV light (left) and daylight (right). B, Emission spectra of CDs at different excitation wavelengths from 340 to 400 nm. C, Photoluminescence spectra of CDs, delivery of doxorubicin (DOX) and CDs‐DOX. D, Zeta potential values of CDs, DOX and CDs‐DOX. E, FTIR spectra and (F) XPS spectra of CDs, DOX and CDs‐DOX
3.2. DOX loading and releasing
To investigate the loading efficiency and release properties of the CDs‐DOX complexes, CDs were loaded with DOX, and the kinetics of drug release was calculated using a dialysis membrane against PBS at different pH values. The loading capacity of DOX was accessed by UV‐vis absorption spectroscopy at the wavelength of 485 nm and the DOX loading efficiency and loading amount were calculated to be 57.5% and 28.75 mg g−1, respectively. These results demonstrated that the CDs had a good drug loading capacity for DOX via electrostatic interaction. In addition, the cumulative release property of DOX from the CDs‐DOX complexes was investigated in different pH solutions (pH = 5.0, 6.8 and 7.4).22 As shown in Figure 3A, the DOX release rate at pH 5.0 was much higher than that at pH 6.8 or 7.4. At the end of 72 hours, the cumulative release ratio reached 82.0% in pH 5.0 buffer saline. However, 75.0% and 71.0% of DOX were released at pH 6.8 and 7.4, respectively.
Figure 3.
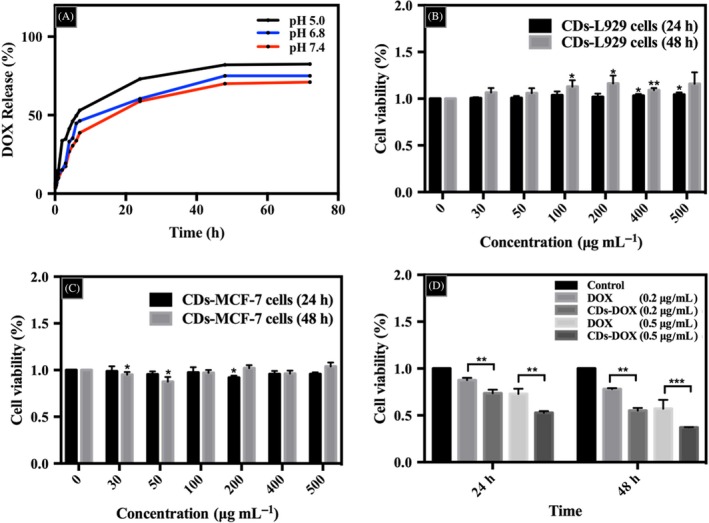
The drug release curves and cytotoxicity study. A, pH‐responsive release of delivery of doxorubicin (DOX) from CDs‐DOX in PBS at pH 5.0, 6.8 and 7.4. Cytotoxic effects of carbon dots (CDs) on L929 cells (B) and MCF‐7 cells (C) via CCK‐8 test at increasing concentration for 24 and 48 h. Cells incubated with only media as a control. D, The pharmaceutical activity studies of free DOX and CDs‐DOX for 24 and 48 h. The concentrations of DOX were 0.2 μg mL−1 and 0.5 μg mL−1. All treatments in this figure were carried out in triplicate. Data are expressed as mean ± SD (n = 3). *P < .05, **P < .01 and ***P < .001
3.3. Cytotoxicity assay
As potential drug carrier materials in biomedical applications, CDs always attract great attention in terms of toxicity. Figure 3B,C shows the cell viabilities of L929 and MCF‐7 cells which were treated with CDs for 24 and 48 hours, respectively. As observed in Figure 3B, the CDs promoted the growth of L929 cells with the viability initially exceeding 100% as the concentration of CDs increased from 0 to 500 μg mL−1. Especially, the cell survival rate of L929 cells was significantly higher than that of control groups when the concentrations of CDs were 400 and 500 μg mL−1 for 24 hours and 100, 200, 400 μg mL−1 for 48 hours, which showed a potential proliferative function of CDs indeed. As for MCF‐7 cells (Figure 3C), the CDs possessed very low toxicity with cell viabilities above 90% at all studied doses. Therefore, there is no need to worry about the toxicity induced by the combination of the CDs with DOX. What is more, this study investigated the pharmaceutical activity of free DOX and CDs‐DOX in the MCF‐7 cells of both 24‐ and 48‐hour incubation (Figure 3D). It could be seen that the viability of MCF‐7 cells was over 80% at a DOX dose of 0.2 μg mL−1 after 24‐hour culture. While in the CDs‐DOX group, a mild reduction in cell survival rate (about 70%) was observed. With the increase in drug concentration from 0.2 to 0.5 μg mL−1, all tested cell survival rates were reduced. In particular, the CDs‐DOX group could prohibit cancer cell growth significantly. After incubation of 48 hours, both bare DOX and CDs‐DOX groups showed enhanced cytotoxicity, and the cell viability of the CDs‐DOX group was much lower than that of free DOX group at the dose of 0.2 and 0.5 μg mL−1. More importantly, for the free DOX group, after incubating for 24 and 48 hours, the IC50 values were 0.983 and 0.939 μg mL−1, respectively. While after loading DOX onto the nanocarriers, the IC50 values of the CDs‐DOX group were 0.652 and 0.356 μg mL−1, respectively. Apparently, the CDs‐DOX exhibited better anti‐cancer effect with lower IC50 value than the bare DOX in MCF‐7 cells, which indicated the great potential in cancer therapy.
3.4. Intracellular uptake
The internalization behaviour and intracellular distribution of CDs‐DOX and single DOX in MCF‐7 cells were observed using laser scanning confocal microscopy. As shown in Figure 4A,E, the cell nuclei exhibited strong blue fluorescence. In Figure 4C, CDs with green fluorescence were observed in both nucleus and cytoplasm after 4‐hour culture and showed a trend of nuclear accumulation, which confirmed that CDs could be internalized by MCF‐7 cells and penetrate into the cell nuclei. However, DOX (red fluorescence) were well‐distributed in the cell nuclei and cytoplasmic regions (Figure 4B,F). More importantly, compared with the free DOX groups, the CDs‐DOX groups exhibited stronger red emissions in nuclear regions of the cells, which demonstrated that CDs‐DOX complexes could effectively deliver DOX into the cell nucleus. What is more, in Figure S1, after 0.5 and 1 hour of incubation, the CDs‐DOX groups also showed brighter red fluorescence than the free DOX groups, which suggested the efficient cellular uptake of the complexes.
Figure 4.
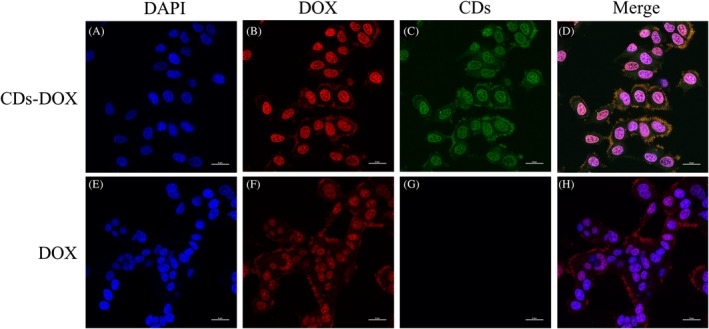
Confocal microscopy images of MCF‐7 cells incubated with CDs‐DOX (A, B, C and D) and free delivery of doxorubicin (DOX) (E, F, G and H) for 4 h, respectively. The cell nuclei were stained with DAPI and the concentration of DOX was 1 μg mL−1. The cell nuclei, DOX and carbon dots exhibited blue, red and green fluorescence, respectively. The scale bars are 25 μm in all the images
The cellular uptake of CDs‐DOX and single DOX in the MCF‐7 cells were further investigated by flow cytometry. As shown in Figure 5, the uptake of DOX in the complex group was higher than that of the bare DOX group after exposure of 1 and 2 hours. It may be a result of the difference in cellular uptake mechanism. The cellular uptake of DOX is through passive diffusion, while the CDs transport into cells by both endocytosis and passive diffusion.23 The combination of 2 pathways might explain the high uptake of the CDs‐DOX.19 However, after 4‐hour incubation, both the CDs‐DOX and the free DOX group had the same amount of intracellular uptake, which suggested that the amount of DOX released from CDs‐DOX was the same as the cellular uptake of free DOX at that incubation time. In summary, the CDs‐DOX could help the DOX enter cells and to be released from the CDs efficiently, which was consistent with the above results obtained by the laser scanning confocal microscopy.
Figure 5.
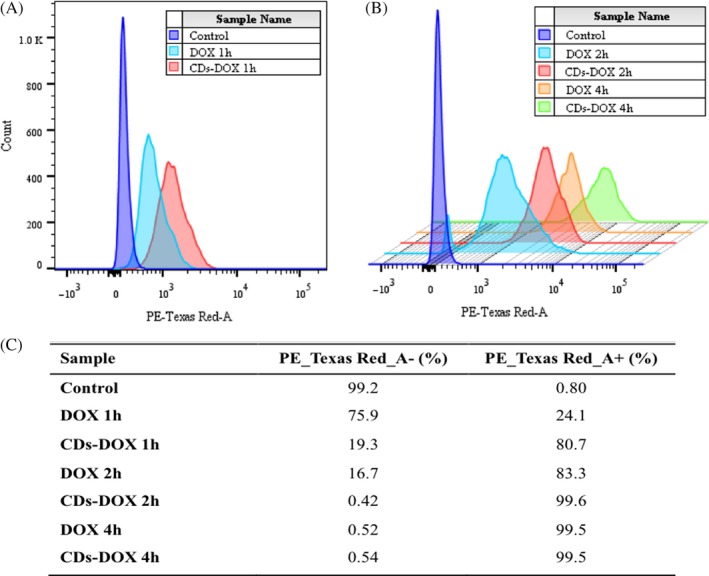
Cellular uptake of delivery of doxorubicin (DOX) by flow cytometry. A, Flow cytometry profiles of MCF‐7 cells incubated with free DOX and CDs‐DOX for 1 h and (B) 3D flow cytometry histograms of cells after 2‐ and 4‐h incubation (at the same DOX concentration of 0.5 μg mL−1). C, The uptake ratios of all groups. The results exhibited as quantitative mean fluorescence intensities
3.5. Apoptosis analysis
The DOX induced apoptosis of MCF‐7 cells in both CDs‐DOX and the free DOX group was estimated by flow cytometry combined with the Annexin V‐FITC apoptosis detection kit, which was a common approach in previous studies.19, 24 As shown in Figure 6, the cells were sorted into 4 groups, which were necrotic cells, late apoptotic cells, early apoptotic cells and intact cells. After 24‐hour incubation, the percentage of apoptotic cells in control group was 5.95%, and the apoptotic ratio of MCF‐7 cells exposed to free DOX was 17.32%. However, the CDs‐DOX was 26.05%, inducing higher apoptosis in contrast with the above 2 groups.
Figure 6.
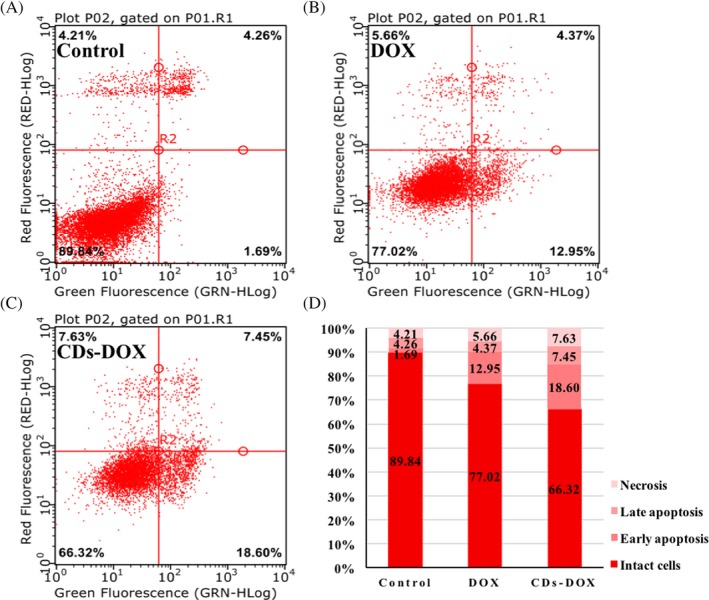
The flow cytometric analyses of apoptotic cell with Annexin V‐FITC and PI staining in MCF‐7 cells for 24‐h incubation with PBS (A), free delivery of doxorubicin (DOX) (B), CDs‐DOX (C). (D)Summary of apoptosis results. The cells were sorted into 4 groups, which were late apoptotic cells, early apoptotic cells, intact cells and necrotic cells. The concentration of DOX was 0.5 μg mL−1
4. DISCUSSION
Breast cancer is the most common tumour in women all over the world. Pre‐ and post‐operative chemotherapy has been established as the standard treatment for conventional breast cancer. DOX with good anti‐tumour effect is widely used in the treatment of breast cancer. Herein, fluorescent CDs were fabricated for drug delivery systems and the loading of DOX exhibited enhanced therapeutic efficacy in MCF‐7 cells.
Citric acid, as a common carbon source, was used to synthesize CDs in this study. The obtained CDs presented quasi‐spherical morphology with a narrow particle size (Figure 1), which was consistent with previous reports.20, 23 DOX were loaded in the carriers by means of electrostatic interaction. The results of DLE and DLC showed a relatively high drug loaded property of the above drug carriers, which was mainly attributed to the surface charge difference between the 2 particles. Besides, the functional groups of the CDs and DOX also played an important part in the combination of the drug delivery systems. Figure 3A shows the drug release profile of the CDs‐DOX complexes in the drug release media with different pH values. Obviously, the CDs‐DOX complexes exhibited a pH‐sensitive drug release property, which was probably due to the better solubility of DOX in acidic solution.25 The CDs‐DOX complexes as pH‐sensitive carriers might be in favour of promoting the efficiency of releasing drugs with the acidic environment of tumours.
Cytotoxicity is a direct indicator of anti‐tumour activity evaluation. In this study, the results of the CCK‐8 assay indicated the CDs‐DOX showed more enhanced cytotoxicity in MCF‐7 cells than the free DOX. In the laser scanning confocal microscopy detection (Figure 4), the CDs‐DOX complexes delivered more DOX into the cell nucleus than the free DOX. As it is known to all, DOX is a chemotherapeutic agent that damages DNA, inhibiting nucleic acid synthesis and ultimately killing the cancer cells.19 Especially, a high accumulation of DOX in cancer cells might be related to a high cytotoxicity.26 The CDs‐DOX complexes could help the DOX accumulating in the cell nucleus and thus significantly improve the cytotoxicity and the therapeutic effects. Moreover, in the apoptosis analysis (Figure 6), we found that, compared with the free DOX, the CDs‐DOX induced slight higher apoptosis. The improvement of the apoptosis ratio may be due to the faster internalization of CDs‐DOX complexes. Altogether, the nanocomplexes may be outstanding drug carrying system with better anti‐cancer properties. Further research should be carried out on the in vivo anti‐tumour behaviours of the CDs‐DOX drug delivery system.
5. CONCLUSIONS
Carbon dots were prepared with citric acid and ethylenediamine by means of a hydrothermal method. The obtained CDs possessed good biocompatibility and exhibited a potential proliferative function in L929 cells. The CDs‐DOX drug delivery system showed a relatively high loading capacity and a good drug release profile. Moreover, the in vitro results demonstrated that the CDs‐DOX complex had a higher cellular uptaking and more effective inhibition capacity on cancer cells than those of free DOX. It should be believed that the CDs‐DOX nanodrugs may hold a great potential for cancer chemotherapeutic applications.
CONFLICT OF INTEREST
No potential conflicts of interest relevant to this article were reported.
Supporting information
ACKNOWLEDGEMENTS
This work was supported by the National Science Fund for Distinguished Young Scholars (No.81525015), the National Nature Science Foundation of China (No.81772031) and GDUPS (2017).
Kong T, Hao L, Wei Y, Cai X, Zhu B. Doxorubicin conjugated carbon dots as a drug delivery system for human breast cancer therapy. Cell Prolif. 2018;51:e12488 10.1111/cpr.12488
The first two authors should be treated as joint first authors of this article.
Xiaoxiao Cai and Bofeng Zhu contributed equally to this work.
Contributor Information
Xiaoxiao Cai, Email: dentistcai@hotmail.com.
Bofeng Zhu, Email: zhubofeng7372@126.com.
REFERENCES
- 1. Baker SN, Baker GA. Luminescent carbon nanodots: emergent nanolights. Angew Chem Int Edit. 2010;49:6726. [DOI] [PubMed] [Google Scholar]
- 2. Gao X, Ding C, Zhu A, et al. Carbon‐dot‐based ratiometric fluorescent probe for imaging and biosensing of superoxide anion in live cells. Anal Chem. 2014;86:7071‐7078. [DOI] [PubMed] [Google Scholar]
- 3. Mewada A, Pandey S, Thakur M, et al. Swarming carbon dots for folic acid mediated delivery of doxorubicin and biological imaging. J Mater Chem B. 2014;2:698‐705. [DOI] [PubMed] [Google Scholar]
- 4. Cao L, Sahu S, Anilkumar P, et al. Carbon nanoparticles as visible‐light photocatalysts for efficient CO2 conversion and beyond. J Am Chem Soc. 2011;133:4754‐4757. [DOI] [PubMed] [Google Scholar]
- 5. Liu H, Ye T, Mao C. Fluorescent carbon nanoparticles derived from candle soot. Angew Chem. 2007;46:6473‐6475. [DOI] [PubMed] [Google Scholar]
- 6. Sachdev A, Gopinath P. Green synthesis of multifunctional carbon dots from coriander leaves and their potential application as antioxidants, sensors and bioimaging agents. Analyst. 2015;140:4260‐4269. [DOI] [PubMed] [Google Scholar]
- 7. He Q, Shi J. MSN anti‐cancer nanomedicines: chemotherapy enhancement, overcoming of drug resistance, and metastasis inhibition. Adv Mater. 2014;26:391. [DOI] [PubMed] [Google Scholar]
- 8. Xie X, Shao X, Ma W, et al. Overcoming drug‐resistant lung cancer by paclitaxel loaded tetrahedral DNA nanostructures. Nanoscale. 2018;10:5457‐5465. [DOI] [PubMed] [Google Scholar]
- 9. Li Q, Zhao D, Shao X, et al. Aptamer‐modified tetrahedral DNA nanostructure for tumor‐targeted drug delivery. ACS Appl Mater Inter. 2017;9:36695. [DOI] [PubMed] [Google Scholar]
- 10. Tian T, Zhang T, Zhou T, et al. Synthesis of an ethyleneimine/tetrahedral DNA nanostructure complex and its potential application as a multi‐functional delivery vehicle. Nanoscale. 2017;9:18402‐18412. [DOI] [PubMed] [Google Scholar]
- 11. Zhao D, Xue C, Li Q, et al. Substrate stiffness regulated migration and angiogenesis potential of A549 cells and HUVECs. J Cell Physiol. 2018;233:3407‐3417. [DOI] [PubMed] [Google Scholar]
- 12. Shi S, Lin S, Li Y, et al. Effects of tetrahedral DNA nanostructures on autophagy in chondrocytes. Chem Commun. 2018;54:1327‐1330. [DOI] [PubMed] [Google Scholar]
- 13. Liao J, Tian T, Shi S, et al. The fabrication of biomimetic biphasic CAN‐PAC hydrogel with a seamless interfacial layer applied in osteochondral defect repair. Bone Res. 2017;5:137‐151. [DOI] [PMC free article] [PubMed] [Google Scholar]
- 14. Zhang Q, Lin S, Shi S, et al. Anti‐inflammatory and anti‐oxidative effects of tetrahedral DNA nanostructures via the modulation of macrophage responses. ACS Appl Mater Inter. 2018;10:3421‐3430. [DOI] [PubMed] [Google Scholar]
- 15. Ma W, Shao X, Zhao D, et al. Self‐assembled tetrahedral DNA nanostructures promote neural stem cell proliferation and neuronal differentiation. ACS Appl Mater Inter. 2018;10:7892‐7900. [DOI] [PubMed] [Google Scholar]
- 16. Peer D, Karp JM, Hong S, et al. Nanocarriers as an emerging platform for cancer therapy. Nat Nanotechnol. 2007;2:751. [DOI] [PubMed] [Google Scholar]
- 17. Bertrand N, Wu J, Xu X, et al. Cancer nanotechnology: the impact of passive and active targeting in the era of modern cancer biology. Adv Drug Deliver Rev. 2014;66:2‐25. [DOI] [PMC free article] [PubMed] [Google Scholar]
- 18. Zheng M, Liu S, Li J, et al. Integrating oxaliplatin with highly luminescent carbon dots: an unprecedented theranostic agent for personalized medicine. Adv Mater. 2014;26:3554‐3560. [DOI] [PubMed] [Google Scholar]
- 19. Yang L, Wang Z, Wang J, et al. Doxorubicin conjugated functionalizable carbon dots for nucleus targeted delivery and enhanced therapeutic efficacy. Nanoscale. 2016;8:6801‐6809. [DOI] [PubMed] [Google Scholar]
- 20. Zhu S, Meng Q, Wang L, et al. Highly photoluminescent carbon dots for multicolor patterning, sensors, and bioimaging. Angew Chem. 2013;52:3953‐3957. [DOI] [PubMed] [Google Scholar]
- 21. Gao N, Yang W, Nie H, et al. Turn‐on theranostic fluorescent nanoprobe by electrostatic self‐assembly of carbon dots with doxorubicin for targeted cancer cell imaging, in vivo hyaluronidase analysis, and targeted drug delivery. Biosens Bioelectron. 2017;96:300. [DOI] [PubMed] [Google Scholar]
- 22. Jia X, Han Y, Pei M, et al. Multi‐functionalized hyaluronic acid nanogels crosslinked with carbon dots as dual receptor‐mediated targeting tumor theranostics. Carbohyd Polym. 2016;152:391‐397. [DOI] [PubMed] [Google Scholar]
- 23. Zhou N, Zhu S, Maharjan S, et al. Elucidating the endocytosis, intracellular trafficking, and exocytosis of carbon dots in neural cells. RSC Adv. 2014;4:62086‐62095. [Google Scholar]
- 24. Ding J, Xiao C, Li Y, et al. Efficacious hepatoma‐targeted nanomedicine self‐assembled from galactopeptide and doxorubicin driven by two‐stage physical interactions. J Control Release. 2013;169:193. [DOI] [PubMed] [Google Scholar]
- 25. Deng H, Zhao X, Liu J, et al. Synergistic dual‐pH responsive copolymer micelles for pH‐dependent drug release. Nanoscale. 2015;8:1437. [DOI] [PubMed] [Google Scholar]
- 26. Yang F, Wen X, Ke Q‐F, et al. pH‐responsive mesoporous ZSM‐5 zeolites/chitosan core‐shell nanodisks loaded with doxorubicin against osteosarcoma. Mater Sci Eng C Mater Biol Appl. 2018;85:142‐153. [DOI] [PubMed] [Google Scholar]
Associated Data
This section collects any data citations, data availability statements, or supplementary materials included in this article.
Supplementary Materials


