

Abstract
Objectives
Histone deacetylases (HDACs) are commonly dysregulated in cancer and represent promising therapeutic targets. However, global HDAC inhibitors have shown limited efficacy in the treatment of solid tumours, including hepatocellular carcinoma (HCC). In this study, we investigated the therapeutic effect of selectively inhibiting HDAC1 and 2 in HCC.
Methods
HDAC1 inhibitor Tacedinaline (CI994), HDAC2 inhibitor Santacruzamate A (CAY10683), HDAC1/2 common inhibitor Romidepsin (FK228) and global HDAC inhibitor Vorinostat (SAHA) were used to treat HCC cells. Cell cycle, apoptosis and the protein levels of CDKs and CDKNs were performed to evaluate HCC cell growth. Inhibition of HDAC1/2 by RNAi was further investigated.
Results
Combined inhibition of HDAC1/2 led to HCC cell morphology changes, growth inhibition, cell cycle blockage and apoptosis in vitro and suppressed the growth of subcutaneous HCC xenograft tumours in vivo. p21Waf1/Cip1 and p19INK 4d, which play roles in cell cycle blockage and apoptosis induction, were upregulated. Inhibition of HDAC1/2 by siRNA further demonstrated that HDAC1 and 2 cooperate in blocking the cell cycle and inducing apoptosis via p19INK 4d and p21Waf1/Cip1 upregulation. Finally, H3K18, H3K56 and H4K12 in the p19INK 4d and p21Waf1/Cip1 promoter regions were found to be targets of HDAC1/2.
Conclusions
Pharmacological or transcriptional inhibition of HDAC1/2 increases p19INK 4d and p21Waf1/Cip1 expression, decreases CDK expression and arrests HCC growth. These results indicated a potential pharmacological mechanism of selective HDAC1/2 inhibitors in HCC therapy.
1. INTRODUCTION
Hepatocellular carcinoma (HCC) is the most prevalent form of primary liver cancer, accounting for more than 700 000 deaths annually worldwide.1, 2 Hepatitis B and C, alcohol and aflatoxin have been identified as major risk factors for HCC.3, 4 Despite progress in surgical techniques, chemotherapy and radiotherapy in the treatment of HCC, the 5‐year relative survival rate for patients with HCC is only 7%, largely due to tumour recurrence and metastases.5, 6 The paucity of effective and well‐tolerated treatments for advanced HCC highlights the need for new therapeutic approaches. In the past decade, systemic administration of a multikinase inhibitor, sorafenib, was approved for clinical use for patients with advanced HCC.7 However, beneficial effects of sorafenib were observed in only approximately 30% of patients, and acquired drug resistance often develops within 6 months.8, 9, 10, 11 Thus, there is an urgent need to develop novel and specific HCC‐targeting drugs.
Histone deacetylases (HDACs) are a class of enzymes that remove acetyl groups from specific lysine residues on core histones, thereby regulating gene transcription via histone and chromatin structure modifications. HDACs typically interact with other transcriptional co‐repressors (eg mSin3, SMRT and N‐CoR) to form multiprotein complexes that interact with DNA‐binding factors to inhibit target gene transcription.12, 13, 14 These complexes are involved in various physiological processes, such as cell cycle progression, differentiation, apoptosis and tumorigenesis. HDAC deregulation has been detected in various cancers, and several HDAC inhibitors (HDACis) have been approved by the U.S. Food and Drug Administration (FDA) for use in treating clinical cutaneous T‐cell lymphoma (CTCL) or peripheral T‐cell lymphoma (PTCL).15 Although HDACis have been shown to be effective in the treatment of many other types of cancer, their efficacy against HCC is still largely unknown.16
In mammals, a total of 18 HDAC homologues have been identified, and they are subdivided into classes I, IIa, IIb, III and IV. The functions of HDAC isoforms are not yet fully understood. Some HDAC isoforms have been found to be associated with specific diseases, such as cancer and neurodegenerative diseases.12, 17 Most early HDACis, such as SAHA, TSA, VPA and butyrate, are global HDACis.18 Their effects in cancer therapy are unpredictable, and they have shown different side effects as well.16 Therefore, selective HDACis are highly desirable for achieving a better understanding of the biological functions of different HDAC isoforms and, more importantly, for the development of agents with more precise therapeutic effects and fewer side effects.
HDAC1 and HDAC2, the 2 members of the class I HDAC family, are ubiquitously expressed in organs and tissues, including the liver.19 HDAC1 and HDAC2 typically associate with co‐repressors to form transcriptional co‐repressor complexes.12 They are also required for chromatin condensation, spindle formation and correct separation during cell mitosis and deregulation of HDAC1/2 can lead to abnormal karyokinesis.20 Both HDAC1 and HDAC2 play an essential role in mouse growth and development, and they play redundant roles in the regulation of cell proliferation.20, 21 More than 95% of HCC patients have abnormally high levels of HDAC1/2 in the liver. Previous research by Rikimaru et al demonstrated that the survival rates after surgical resection in patients with low and high HDAC1/2 expression at 5 years were 81.8% and 40.0%, respectively.22 Quint additionally investigated the expression of HDACs 1, 2, 3 and 7 in HCC and concluded that the HDAC2 expression level was associated with survival of patients with HCC.23
Herein, considering the similar structures of HDAC1 and 2 and their redundant functions, we hypothesized that combined inhibition of HDAC1 and 2 may have better therapeutic effects on HCC. To address this hypothesis, we used 3 different selective HDACis to treat HCC cell lines and evaluated their effects on HCC cell proliferation and apoptosis. Our findings indicate that selective inhibition of HDAC1 or 2 does not affect the growth of HCC cells, but combined inhibition of HDAC1 and 2 leads to cell cycle arrest and apoptosis. Additionally, p21Waf1/Cip1 and p19INK4d signalling was significantly activated by HDAC1/2 inhibition.
2. MATERIALS AND METHODS
2.1. Reagents and antibodies
The HDAC1 inhibitor CI994 (Tacedinaline), the HDAC2 inhibitor Santacruzamate A (CAY10683), and the HDAC1 and HDAC2 inhibitor Romidepsin (FK228) were purchased from Selleck (Shanghai, China). Antibodies against histone H3 (H3, Cat. No. 4499), acetylated histone H3 Lys9/Lys14 (H3K9/14, Cat. No. 9677), H3K9 (Cat. No. 9649), H3K18 (Cat. No. 13998), H3K56 (Cat. No. 4243), H4 (Cat. No. 2592), H4K5 (Cat. No. 8647), H4K12 (Cat. No. 13944), H4K16 (Cat. No. 13534), p21Waf1/Cip1 (Cat. No. 2947) and p53 (Cat. No. 2524S) were purchased from Cell Signaling Technology, Inc. (Danvers, MA, USA). Antibodies against cyclin D1 (CCND1, Cat. No. 340297), CCNA1 (Cat. No. 340294) and CDKN2D (Cat. No. 506556) were purchased from Zen BioScience Co., Ltd. (Chengdu, China). Anti‐p16INK4a (Cat. No. ET1608‐62) was purchased from HuaAn Biotechnology Co., Ltd. (Hangzhou, China). Antibodies against Bax (Cat. No. RLT0456) and Bcl‐2 (Cat. No. RLM3041) were purchased from Ruiying Biological (Suzhou, China). Anti‐p19INK4d (Cat. No. 10272‐2‐AP) was bought from Proteintech (Manchester, UK). Anti‐Ki67 (Cat. No. PA5‐16785) was obtained from Thermo Scientific (Shanghai, China). Antibodies against HDAC1 (Cat. No. ab7028) and HDAC2 (Cat. No. ab12169) were purchased from Abcam (Cambridge, UK).
2.2. Cell culture
The human HCC cell lines HepG2, Huh7, and MHCC97H were cultured in DMEM supplemented with 10% foetal bovine serum, streptomycin (100 mg/mL) and penicillin (100 U/mL). The normal liver cell line L02 was cultured in RPMI 1640 medium with 10% foetal bovine serum, streptomycin (100 mg/mL) and penicillin (100 U/mL). Cultured cells were maintained at 37°C and 5% CO2 in a humid environment and passaged when the confluency reached 80%. Different concentrations of inhibitors were diluted in DMSO based on their IC50 and added 2‐3 days before the cells were processed for further analyses.
2.3. Cell proliferation assay
Two HCC cell lines were treated with different HDACis for the indicated time periods, and the cells were then harvested for cell proliferation analysis using a cell counting kit‐8 (Biotool, Shanghai, China) according to the manufacturer's instructions.
2.4. Western blot analysis
For SDS‐PAGE and immunoblotting, cells were plated at 105 cells/mL in 6‐well plates, treated with various inhibitors as indicated, and then lysed in whole cell lysis buffer (0.5 mol/L Tris‐HCl, pH 6.8, 2% SDS, 10% glycerol, 1% β‐mercaptoethanol and 0.02% bromophenol blue). The samples were boiled at 100°C for 5 minutes. The boiled samples containing 30 μg of protein were subjected to gel electrophoresis. The proteins were then transferred onto PVDF membranes by electroblotting for 90 minutes. The blots were blocked with 50 g/L non‐fat dry milk in a TBS‐Tween solution for 1 h at room temperature and then incubated at 4°C overnight with primary antibodies against different proteins. Anti‐GAPDH (1:5000) from ZSGB‐BIO served as a loading control. After incubation with horseradish peroxidase‐coupled anti‐IgG antibodies at room temperature for at least 1 hour, the blots were developed using enhanced chemiluminescent detection (GE Healthcare) and subsequently exposed to Hyperfilm ECL film. The primary antibodies were directed against H3K9/14 (1:1000), H3K56 (1:1000), H4 (1:1000), H4K5 (1:1000), H4K12 (1:1000) and H3 (1:2000).
2.5. Cell cycle analysis and apoptosis assay
Cells were seeded at a density of 1.0 × 10⁶ cells/mL, and the cell cycle distribution was analysed by flow cytometry after treatment with different inhibitors. After washing twice with PBS, the cells were harvested and collected by centrifugation, followed by fixation in ice‐cold 70% ethanol at −20°C overnight. Then, the cells were collected and stained with 100 μL of PI staining solution for 30 minutes in the dark, followed by cell cycle analysis. The cells were washed with PBS, detached with trypsin, and harvested. Apoptotic cells were detected with an Annexin‐V‐FITC Apoptosis Detection Kit (Biotool, Shanghai, China), according to the manufacturer's instructions.
2.6. Quantitative real‐time PCR
Primers were designed using Primer 3 online software and synthesized by HuaDa (Shanghai, China) (Table 1). Total RNA was isolated from cells using TRIzol reagent, and reverse transcription was performed using an iScript cDNA Synthesis Kit (Bio‐Rad, Hercules, CA, USA) following the manufacturer's instructions. To quantify the transcript levels of the genes of interest, quantitative real‐time PCR (qRT‐PCR) was performed using SYBR Green qPCR Master Mix (Bimake, Houston, TX, USA) on a Bio‐Rad Opticon 2 instruments (Applied Biosystems, CA, USA).
Table 1.
The qPCR primers used in this project
| Primer | Forword | Reverse |
|---|---|---|
| HDAC1 | 5′‐CACATCAGTCCTTCCAATA‐3′ | 5′‐GCAGCATTCTAAGGTTCT‐3′ |
| HDAC2 | 5′‐CCAGAACACTCCAGAATA‐3′ | 5′‐TTCATCTCCACTGTCTTC‐3′ |
| P15 | 5′‐ACGGAGTCAACCGTTTCGGGAG‐3′ | 5′‐GGTCGGGTGAGAGTGGCAGG‐3′ |
| P16 | 5′‐GACATCCCCGATTGAAAGAA‐3′ | 5′‐TTTACGGTAGTGGGGGAAGG‐3′ |
| P19 | 5′‐AGTCCAGTCCATGACGCAG‐3′ | 5′‐ATCAGGCACGTTGACATCAGC‐3′ |
| P21 | 5′‐GATTAGCAGCGGAACAAGGAG‐3′ | 5′‐CAACGTTAGTGCCAGGAAAGAC‐3′ |
| P27 | 5′‐CCACGAAGAGTTAACCCGGG‐3′ | 5′‐GTCTGCTCCACAGAACCGGC‐3′ |
| P53 | 5′‐TTGGGCAGCTGGTTAGGTAGA‐3′ | 5′‐GGTGGATCCAGATCATCATATAC‐3′ |
| Rb | 5′‐AGGATCAGATGAAGCAGATGG‐3′ | 5′‐TGCATTCGTGTTCGAGTAGAAG‐3′ |
| E2F1 | 5′‐CATCAGTACCTGGCCGAGAG‐3′ | 5′‐TGGTGGTCAGATTCAGTGAGG‐3′ |
| GAPDH | 5′‐CGGAGTCAACGGATTTGGTCGTAT‐3′ | 5′‐AGCCTTCTCCATGGTGGTGAAGAC‐3′ |
2.7. Chromatin immunoprecipitation (ChIP) assay
The distribution of transcription factors associated with the p19INK4d and p21Waf1/Cip1 promoters was measured using ChIP assay kits (17‐611, Merck Millipore, GER) according to the manufacturer's instructions. HepG2 cells treated with different selective HDAC inhibitors were collected. Then, a sonicator was used to shear the DNA in lysis buffer containing both phosphatase and protease inhibitors (Roche) to obtain the optimal DNA fragment size of 100‐200 bp. The DNA was run on a 1.5% agarose gel to verify the DNA fragment size. The sheared chromatin was immunoprecipitated with antibodies against acetylated H3K9, H3K18, H3K56, H4K5, H4K12 and H4K16. All antibodies for the ChIP assays were purchased from CST. DNA was extracted by chloroform and subjected to quantitative RT‐PCR (Bio‐Rad, CA) using primers specific to the promoter. The primer pairs used to amplify the p19INK4d and p21Waf1/Cip1 promoters were as follows: p19INK4d, forward: 5′‐TTG AAA ACC GAA AAC CCC GC‐3′, reverse: 5′‐ CCC GAA CGC AAC TGA TTT GT‐3′; p21Waf1/Cip1, forward: 5′‐ TTG TTG GGG TGT CTA GGT GC‐3′, reverse: 5′‐ ACT CTG GCA GGC AAG GAT TT ‐3′.
2.8. Xenograft studies
Four‐week‐old nude mice were bred in house and used for animal experiments. The animal study and experimental protocols were approved by the IACUC. The animals were maintained and handled in accordance with the Guidelines for the Accommodation and Care of Animals. All mice were housed in standard conditions with a 12‐hour light/dark cycle and had access to food and water ad libitum. MHCC97H cells (6 × 10⁶) were injected subcutaneously into mice. The subcutaneous tumours were treated with an intratumoural injection of CI994, CAY10683, FK228 or SAHA. Tumour size was measured and recorded every other day for 21 days, and the tumour weight was calculated after the mice were sacrificed.
2.9. Haematoxylin‐eosin (H&E) staining
H&E staining was used to observe histopathological alterations of the subcutaneously implanted tumours in nude mice. The tissue was fixed with 4% paraformaldehyde, dehydrated using a graded ethanol series, embedded in paraffin (Thermo Fisher Scientific Inc., USA), and cut into sections (5 μM). The sections were subjected to conventional dewaxing and were stained with H&E for 10 minutes. After washing in running water for 15 minutes, a 1% alcohol solution was used for differentiation. The sections were washed, dehydrated using a graded ethanol series, and re‐dyed with haematoxylin for 2 minutes. After dehydration, clearing and sealing with resinene, an Olympus CX31 microscope was used to observe pathological changes in the tissue.
2.10. Immunohistochemistry
Four‐μm‐thick paraffin sections of xenograft HCC tumour tissues were prepared. After the slides were incubated in xylene and a graded ethanol series, antigen retrieval was performed, and the slides were then blocked with hydrogen peroxide. The sections were incubated with a primary antibody against Ki‐67 at 4°C overnight, and then a biotinylated secondary antibody and ABC Peroxidase Staining Kit (Thermo Fisher Scientific, USA) were used. After that, the sections were counterstained with haematoxylin.
2.11. Cell transfection
Cells were plated at between 40% and 60% confluence 1 day before transfection. Transfection with siRNAs against the Hdac1 or Hdac2 gene was performed using Lipofectamine 2000 (Invitrogen, USA) according to the manufacturer's protocol. The siRNAs were purchased from TranSheep Bio (Shanghai, China), and the sequences were as follows: siRNA‐HDAC1, 5′‐CCC GGA GGA AAG UCU GUU A‐3′; and siRNA‐HDAC2, 5′‐CCC AUA ACU UGC UGU UAA A‐3′. Scrambled siRNA was used as a control.
2.12. Statistical analysis
Statistical analysis was performed using spss 13.0 software for Windows. Significant differences were calculated using the t test or 1‐way ANOVA for paired samples. P ≤ .05 was regarded as significant and P ≤ .01 as highly significant.
3. RESULTS
3.1. HDAC1 and 2 expression predicted HCC patient survival
To clarify the function of HDACs during the carcinogenesis of HCC, we analysed the variation in and prognostic value of HDAC1, 2 and 3 expression levels in an independent cohort of 373 HCC (including 50 paired tumour and normal liver tissues) from The Cancer Genome Atlas (TCGA) database. The expression levels of both HDAC1 and HDAC2 were significantly higher in tumour tissues than in normal liver tissues, while HDAC3 showed no difference between the 2 types of tissue (Figure 1A‐C). To additionally explore whether high HDAC1/2 expression was associated with HCC progression, we next determined the relationship between HDAC1/2/3 expression and patient survival. We divided the patients into a high HDAC expression group and a low HDAC expression group. Our results showed that high HDAC1/2 expression predicted poor survival for HCC patients (Figure 1D,E). Consistent with its expression levels, low or high HDAC3 expression was not correlated with HCC patient survival (Figure 1F). These results suggest that upregulation of HDAC1 and 2 in HCC may contribute to disease progression.
Figure 1.

HDAC1 and 2 expression predicts HCC patient survival, based on data from the TCGA database. (A‐C) Expression levels of HDAC1, 2 and 3 in patients with HCC. (D) The overall survival of 109 patients who were divided into a high HDAC1 expression group (n = 57) and a low HDAC1 expression group (n = 52). (E) The overall survival of 101 patients who were divided into a high HDAC2 expression group (n = 40) and a low HDAC2 expression group (n = 61). (F) The overall survival of 102 patients who were divided into a high HDAC3 expression group (n = 46) and a low HDAC3 expression group (n = 56)
3.2. Selective inhibition of HDAC1 and 2 led to changes in cell morphology, growth and cell cycle progression
Based on the clinical data indicating that HDAC1/2 are highly expressed in HCC, we hypothesized that HDAC1 and 2 might be essential for HCC progression and that inhibition of HDAC1/2 might contribute to HCC therapy. Therefore, we next sought to investigate the effects of HDAC inhibitors on HCC cells. We used the selective HDAC1 inhibitor Tacedinaline (CI994),24 the selective HDAC2 inhibitor Santacruzamate A (CAY10683),25 the HDAC1/2 common inhibitor Romidepsin (FK228)26 and the global HDAC inhibitor Vorinostat (SAHA)24, 27 to treat L02, HepG2 and Huh7 cells (Table 2).
Table 2.
Target profile of CI994, CAY10683, FK228 and SAHA
| HDACi | Reference | HDAC1 IC50 (μM) | HDAC2 IC50 (μM) | HDAC3 IC50 (μM) | HDAC8 IC50 (μM) | HDAC4 IC50 (μM) | HDAC6 IC50 (μM) |
|---|---|---|---|---|---|---|---|
| CI994 | 24 | 0.41 | 0.9 | 1.2 | ≥100 | ‐ | > 100 |
| CAY10683 | 25 | ‐ | 0.119 × 10⁻³ | ‐ | ‐ | > 1.0 | 0.434 |
| FK228 | 26 | 0.036 | 0.047 | ‐ | ‐ | 0.51 | 14 |
| SAHA | 24, 27 | 0.06 | 0.25 | 0.02 | 0.83 | > 1.0 | 0.009 |
IC50, Inhibitor concentration 50%.
To confirm the effect of different HDACis, protein was extracted from cells treated with the different inhibitors, and the level of histone acetylation was visualized by Western blotting with specific antibodies. Our results showed that in cells treated with CI994, the acetylation levels of H3K9 and H2AK5 were not significantly different from those in control cells. By contrast, the acetylation of H3K18, H3K56, H4K8 and H4K12 increased dose‐dependently in response to CI994 treatment (Figure S1A). This effect appears to be specific to HDAC1, as it was not observed in cells treated with the HDAC2 inhibitor (CAY10683). However, both CI994 and CAY10683 induced an increase in H4K12 acetylation. The HDAC2 inhibitor CAY10683 did not increase the acetylation level of any H3 site but specifically induced H4K12 and H4K5 acetylation (Figure S1B). Indeed, cells treated with a single inhibitor showed an increase in acetylation at specific sites, while cells that received combined treatment (CI994+CAY10683) had increased acetylation at sites affected by either inhibitor (Figure S1C). Furthermore, FK228 had a similar effect as combined treatment (CI994+CAY10683) in HepG2 cells (Figure S1D). The global HDAC inhibitor SAHA not only affected H3K18, H3K56, H4K5, H4K8 and H4K12 acetylation but also affected acetylation at H2AK5, H3K9 and H3K9/14 (Figure S1E). A similar effect was observed on the acetylated histone levels in Huh7 cells (Figure S1F).
We evaluated the effect of the HDACis on cell morphology, growth and the cell cycle. In L02 cell, all of the 4 HDACis did not induce cell morphological change compared with control (Figure S2A). In HCC cells, treatment with either CI994 or CAY10683 did not induce cell morphological changes compared with control cells. By contrast, treatment with either FK228 or SAHA had a significant effect on cell morphology. Interestingly, treatment with CI994+CAY10683 had a similar effect as treatment with FK228 and SAHA (Figure 2A). A CCK‐8 assay further showed that CI994 or CAY10683 treatment did not affect cell proliferation. However, CI994+CAY10683‐ and FK228‐treated cells showed obvious growth inhibition. In addition, cells treated with SAHA showed a limited effect for cell proliferation (Figure 2B).
Figure 2.
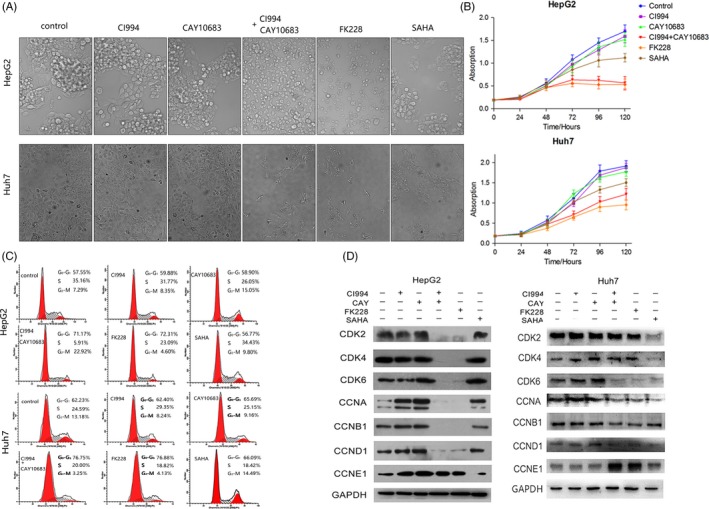
Effect of HDAC inhibitors on the morphology, growth and cell cycle distribution of HCC cells. The experimental groups were the Control, CI994, CAY10683, CI994+ CAY10683, FK228 and SAHA groups. (A) HepG2 and Huh7 cell morphology viewed under a microscope. (B) CCK‐8 staining of HepG2 and Huh7 cells treated with HDAC inhibitors. (C) Effect of HDAC inhibitors on HepG2 and Huh7 cell cycle distribution. (D) Effect of HDAC inhibitors on the expression of key cell cycle‐related proteins in HepG2 and Huh7 cells
As FK228‐ and CI994+CAY10683‐treated HCC cells showed growth inhibition, we next sought to analyse the cell cycle distribution. As shown in Figure 2C, there were few cell cycle differences between control and CI994/CAY10683‐treated cells. By contrast, FK228‐treated cells showed a reduced percentage of cells in S phase and a corresponding increase in G1 phase. Moreover, the CI994 + CAY10683 group also showed a reduced percentage of cells in S phase (Figure 2C). However, both FK228 and CI994 + CAY10683 showed a less effect on L02 cell (Figure S2B). We also examined the protein levels of cell cycle markers in cells treated with different HDACis. The expression of cyclin D1, CDK4 and CDK6, all of which appear in the early G1 phase, showed same levels in L02 cell but was significantly downregulated after CI994+CAY10683 or FK228 treatment in HepG2 and Huh7 cells (Figure S2C; Figure 2D). In addition, CDK2 and cyclin B1, which are specifically expressed at the G1/S or G2/M checkpoint, were markedly reduced in HepG2 cells treated with both HDAC1 and 2 inhibitors (Figure 2D). These observations correlate well with the slow proliferation phenotype observed in cells treated with both HDAC1 and 2 inhibitors.
3.3. Selective inhibition of HDAC1 and 2 led to cell apoptosis
To investigate the effects of HDAC inhibitors on cell apoptosis, we performed an Annexin‐V staining followed by flow cytometric analysis. The results of HepG2 and Huh7 cells showed that treatment with CI994 or CAY10683 did not induce cell apoptosis. By contrast, cells treated with FK228 showed a significant increase in apoptosis. Cells treated with CI994 + CAY10683 show a similar effect as those treated with FK228 (Figure 3A,B). We additionally detected the protein levels of Bax and Bcl‐2 and analysed the Bax/Bcl‐2 ratio, which indicates apoptosis. Consistent with the Annexin‐V staining, cells treated with CI994 + CAY10683 or FK228 exhibited high apoptosis levels, while cells treated with CI994 or CAY10683 showed no differences compared with control cells (Figure 3C,D). Interestingly, cells stimulated with SAHA showed an increased Bax/Bcl‐2 ratio (Figure 3C,D). Taken together, these data further confirmed that inhibiting HDAC1/2 significantly induced the apoptosis of HCC cells.
Figure 3.
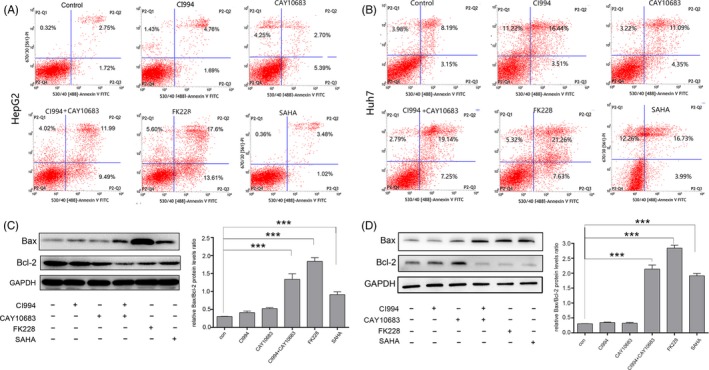
Effect of HDAC inhibitors on HCC cell apoptosis. The experimental groups were the Control, CI994, CAY10683, CI994+ CAY10683, FK228 and SAHA groups. (A) and (B) Treating HepG2 and Huh7 cells with FK228 and CI994+CAY10683 had a significant effect on cell apoptosis compared with the other groups. (C) and (D) FK228 and CI994+CAY10683 significantly increased the expression of Bax and decreased the expression of Bcl‐2. The Bax/Bcl‐2 ratio was significantly higher in FK228‐ and CI994+CAY10683‐treated groups than in the control, CI994, CAY10683 and SAHA groups. GAPDH expression served as an internal control
3.4. Treatment with selective inhibitors of HDAC1 and 2 suppressed the subcutaneous xenograft growth of HCC tumours in nude mice
To further estimate the HCC inhibition mediated by HDAC1/2 inhibitors in vivo, we generated subcutaneous xenograft tumours by transplanting HCC cells into nude mice. Because Huh7 and HepG2 cells failed to grow and form xenografts (data not shown), we subcutaneously injected MHCC97H cells into nude mice. The subcutaneous tumours were allowed to grow for 4 weeks and were then treated with an intratumoural injection of CI994, CAY10683, FK228 or SAHA (Figure 4A). The volume and weight of the tumours did not exhibit statistically significant differences in the mice treated with CI994, CAY10683 or SAHA. However, after 4 injections of FK228, the weight of implanted tumours decreased by 1.6‐fold, suggesting the growth of the tumours was remarkably inhibited (Figure 4B,C). We additionally performed H&E staining to analyse the histopathological alterations of these tumour tissues. The implanted tumours of mice treated with placebo (control group) showed cell distortion and deepened staining of the nuclei, as well as vessel‐like structures (Figure 4D). Compared with the control group, injection of CI994 or CAY10683 did not affect the tumour morphology but reduced the number of vessel‐like structures, while injection with SAHA led to morphological abnormalities of the tumour cell nuclei. Notably, mitotic nuclei could be found in all of these groups except in mice treated with FK228, which led to dissolution of most of the nuclei. The remaining nuclei in the FK228‐treated group showed typical characteristics of programmed cell death (PCD), including the formation of emboli in the nuclear envelope, chromatin condensation and aggregation formation near the nuclear envelope (Figure 4D). Finally, immunohistochemical staining of the proliferation marker Ki67 was performed, and the results showed that selective inhibition of HDAC1/2 by FK228 significantly reduced cell proliferation (Figure 4D).
Figure 4.
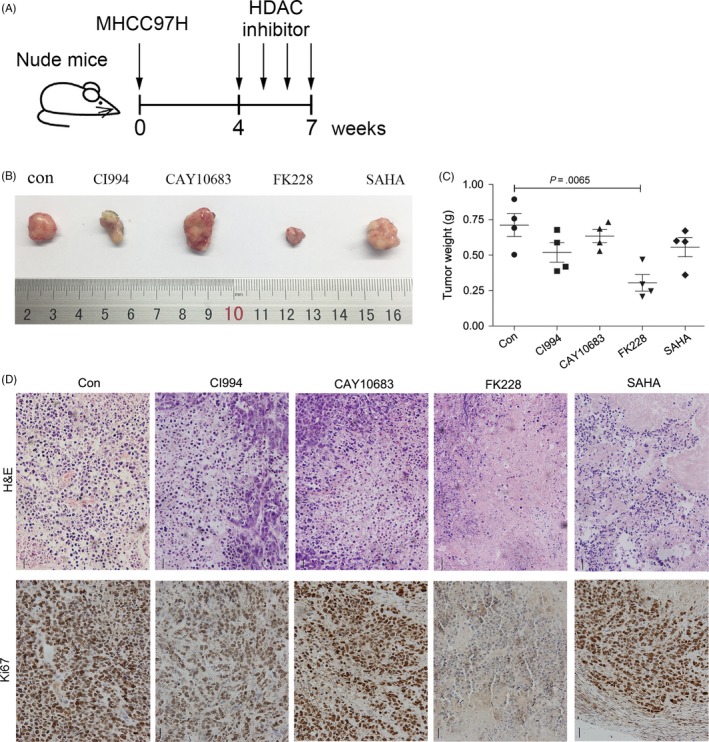
The anti‐tumour effects of HDAC inhibitors on the growth of subcutaneous HCC xenograft tumours in nude mice. (A) Subcutaneous tumours in nude mice were allowed to grow for 4 weeks and were then treated with intratumoural injections of CI994, CAY10683, FK228 or SAHA. (B) Ex vivo tumour images and (C) tumour weight at the end of the experiment. Scale bar, 1 cm. (D) H&E staining and IHC analysis of Ki67 were performed to examine the histopathological alterations and proliferation of HCC tumours injected with HDAC inhibitors
3.5. Inhibiting HDAC1/2 significantly increased p19INK4d and p21Waf1/Cip1 expression by upregulating the acetylation of H3K18, H3K56 and H4K12
As HDAC1/2‐inhibited HCCs showed significant cell cycle arrest, and CDK expression was downregulated in the Western blotting results (Figure 2D), we next sought to identify the molecular mechanisms underlying the inhibition of proliferation. For this, cyclin‐dependent kinase inhibitor proteins, including p16INK4a, p19INK4d, p21Waf1/Cip1, p27Kip1 and p53, were detected. Our results showed that the p19INK4d and p21Waf1/Cip1 mRNA and protein levels were significantly higher in HepG2 and Huh7 cells treated with CI994+CAY10683 or FK228 compared with control cells (Figure 5A‐C). This deregulation of p21Waf1/Cip1 and p19INK4d is due to the inhibition of HDAC1 and HDAC2, as it was not observed in wild‐type cells or in cells treated with SAHA. By contrast, we did not observe obvious changes in the expression of other CDKNs (Figure S3). To our surprise, p16INK4a, an inhibitor of CDK4 and CDK6, was downregulated after treatment with CI994+CAY10683 or FK228 but was not affected by the inhibition of HDAC1 or 2 only (Figure S3). Together, these data demonstrated that HDAC1 and 2 jointly regulate the cell cycle progression of HCC cells through p19INK4d and p21Waf1/Cip1, which mediate cellular senescence via p53‐independent pathways.
Figure 5.
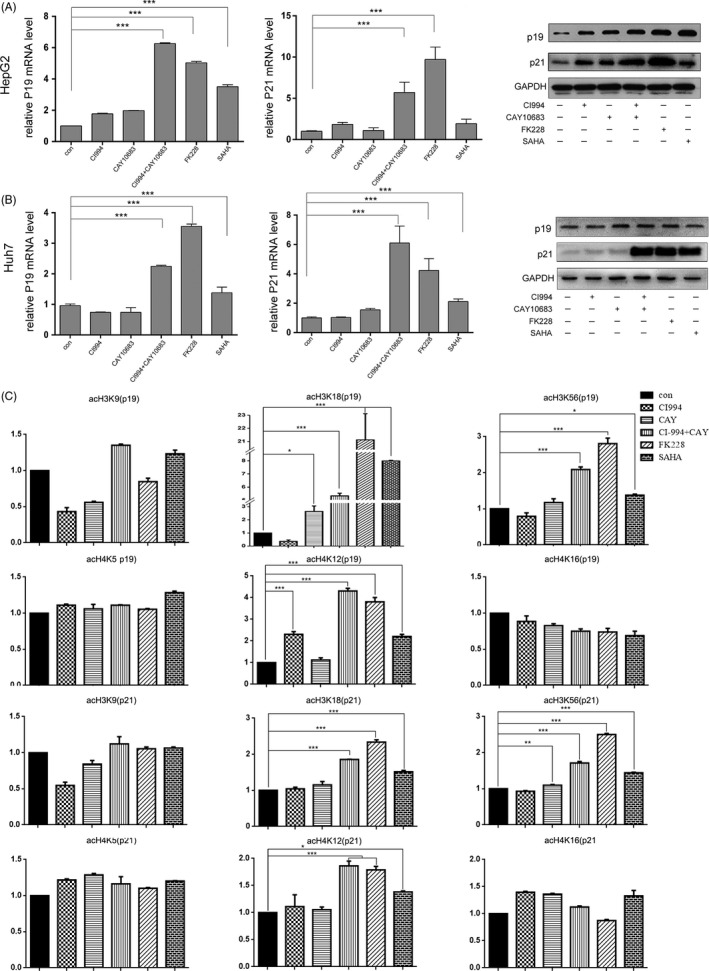
The expression of tumour‐suppressor genes in HepG2 and Huh7 cells. The experimental groups were the Control (no HDACi treatment), CI994, CAY10683, CI994+ CAY10683, FK228 and SAHA groups. (A) and (B) mRNA and protein levels of the tumour‐suppressor genes p21Waf1/Cip1 and p19INK 4d in HepG2 and Huh7 cells. The mRNA levels are presented as fold changes compared with the control group. The protein expression of p21Waf1/Cip1 and p19INK 4d was measured by Western blot analysis. GAPDH expression served as an internal control. (C) ChIP assays with monoclonal antibodies against H3K9, H3K18, H3K56, H4K5, H4K12 and H4K16 revealed a significantly higher occupancy of H3K18, H3K56 and H4K12 in the promoter regions of p21Waf1/Cip1 and p19 INK 4d in FK228‐ and CI994+CAY10683‐treated groups than in the control, CI994, CAY10683 and SAHA groups
To elucidate the mechanism by which HDAC1 and 2 regulate the expression of p19INK4d and p21Waf1/Cip1, we next used ChIP assays to examine the status of histone acetylation within the p19INK4d and p21Waf1/Cip1 promoter regions. H3K9 acetylation was not increased in cells stimulated with CI994 or CAY10683 alone (Figure 5C), which was consistent with previous results showing that this amino acid site is not the target of these 2 selective HDAC 1/2 inhibitors (Figure S1). Similar to H3K9, analysis of the H4K5 and H4K16 acetylation status revealed that inhibition of HDAC1/2 did not cause an increase in the acetylation of these 2 sites in the p19INK4d and p21Waf1/Cip1 promoter regions (Figure 5C). Interestingly, the promoters of both the p19INK4d and p21Waf1/Cip1 genes showed an increase in H3K18, H3K56 and H4K8 acetylation (Figure 5C). These results indicate that inhibition of both HDAC1 and 2 is required for the hyperacetylation of histone H3 and histone H4 associated with increased expression of the p19INK4d and p21Waf1/Cip1 genes during the cell cycle arrest of HCC cells.
3.6. Transcriptional inhibition of HDAC1 and 2 by siRNA suppressed HCC cell growth by upregulating p19INK4d and p21Waf1/Cip1
The above data suggest that CI994 + CAY10683 and FK228 inhibit HCC growth by upregulating the acetylation levels of specific histone lysine sites that are targets of HDAC1 and 2. To test this idea, we examined the effect of siRNA‐mediated loss of function of HDAC1/2. siRNAs against HDAC1, HDAC2, or HDAC1+2 were transfected into HepG2 cells. Efficient knockdown of HDAC1 and HDAC2 by their corresponding siRNA was verified by qRT‐PCR and Western blotting (Figure 6A). Indeed, simultaneous knockdown of HDAC1/2 significantly reduced the percentage of cells in S‐M phase and caused a corresponding increase in G1 phase (Figure 6B). Similar to the results obtained upon pharmacological inhibition of HDAC1/2, the expression levels of CDK2, CDK4 and CDK6 were decreased by 35%‐70% in response to HDAC1/2 knockdown (Figure 6C). Although knockdown of HDAC1 or 2 alone did not significantly increase HCC apoptosis, simultaneous knockdown of HDAC1 and 2 obviously increased HCC apoptosis (Figure 6D). In addition, qRT‐PCR and Western blot assays indicated that p19INK4d and p21Waf1/Cip1 levels substantially increased following HDAC1/2 downregulation (Figure 6E). Taken together, these results further suggested that direct inhibition of HDAC1 and HDAC2 results in cell cycle blockage and apoptosis via the upregulation of p19INK4d and p21Waf1/Cip1.
Figure 6.
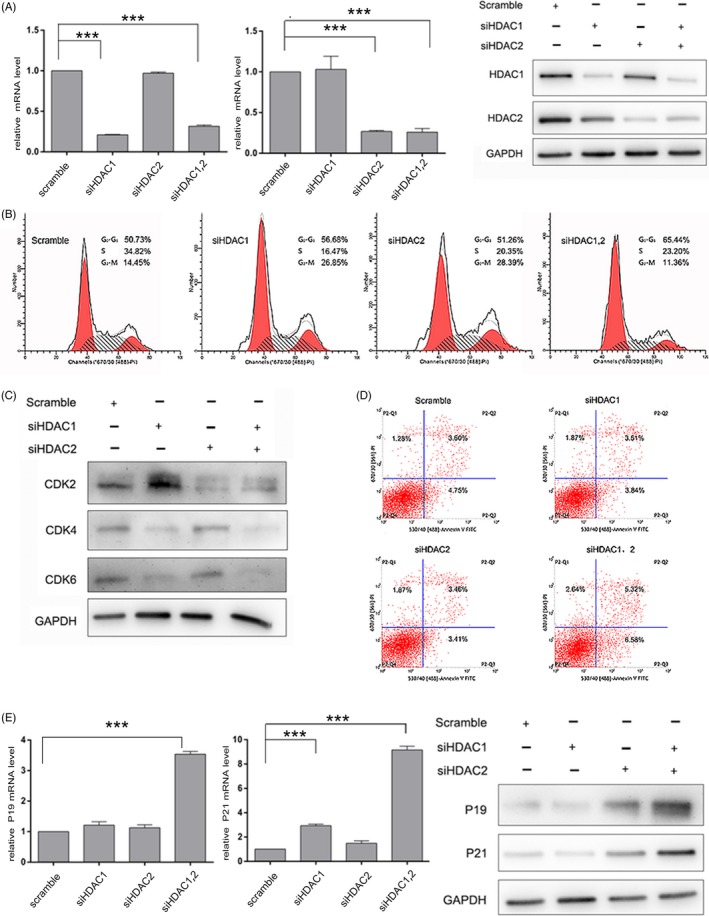
Transcriptional HDAC1/2 inhibition leads to cell cycle blockage and apoptosis in liver cancer cells. (A) qRT‐PCR and Western blot analyses of HDAC1 and HDAC2 were performed after siRNA transfection. The levels of HDAC1 and HDAC2 are expressed as ratios to that of GAPDH. (B) Flow cytometric analyses of cell cycle distribution was performed after siRNA transfection. (C) Immunoblotting of CDKs was performed after siRNA transfection. (D) Flow cytometric analyses of apoptosis was performed after siRNA transfection. (E) and (F) The expression of p19INK 4d and p21Waf1/Cip1 was measured by qPCR and Western blot analyses. GAPDH expression served as an internal control
4. DISCUSSION
Though HDAC activity has been reported to be upregulated in many cancers, including HCC, the results of clinic trials targeting HDAC activity in HCC, as well as in other solid tumours, have been disappointing. In this study, we investigated the roles of HDAC1 and 2 in HCC and demonstrated that combined inhibition of HDAC1 and 2 specifically induced the expression of the cyclin‐dependent kinase inhibitors p21Waf1/Cip1 and p19INK4d, which blocked cell cycle progression and induced apoptosis.
Lysine residues in histones are often the targets of HDACs. However, the precise targets of HDACs are variable in different cells. For example, HDAC1/2 regulates the acetylation of H3K14 and H4K8 in mouse embryonic fibroblasts (MEFs) and the acetylation of H3K56 and H4K16 in human BJ primary fibroblast cells.20, 28 We found that with increasing concentrations of selective HDAC1/2 inhibitors, the acetylation levels of H3K18, H3K56, H4K5 and H4K12, but not H4K16 or H3K9, were upregulated in HCC cells. H3K56 and H3K18, which function in DDR, are checkpoint markers and play key roles in either the G1/S or G2/M transition in the cell cycle.29, 30 These results indicated a potential pharmacological mechanism of selective HDAC1/2 inhibitors in HCC treatment.
Similarly to observations in other solid tumours, such as colon,31 breast32 and lung carcinomas,33 HDAC1/2 levels are elevated in HCC and promote malignant progression of HCC, demonstrating the essential role of these proteins in tumour cell proliferation and viability.34 Indeed, in the current study, we found that selective inhibition of HDAC1 and 2 led to HCC cell morphology changes, growth inhibition, cell cycle arrest and apoptosis in vitro and suppressed the growth of subcutaneous HCC xenograft tumours in vivo. However, individual inhibition of either HDAC1 by CI994 or HDAC2 by CAY10683 did not show significant cytotoxicity in HepG2 cells, indicating that there is a functional compensation between HDAC 1 and 2.
Different mechanisms have been proposed to explain the pro‐tumorigenic role of HDACs, most notably the hypoacetylation and consequent transcriptional repression of the gene encoding the tumour‐suppressor p21Waf1/Cip1 and upregulation of apoptosis.16 p21Waf1/Cip1 is a key regulator of the G1/S transition and inhibits CDK2 in a p53‐dependent or p53‐independent manner.35, 36 Our results on the expression of apoptosis‐related proteins and cyclins/CDKs confirmed these reports. Furthermore, our data support the view that selective inhibitors of HDAC1 and 2 can induce p21Waf1/Cip1 expression in a p53‐independent manner, as p21Waf1/Cip1 was upregulated in HDAC1/2‐inhibited HCC cells, while the levels of p53 and other oncogenes were unchanged.
Importantly, cyclin E/CDK2 is a G1/S checkpoint complex, and upregulation of p21Waf1/Cip1 theoretically blocks cells in late G1 phase. Thus, early G1 phase‐related proteins such as cyclin D1 and CDK4/6 may be enriched. However, our results showed that these proteins were not enriched but downregulated. Further analysis showed that p19INK4d, a member of the INK4 family involved in CDK4/6 inhibition and G1 phase arrest, was upregulated by HDAC inhibitors. Previous research by Youichirou Matsuzaki et al demonstrated that Trichostatin A enhances p19INK4d promoter activity and upregulates p19INK4d mRNA and protein levels in a T‐cell leukaemia cell line, resulting in a hyperphosphorylated form of the retinoblastoma protein being converted into a hypophosphorylated form.37 Our research additionally showed that the anti‐HCC effect of HDAC1/2 inhibition is linked to the ability of these inhibitors to induce acetylation at specific histone sites, a modification that limits the activity of transcription factors by preventing p19INK4d/p21Waf1/Cip1 promoter occupancy.
HDAC1 and 2 regulate gene expression in various ways; for example, increased histone deacetylation by HDAC1/2 at lysine residues prevents transcription from arresting RNA polymerase II binding to DNA. H3K18Ac, H3K56Ac and H4K12Ac are generally markers that indicate transcriptional activation.30, 38, 39 Global HDAC inhibitors have been found to sensitize cancer cells to cell cycle blockage. Hypoacetylation of histones silences cyclin‐dependent kinases (including p19INK4d and p21Waf1/Cip1), and HDAC inhibitors can reverse this effect and lead to cell cycle blockage. Nevertheless, the direct members of HDACs which role in cycle controlling have not been confirmed. Our results suggest that acetylation of H3K18, H3K56 and H4K12 on p21Waf1/Cip1 and p19INK4d promoters are responsible for their transcriptional activity, and HDAC1/2 seems to control p21Waf1/Cip1 and p19INK4d expression through these 3 sites, though there are other acetylation‐modulating site on histones. In normal HCC cells, HDAC1 and 2 deacetylate H3K18, H3K56 and H4K12 and turn off the transcription of p21Waf1/Cip1 and p19INK4d, which lead to CDK2/4/6 activating and promote cell cycle progression. Both FK228 and CI994 + CAY10683 could increase the acetylation levels of H3K18, H3K56 and H4K12 on p21Waf1/Cip1 and p19INK4d promoters, and reverse the expression of p21Waf1/Cip1 and p19INK4d. Global HDAC inhibitor SAHA also partly affect the acetylation of these 3 sites, but much weaker than FK228 or CI994 + CAY10683, indicate that there is a limitation of cycle inhibition. Although SAHA has been approved for CTCL combined with other therapies in clinical trials, selective and joint inhibition of HDAC1/2 would be more effective in HCC treatment.
In summary, our study demonstrated that HDAC1 and HDAC2 dependently associate with p19INK4d and p21Waf1/Cip1 to control the expression of CDK2, 4 and 6. Pharmacological or transcriptional inhibition of HDAC1/2 increases p19INK4d and p21Waf1/Cip1 expression and results in decreased expression of CDKs and cell cycle blockage in HCC (summarized in Figure 7). Therefore, further studies in preclinical models and in clinical settings, alone and in combination with other drugs, such as sorafenib, are now required to determine whether these drugs are candidates for the treatment of HCC patients.
Figure 7.
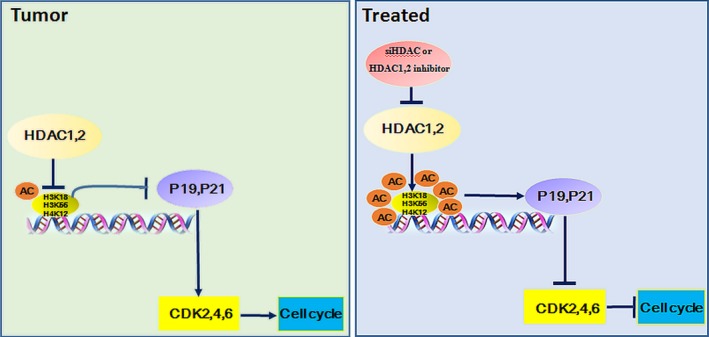
Proposed model for selective inhibition of HDAC1 and HDAC2 in the regulation of hepatocellular carcinoma proliferation
CONFLICT OF INTEREST
The authors who have taken part in this study declared that they do not have anything to disclose regarding funding or conflict of interest with respect to this manuscript.
AUTHOR CONTRIBUTIONS
Conceptualization: H‐Y.Z., Y.C., N.T., A‐L.H. and J.X. Methodology: H‐Y.Z., Y.C., D‐N.L., M‐H.L., Y.S., W‐L.Z., A‐L.H. and J.X. Investigation: H‐Y.Z., Y.C., D‐N.L., M‐H.L, Y.S., K.W., A‐L.H. and J.X. Resources: K.W., N.T., A‐L.H. and J.X. Writing‐original draft: H‐Y.Z., Y.C., D‐N.L., M‐H.L and J.X. Writing‐review and editing: all authors. Supervision: N.T., A‐L.H. and J.X.
Supporting information
ACKNOWLEDGEMENTS
The authors thank Professor Juan Chen for kindly providing the Huh 7 cell line. siRNA designing and synthesis were performed by TranSheep Bio Co.Ltd, Shanghai, China. This work was supported by grants from the Natural Science Foundation of China (No. 81602045, 81371827, 81471946, 81572683 and 81602417), Chongqing basic and frontier research project (cstc2016jcyjA0206) and the Science Fund for Outstanding Young Scholars of Chongqing Medical University (CYYQ201503).
Zhou H, Cai Y, Liu D, et al. Pharmacological or transcriptional inhibition of both HDAC1 and 2 leads to cell cycle blockage and apoptosis via p21Waf1/Cip1 and p19INK4d upregulation in hepatocellular carcinoma. Cell Prolif. 2018;51:e12447 10.1111/cpr.12447
Hengyu Zhou and Ying Cai are the authors who contributed equally to this work.
Contributor Information
Ailong Huang, Email: ahuang@cqmu.edu.cn.
Jie Xia, Email: xiajie@cqmu.edu.cn.
REFERENCES
- 1. Torre LA, Bray F, Siegel RL, Ferlay J, Lortet‐Tieulent J, Jemal A. Global cancer statistics, 2012. CA Cancer J Clin. 2015;65:87‐108. [DOI] [PubMed] [Google Scholar]
- 2. Kew MC. Hepatocellular carcinoma: epidemiology and risk factors. J Hepatocel Carcinoma. 2014;1:115‐125. [DOI] [PMC free article] [PubMed] [Google Scholar]
- 3. Arzumanyan A, Reis HM, Feitelson MA. Pathogenic mechanisms in HBV‐ and HCV‐associated hepatocellular carcinoma. Nat Rev Cancer. 2013;13:123‐135. [DOI] [PubMed] [Google Scholar]
- 4. Maluccio M, Covey A. Recent progress in understanding, diagnosing, and treating hepatocellular carcinoma. CA Cancer J Clin. 2012;62:394‐399. [DOI] [PubMed] [Google Scholar]
- 5. Bosch FX, Ribes J, Diaz M, Cleries R. Primary liver cancer: worldwide incidence and trends. Gastroenterology. 2004;127:S5‐S16. [DOI] [PubMed] [Google Scholar]
- 6. Yun SM, Lee JH, Jung KH, et al. Induction of apoptosis and suppression of angiogenesis of hepatocellular carcinoma by HS‐159, a novel phosphatidylinositol 3‐kinase inhibitor. Int J Oncol. 2013;43:201‐209. [DOI] [PubMed] [Google Scholar]
- 7. Llovet JM, Villanueva A, Lachenmayer A, Finn RS. Advances in targeted therapies for hepatocellular carcinoma in the genomic era. Nat Rev Clin Oncol. 2015;12:408‐424. [DOI] [PubMed] [Google Scholar]
- 8. Llovet JM, Ricci S, Mazzaferro V, et al. Sorafenib in advanced hepatocellular carcinoma. N Engl J Med. 2008;359:378‐390. [DOI] [PubMed] [Google Scholar]
- 9. Cheng AL, Kang YK, Chen Z, et al. Efficacy and safety of sorafenib in patients in the Asia‐Pacific region with advanced hepatocellular carcinoma: a phase III randomised, double‐blind, placebo‐controlled trial. Lancet Oncol. 2009;10:25‐34. [DOI] [PubMed] [Google Scholar]
- 10. Shen YC, Ou DL, Hsu C, et al. Activating oxidative phosphorylation by a pyruvate dehydrogenase kinase inhibitor overcomes sorafenib resistance of hepatocellular carcinoma. Br J Cancer. 2013;108:72‐81. [DOI] [PMC free article] [PubMed] [Google Scholar]
- 11. Gao L, Wang X, Tang Y, Huang S, Hu CA, Teng Y. FGF19/FGFR4 signaling contributes to the resistance of hepatocellular carcinoma to sorafenib. J Exp Clin Cancer Res. 2017;36:8. [DOI] [PMC free article] [PubMed] [Google Scholar]
- 12. Haberland M, Montgomery RL, Olson EN. The many roles of histone deacetylases in development and physiology: implications for disease and therapy. Nat Rev Genet. 2009;10:32‐42. [DOI] [PMC free article] [PubMed] [Google Scholar]
- 13. Yang XJ, Seto E. The Rpd3/Hda1 family of lysine deacetylases: from bacteria and yeast to mice and men. Nat Rev Mol Cell Biol. 2008;9:206‐218. [DOI] [PMC free article] [PubMed] [Google Scholar]
- 14. Yang XJ, Seto E. Collaborative spirit of histone deacetylases in regulating chromatin structure and gene expression. Curr Opin Genet Dev. 2003;13:143‐153. [DOI] [PubMed] [Google Scholar]
- 15. Falkenberg KJ, Johnstone RW. Histone deacetylases and their inhibitors in cancer, neurological diseases and immune disorders. Nat Rev Drug Discov. 2014;13:673‐691. [DOI] [PubMed] [Google Scholar]
- 16. Damaskos C, Karatzas T, Nikolidakis L, et al. Histone deacetylase (HDAC) inhibitors: current evidence for therapeutic activities in pancreatic cancer. Anticancer Res. 2015;35:3129‐3135. [PubMed] [Google Scholar]
- 17. Lehmann M, Hoffmann MJ, Koch A, Ulrich SM, Schulz WA, Niegisch G. Histone deacetylase 8 is deregulated in urothelial cancer but not a target for efficient treatment. J Exp Clin Cancer Res. 2014;33:59. [DOI] [PMC free article] [PubMed] [Google Scholar]
- 18. Kim HJ, Bae SC. Histone deacetylase inhibitors: molecular mechanisms of action and clinical trials as anti‐cancer drugs. Am J Transl Res. 2011;3:166‐179. [PMC free article] [PubMed] [Google Scholar]
- 19. Yang XJ, Seto E. HATs and HDACs: from structure, function and regulation to novel strategies for therapy and prevention. Oncogene. 2007;26:5310‐5318. [DOI] [PubMed] [Google Scholar]
- 20. Yamaguchi T, Cubizolles F, Zhang Y, et al. Histone deacetylases 1 and 2 act in concert to promote the G1‐to‐S progression. Genes Dev. 2010;24:455‐469. [DOI] [PMC free article] [PubMed] [Google Scholar]
- 21. Montgomery RL, Davis CA, Potthoff MJ, et al. Histone deacetylases 1 and 2 redundantly regulate cardiac morphogenesis, growth, and contractility. Genes Dev. 2007;21:1790‐1802. [DOI] [PMC free article] [PubMed] [Google Scholar]
- 22. Rikimaru T, Taketomi A, Yamashita Y, et al. Clinical significance of histone deacetylase 1 expression in patients with hepatocellular carcinoma. Oncology. 2007;72:69‐74. [DOI] [PubMed] [Google Scholar]
- 23. Quint K, Agaimy A, di Fazio P, et al. Clinical significance of histone deacetylases 1, 2, 3, and 7: HDAC2 is an independent predictor of survival in HCC. Virchows Arch. 2011;459:129‐139. [DOI] [PubMed] [Google Scholar]
- 24. Beckers T, Burkhardt C, Wieland H, et al. Distinct pharmacological properties of second generation HDAC inhibitors with the benzamide or hydroxamate head group. Int J Cancer. 2007;121:1138‐1148. [DOI] [PubMed] [Google Scholar]
- 25. Pavlik CM, Wong CY, Ononye S, et al. Santacruzamate A, a potent and selective histone deacetylase inhibitor from the Panamanian marine cyanobacterium cf. Symploca sp. J Nat Prod. 2013;76:2026‐2033. [DOI] [PMC free article] [PubMed] [Google Scholar]
- 26. Furumai R, Matsuyama A, Kobashi N, et al. FK228 (depsipeptide) as a natural prodrug that inhibits class I histone deacetylases. Cancer Res. 2002;62:4916‐4921. [PubMed] [Google Scholar]
- 27. Lauffer BEL, Mintzer R, Fong R, et al. Histone deacetylase (HDAC) inhibitor kinetic rate constants correlate with cellular histone acetylation but not transcription and cell viability. J Biol Chem. 2013;288:26926‐26943. [DOI] [PMC free article] [PubMed] [Google Scholar]
- 28. Miller KM, Tjeertes JV, Coates J, et al. Human HDAC1 and HDAC2 function in the DNA‐damage response to promote DNA nonhomologous end‐joining. Nat Struct Mol Biol. 2010;17:1144‐1151. [DOI] [PMC free article] [PubMed] [Google Scholar]
- 29. Maas NL, Miller KM, DeFazio LG, Toczyski DP. Cell cycle and checkpoint regulation of histone H3 K56 acetylation by Hst3 and Hst4. Mol Cell. 2006;23:109‐119. [DOI] [PubMed] [Google Scholar]
- 30. Barber MF, Michishita‐Kioi E, Xi Y, et al. SIRT7 links H3K18 deacetylation to maintenance of oncogenic transformation. Nature. 2012;487:114‐118. [DOI] [PMC free article] [PubMed] [Google Scholar]
- 31. Di Padova M, Bruno T, de Nicola F, et al. Che‐1 arrests human colon carcinoma cell proliferation by displacing HDAC1 from the p21WAF1/WAF1/CIP1 promoter. J Biol Chem. 2003;278:36496‐36504. [DOI] [PubMed] [Google Scholar]
- 32. Witt AE, Lee CW, Lee TI, et al. Identification of a cancer stem cell‐specific function for the histone deacetylases, HDAC1 and HDAC7, in breast and ovarian cancer. Oncogene. 2017;36:1707‐1720. [DOI] [PMC free article] [PubMed] [Google Scholar]
- 33. Fan C, Pan Y, Yang Y, et al. HDAC1 inhibition by melatonin leads to suppression of lung adenocarcinoma cells via induction of oxidative stress and activation of apoptotic pathways. J Pineal Res. 2015;59:321‐333. [DOI] [PubMed] [Google Scholar]
- 34. Noh JH, Bae HJ, Eun JW, et al. HDAC2 provides a critical support to malignant progression of hepatocellular carcinoma through feedback control of mTORC1 and AKT. Cancer Res. 2014;74:1728‐1738. [DOI] [PubMed] [Google Scholar]
- 35. Xiong Y, Hannon GJ, Zhang H, Casso D, Kobayashi R, Beach D. p21 is a universal inhibitor of cyclin kinases. Nature. 1993;366:701‐704. [DOI] [PubMed] [Google Scholar]
- 36. Harper JW, Adami GR, Wei N, Keyomarsi K, Elledge SJ. The p21 Cdk‐interacting protein Waf1/Cip1 is a potent inhibitor of G1 cyclin‐dependent kinases. Cell. 1993;75:805‐816. [DOI] [PubMed] [Google Scholar]
- 37. Yokota T, Matsuzaki Y, Miyazawa K, Zindy F, Roussel MF, Sakai T. Histone deacetylase inhibitors activate INK4d gene through Sp1 site in its promoter. Oncogene. 2004;23:5340‐5349. [DOI] [PubMed] [Google Scholar]
- 38. LeRoy G, Rickards B, Flint SJ. The double bromodomain proteins Brd2 and Brd3 couple histone acetylation to transcription. Mol Cell. 2008;30:51‐60. [DOI] [PMC free article] [PubMed] [Google Scholar]
- 39. Xie W, Song C, Young NL, et al. Histone h3 lysine 56 acetylation is linked to the core transcriptional network in human embryonic stem cells. Mol Cell. 2009;33:417‐427. [DOI] [PMC free article] [PubMed] [Google Scholar]
Associated Data
This section collects any data citations, data availability statements, or supplementary materials included in this article.
Supplementary Materials