

Abstract
Objectives
SATB2 has been shown to be markedly reduced in colorectal cancer (CRC) tissues relative to paired normal controls; however, the mechanism behind remains not well understood. To investigate why SATB2 was down‐regulated in CRC, we attempted to analyse it from the angle of miRNA‐mRNA modulation.
Materials and methods
SATB2 expression was detected in CRC tissues using immunohistochemistry and verified using real‐time PCR on mRNA level, followed by analysis of clinicopathological significance of its expression. Metastatic variation of CRC cells was evaluated both in vivo and in vitro. To find out the potential miRNA that directly regulate the SATB2, luciferase reporter assay was performed following the bioinformatic prediction.
Results
SATB2 was confirmed to be closely linked with the metastasis and shorter overall survival of CRC in our own cases. Silencing of SATB2 was shown to be able to promote the metastatic ability of CRC cells in vivo, enhancing the epithelial‐mesenchymal transition (EMT). Mechanistically, miR‐34c‐5p was identified to be a novel miRNA that can directly modulate the SATB2. It turned out that the promoter of miR‐34c‐5p was methylated, which leads to the repression of miR‐34c‐5p in CRC. Treatment with 5‐Aza‐dC can reasonably and significantly restore the level of miR‐34c‐5p in CRC cells relative to control, thereby down‐regulating the SATB2.
Conclusions
Together, our study revealed that SATB2 targeted by methylated miR‐34c‐5p can suppress the metastasis, weakening the EMT in CRC.
1. INTRODUCTION
Colorectal cancer (CRC), ranking the 4th most common cancer in China1 and the second leading cause of cancer‐related death in the United States,2 has been a seriously threat for the health of people worldwide. Despite its progress in diagnostic tools that allowed for early cancer diagnosis, tumour recurrence remains a major problem. Approximately 30% of recurrent CRC involves metastasis to liver or lung. Nevertheless, the underlying mechanism by which CRC cells metastasize remains elusive.
SATB2, abbreviated from special AT‐rich sequence‐binding protein 2, has been reported to be implicated in the metastasis of CRC,3, 4 with the consistent findings that SATB2 was significantly down‐regulated in CRC tissues compared with normal control, which leads to the suggestion that SATB2 could play a tumour‐suppressing role in CRC. In addition, several studies indicated that SATB2 could be regulated by some oncogenic miRNAs, for instance, of miR‐1825 and miR‐316 in CRC, where the miR‐182 and miR‐31 were presented to be remarkably elevated. Despite this, why SATB2 was commonly seen to be markedly reduced in CRC tissues was still unclear.
MiR‐34c‐5p, one of the 2 subtypes of miR‐34c that was from miR‐34 family,7, 8 has been suggested to play the tumour‐suppressing role in cancers, including CRC.9 Notably, the miR‐34 family,10 including miR‐34a, miR‐34b and miR‐34c, was found to be subject to methylation in its promoter sequence,11, 12 contributing to the observational phenotype that the level of miR‐34 family was pronouncedly lower in cancer tissues than that in paired normal controls. However, little has been reported regarding the methylated status of miR‐34c‐5p in CRC.
In our current study, to understand the role of SATB2 involved in the metastasis of CRC cells, we were in an effort to address it from the aspect of miRNA‐mRNA modulation. Enlightened by the 2 previous relevant reports,5, 6 we identified that miR‐34c‐5p as a new miRNA that can directly regulate the SATB2 that was shown to be able to suppress the metastasis of CRC cells. Furthermore, it was exhibited that the promoter of miR‐34c‐5p was subjected to methylation, which contributed to the lower level of miR‐34c‐5p in CRC compared with normal control.
2. MATERIALS AND METHODS
2.1. Clinical tissues
The present study was approved by the Medical Ethics Committee of The First Hospital of Hebei Medical University, and written informed consent was obtained from each participant involved. A total of 85 cases of CRC tissues and its paired normal controls were enrolled in the form of formalin‐fixed paraffin‐embedded block in the department of pathology of our hospital. The paired adjacent normal tissue was defined as normal control that was far away from tumour lesion at least more than 5 cm. The corresponding clinicopathological information was tabulated in Table S1 , including gender, age, TNM stage, T classification, N classification, differentiation, recurrent status, distant metastasis, tumour location, tumour size, gross classification and overall prognosis that were retrieved and available in the hospital information system in our department. All CRC tissue blocks whose corresponding haematoxylin‐eosin staining sections were blindly reviewed and examined by 2 separate gastroenterological pathologists before further process.
2.2. Cell culture
The human CRC cell lines HT‐29, Colo‐320, SW480, SW620 and HCT‐15 were obtained from China Center for Type Culture Collection. All these CRC cell lines were cultured in RPMI 1640 medium (catalogue number: #11875093; Thermo Fisher Scientific, MA, USA) supplemented with 10% foetal bovine serum (catalogue number: #16000044; Thermo Fisher Scientific) and 1% penicillin‐streptomycin (catalogue number: #15070063; Thermo Fisher Scientific) at 37°C under 5% CO2 humidified atmosphere, unless otherwise stated. However, normal human colonic epithelial cells (HCoEpiC; ScienCell Research Laboratories, San Diego, CA, USA) were grown on colonic epithelial cell medium (CoEpiCM; ScienCell Research Laboratories) supplemented with colonic epithelial cell growth supplement (CoEpiCGS; ScienCell Research Laboratories) and with penicillin/streptomycin solution (P/S, ScienCell, Research Laboratories), as strongly recommended by ScienCell company.
2.3. Construction and transfection
The small interference RNA (siRNA) target sequences to SATB2 and its corresponding detection primers for qRT‐PCR were designed and biosynthesized by GenePharma company (GenePharma, Shanghai, China), which were listed in Table S2. The lentivirus‐based constructions for short hairpin RNA (shRNA) of SATB2 (which was labelled as Lv‐sh‐SATB2) and overexpression of miR‐34c‐5p (labelled as Lv‐miR‐34c‐5p) as well as their counterpart control vectors were outsourced by GeneChem Company (Shanghai, China). Eukaryotic overexpression vector harbouring full‐length cDNA of SATB2 (labelled as pcDNA‐SATB2) was from Guangzhou Genecopoeia company (catalogue number: Y2082; Genecopoeia, Guangzhou, China). Transient transfection was performed using Lipofectamine 2000 Reagent (Invitrogen, Carlsbad, CA, USA) in Opti‐MEM (Invitrogen) according to the manufacturer's protocol. While for lentiviral transfections, it was strictly carried out following the instructions accompanied.
2.4. Immunohistochemistry (IHC)
Briefly, tissue blocks were sectioned at 4 mm thickness, deparaffinized and subjected to antigen retrieval using 10 mmol/L citrate buffer at 100°C for 15 minutes. IHC was performed on all cases using rabbit polyclonal antibody to human SATB2 (dilution at 1:200; catalogue number: ab34735; Abcam, Cambridge, MA, USA). Primary antibody replaced with normal rabbit isotype IgG antibody was used as negative control when performing IHC. Horseradish peroxidase‐conjugated rabbit anti‐mouse IgG acted as the secondary antibody and was purchased from Abcam (dilution at 1:600; catalogue number: ab97046; Abcam, Cambridge, MA, USA). Staining was performed using a DAB Stain kit (catalogue number: ZLI‐9017; Zhongshanjinqiao, Beijing, China). Sections were counterstained with haematoxylin. The number of cells positive with SATB2 was counted in one random high‐power field (HPF, 400‐fold magnification) 4 times.
2.5. Immunoscoring
Briefly, positive reaction was defined as those whose brown signals were nuclear. Each separate tissue core was scored on the basis of the intensity and area of the positive staining. The staining intensity was scored as follows: negative, marked by −; weak (<30% of cells with positive staining), marked by +; moderate (more than 30% but less 60% with positive staining), marked by ++; and strong positive (more than 60% of cells with positive staining), marked by +++ according to the signal intensity. The negative control for IHC was the substitution of serum isotype IgG at the same protein concentration as the primary antibody; the normal colorectal mucosal was used for positive staining of SATB2. In favour of statistical analysis, we divided all the samples into 2 groups according to positive intensity as follows: negative and weak staining were as low (or low expression for SATB2) and moderate and strong as high (or high expression for SATB2).
2.6. Quantitative real‐time PCR
Total RNA of both CRC and normal tissue sections were extracted using AllPrep DNA/RNA FFPE Kit (catalogue number: 80234; Qiagen, Hilden, German) and were reversely transcribed into 1 μg cDNA with RevertAid First Strand cDNA Synthesis Kit (Catalogue number: #K1622, Thermo Fisher Scientific). Real‐time PCR was performed using SYBR Green Premix PCR Master Mix (Roche, Mannheim, Germany) according to the manufacturer protocols accompanied. Relative mRNA expression of SATB2 and miR‐34c‐5p was calculated using Ct method (2−ΔΔCt) after being normalized to β‐actin and U6, respectively, which were used as internal controls. All reactions were performed independently in triplicate. Sequence of the all primers involved was tabulated in Table S2. The annealing temperature for the 4 genes was 58°C.
2.7. Western blot
Cell lysates were prepared in RIPA lysis buffer (Bioteke, Beijing, China). Equal amount of total cell lysates was separated by 10% SDS‐PAGE and transferred to PVDF membranes incubated with primary antibodies to SATB2 (dilution at 1:800, ab34735; Abcam, Cambridge, UK), E‐cadherin (dilution at 1:1000, #3195; Cell Signaling, Beverly, MA, USA) and β‐actin (#4970, Cell Signaling Technology) overnight. Membranes were subsequently probed with HRP‐conjugated secondary antibodies, and the blots were visualized with chemiluminescence with SuperSignal West Femto Chemiluminescent Substrate (Thermo Scientific), and images were captured with a Bio‐Rad camera system (Bio‐Rad, Hercules, CA, USA). All the detailed information about the primary antibodies involved was tabulated in Table S3.
2.8. 5‐aza‐2′‐deoxycytidine treatment
CRC cells were seeded in 6‐well plate at 1 × 10⁵ cells/well. After culture for 24 hours, 5‐aza‐2 deoxycytidine (5‐Aza‐dC) (Sigma‐Aldrich, Poole, UK) was added in fresh media at a final concentration of 1 μmol/L. Treatment was repeated every 24 hours for 3 consecutive days. After the third day of treatment, the cells were allowed to grow for another 24 hours before the cells were harvested for RNA, DNA, or protein extraction.
2.9. Bisulphite treatment and methylated PCR analysis
Total DNA of 500 ng was bisulphate converted using the EpiTect Bisulfite Kit (Qiagen, Crawley, UK) following the manufacturers' instructions. DNA extraction on all FFPE tissue was performed using the RecoverAll™ Total Nucleic Acid Isolation Kit for FFPE (Life Technologies, Carlsbad, CA, USA) following manufacturer's instructions. Bisulphite converted DNA was PCR amplified using the PyroMark PCR Kit (Qiagen). Primers were designed and synthesized by Shanghai Sangon (Sangon, Shanghai, China) (Table S3). Each reaction was made up to final volume of 20 μL consisting of 2 μL of bisulphate converted DNA, 12.5 μL mastermix, 1.0 μL of each the forward and reverse 10 μmol/L primers, and 4.5 μL nuclease free H20. PCR programme: initial denaturation step for 15 minutes at 95°C followed by 45 cycles of 30 seconds at 94°C, 30 seconds at 70°C, 30 seconds at 72°C and a final elongation step for 10 minutes at 72°C.
2.10. Bioluminescence imaging
Tumour metastasis to lung was monitored using bioluminescence imaging (Odyssey® CLx Infrared Imaging System, Li‐Cor, Lincoln, CA, USA). It was noteworthy that all the lentiviral vectors were fused with bioluminescent tag, which was to say, the mice to be monitored need not to be injected subcutaneously with luciferin before being imaged. The mice were anaesthetized with 2% isoflurane and were imaged using LI‐COR system (Odyssey® CLx Infrared Imaging System). A bioluminescent image was obtained with a 12.5 cm field of view, a binning factor of 8, and a 1/f stop‐and‐open filter. Regions of interest were defined manually, and signal intensities were calculated with Living Image software (Odyssey® CLx Infrared Imaging System) and expressed as photons per second. Background photon flux was defined from a region of interest drawn over a control.
2.11. Statistical analysis
Statistical analysis was performed using the statistical package spss version 17.0 (SPSS, Inc., Chicago, IL, USA). Data were expressed as mean ± standard error of mean (SEM). Association was analysed using the chi‐square test or Fisher's exact test (when expected numbers were <5) when appropriate between high and low expression of SATB2 and clinicopathological variables, including age and gender. Independent sample T test was used to analyse the difference between groups where the continuous data were normal distribution. P values of <.05 were taken to be statistically significant.
3. RESULTS
3.1. SATB2 was markedly down‐regulated in CRC tissues relative to paired normal controls whose reduced expression was linked with superior overall prognosis
SATB2 has been reported to be significantly down‐regulated in CRC tissues compared with paired normal control.3 To confirm the status of SATB2 reported previously in CRC in our own cases, IHC was carried out on the 85 paired cases of CRC and its corresponding normal control. To ensure the sample quality of formalin‐fixed paraffin‐embedded CRC blocks to be used, all the sections were stained using HE, followed by blind review and examination by 2 separate gastroenterological pathologists before being used. Only those CRC sections whose tumour area accounts for at least more than 50% were selected and qualified to be further processed. H&E staining of CRC sections showed that all the cases we enrolled were fundamentally qualified and able to meet the criteria we set from the outset (Figure S1A). On the other hand, given the significant effect the primary antibody potentially exerted over the final outcome of biomedical research,13 we were determined to pre‐evaluate both the specificity and correctness of the primary antibody to SATB2, using the antigen pre‐adsorption method as previously recommended,14 before IHC staining. The pre‐evaluation revealed that both the specificity and correctness of the primary antibody to SATB2 were adequately enough (Figure S1B). Subsequently, we performed the IHC staining, in which the isotype IgG was used as negative control (Figure S1C). IHC detection showed that the expression of SATB2 in CRC tissues varied greatly from case to case ranging from negative, weak positive, moderate to strong positive staining (Figure S1D), with the vast majority of cases being negative and weak positive. By contrast, the moderate and strong expression of SATB2 was commonly present in paired normal control, which was used as positive control (Figure S1E). Taken as a whole, the SATB2 was pronouncedly down‐regulated in CRC tissues in comparison with paired normal control (Figure 1A,B). To further confirm, the detection of SATB2 expression was extended from protein level to mRNA level. In the same cohort as IHC was done, quantitative real‐time PCR (qRT‐PCR) was carried out to quantitatively assess the mRNA level of SATB2. It exhibited that SATB2 mRNA was markedly reduced in CRC tissues relative to paired normal control (Figure 1C), which was highly consistent with the trend reflected by IHC. Next, SATB2 has been suggested to be prognosis‐associated factor in CRC, to confirm the result found previously, we tried to analyse the prognostic as well as clinicopathological significance of SATB2 expression in CRC tissues of our own. We confirmed that reduced expression of SATB2 was significantly linked with inferior overall prognosis (Figure 1D). Clinicopathologically, SATB2 expression was remarkably associated with lymph node metastasis, distant metastasis and tumour size (Table 1). Brought together, all the results we confirmed in our own study demonstrated that SATB2 was significantly reduced in CRC compared with paired normal control.
Figure 1.
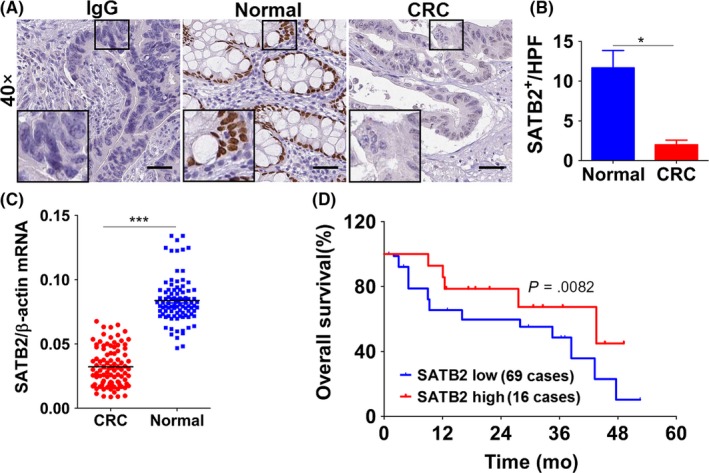
SATB2 was pronouncedly down‐regulated in colorectal cancer (CRC) tissues relative to paired normal controls whose high expression was associated with superior overall prognosis. A, SATB2 was shown to be markedly reduced in CRC tissue compared with its paired normal control, as exemplified by immunohistochemistry. IgG stands for the isotype negative control of the primary antibody to SATB2 we used. Scale bar represents 50 μm; the inset was the magnification of the focal field we deemed as typical. Shown were the representative figures picked up among the candidates; B, quantitative analysis of the immunohistochemical staining of SATB2, which calculated as tumours positively expressing SATB2 per high power field (which hereafter referred to as HPF). *P < .05 in comparison with normal control group using independent sample t‐test analysis; C, confirmation of SATB2 expression on mRNA level in 85 paired cases of fresh tissues that were counterparts of PPFE used to immunohistochemical analysis, as detected by real‐time quantitative PCR (abbreviated as qRT‐PCR). ***P < .001 relative to normal control group using independent sample t‐test analysis. D, Overall prognosis of patients with CRC expressing SATB2. Among 85 cases enrolled, 69 cases were categorized as low expression, whereas the remainder 16 cases were high expression. There was statistically significant difference between patients with low and high expression of SATB2, as analysed by Kaplan‐Meier survival analysis
Table 1.
Correlation between SATB2 expression and clinicopathological characteristics of CRC
| Clinicopathological characteristics | Total | SATB2 expression | χ2 | P | |
|---|---|---|---|---|---|
| High (++, +++) | Low (‐,+) | ||||
| Paired normal tissues | 85 | 80 | 5 | 98.018 | .000 |
| CRC | 85 | 16 | 69 | ||
| Gender | |||||
| Male | 50 | 11 | 39 | 0.802 | .413 |
| Female | 35 | 5 | 30 | ||
| Age(years) | |||||
| ≤55 | 38 | 10 | 28 | 2.525 | .163 |
| >55 | 47 | 6 | 41 | ||
| TNM stage | |||||
| I | 24 | 5 | 19 | 3.697 | .296 |
| II | 24 | 5 | 19 | ||
| III | 12 | 4 | 8 | ||
| IV | 25 | 2 | 23 | ||
| T classification | |||||
| T1‐2 | 29 | 7 | 22 | 0.814 | .392 |
| T3‐4 | 56 | 9 | 47 | ||
| N classification | |||||
| N0 | 19 | 10 | 9 | 18.304 | .000 |
| N1‐3 | 66 | 6 | 60 | ||
| Differentiation degree | |||||
| Well | 17 | 5 | 12 | 2.588 | .274 |
| Moderately | 51 | 6 | 45 | ||
| Poorly | 17 | 5 | 12 | ||
| Recurrent status | |||||
| Yes | 69 | 11 | 58 | 1.992 | .170 |
| No | 16 | 5 | 11 | ||
| Distant metastasis | |||||
| Yes | 60 | 7 | 53 | 6.838 | .014 |
| No | 25 | 9 | 16 | ||
| Location | |||||
| Rectum | 50 | 10 | 40 | 0.110 | .786 |
| Colon | 35 | 6 | 29 | ||
| Tumour size (cm) | |||||
| ≤4.0 | 36 | 11 | 25 | 5.625 | .025 |
| >4.0 | 49 | 5 | 44 | ||
| Gross classification | |||||
| Mucinous type | 51 | 6 | 45 | 4.169 | .244 |
| Signet‐ring type | 7 | 2 | 5 | ||
| Glandular type | 20 | 6 | 14 | ||
| Undifferentiated type | 7 | 2 | 5 | ||
3.2. SATB2 suppresses the epithelial‐mesenchymal transition in CRC cell lines
Have confirmed that SATB2 was remarkably down‐regulated in CRC tissues relative to paired normal control in vivo; subsequently, we extended the detection of SATB2 from in vivo tissues to in vitro CRC cell lines. Among the panel of CRC cell lines available to us, SATB2 was consistently detected to be pronouncedly decreased in comparison with HCoEpiC, a kind of normal human colorectal epithelial strain (Figure 2A). With the exception of HCoEpiC, in the remainder 5 different kinds of CRC cell lines, including HT‐29, Colo‐320, SW480, SW620 and HCT‐15, both HT‐29 and HCT‐15 whose basal level of SATB2 were relatively lower than that of the other 3 kinds of CRC cell lines. We, therefore, picked up HT‐29 and HCT‐15 cell lines as cell models to be further employed. To understand the biological role of SATB2 in CRC cell lines, both re‐expression and knock‐down strategies were adopted. We, therefore, synthesized the specific siRNA targeted 2 different locus of SATB2 mRNA and constructed the eukaryotic vector harbouring full‐length cDNA of SATB2 fused with green fluorescent protein. Knock‐down and overexpression efficiency, as exemplified by immunoblotting analysis, exhibited that these tools can do their job effectively (Figure 2B,C). Suggested by an earlier report15 that down‐regulation of SATB2 could induce the occurrence of epithelial‐mesenchymal transition (EMT) in lung cancer cells, we tried to detect the expression variation of typical biomarkers related to EMT, including the epithelial marker E‐cadherin, and mesenchymal marker N‐cadherin and vimentin, on the basis of successful silencing or overexpression of SATB2 in CRC cell lines HT‐29 and HCT‐15. It showed that the expression of E‐cadherin was decreased, whereas both vimentin and N‐cadherin were elevated after SATB2 being silenced (Figure 2B). By contrast, it was the other way around for the trend variation of E‐cadherin, vimentin and N‐cadherin after SATB2 was re‐expressed. Exactly, the level of E‐cadherin was presented to be up‐regulated, whereas the vimentin and N‐cadherin down‐regulated after re‐expression of SATB2 (Figure 2C). Our results obtained above confirmed the earlier observation reported in lung cancer cells that silencing of SATB2 can induce the occurrence of EMT in CRC cells. Incidentally, we also evaluated the role the SATB2 mediated in the migration and proliferation of CRC cells in vitro using wound‐healing assay and MTT assay, respectively. The data from wound‐healing assay presented that silencing of SATB2 was exhibited to be able to promote the migration of CRC cells (Figure S2A). The data of proliferative assay revealed that knock‐down of SATB2 can markedly promote the growth. On the contrary, overexpression of SATB2 can pronouncedly prevent the growth (Figure S2B,C), indicating that SATB2 was anti‐oncogenic in CRC cells.
Figure 2.
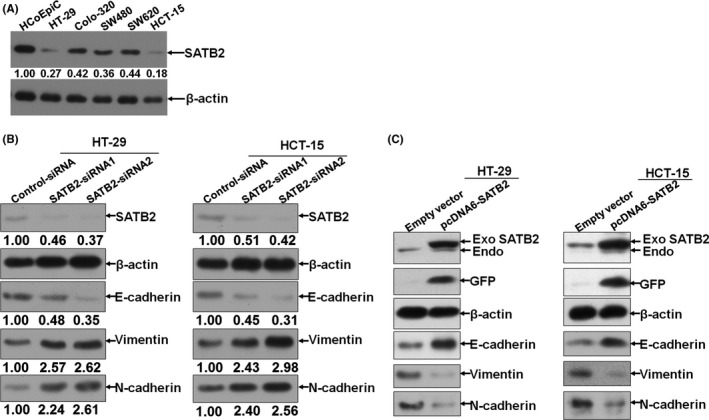
SATB2 suppresses the epithelial‐mesenchymal transition (EMT) in colorectal cancer (CRC) cell lines. A, Endogenous basal level of SATB2 in a panel of CRC cell lines available to us; the observed band size of SATB2 and β‐actin band was 83 and 42 kilodalton (kDa), respectively; B, transient knock‐down of SATB2 using siRNA technique in HT‐29 and HCT‐15 cells. Scramble‐siRNA was used as negative control of siRNA sequences transfected. The observed band size of E‐cadherin, N‐cadherin and vimentin band was 110, 125 and 54 kDa, respectively; C, Likewise, exogenous SATB2 fused with green fluorescent protein (GFP) was re‐expressed in CRC cell lines HT‐29 and HCT‐15. The observed band size of SATB2 fused with GFP was approximately 110 kDa, with GFP tag being observed at 27 kDa. Shown were the representative figures picked among the candidates from at least independently 3 different times of repeat
3.3. SATB2 prevents metastasis of CRC cells in vivo
Subsequently, we extended the exploration of SATB2 mediated in the migration from in vitro to in vivo. Among the 2 siRNA sequences against SATB2 we synthesized, the siRNA labelled as SATB2‐siRNA2 whose silencing effect was apparently better than that of siRNA termed as SATB2‐siRNA1. We, therefore, constructed the lentivirus (Lv)‐based shRNA vectors against SATB2 based on the sequence of SATB2‐siRNA2. Ensuingly, we generated 2 kinds of transgenic CRC cell lines HT‐29 and HCT‐15 whose basal SATB2 was stably significantly silenced (Figure S3A,B). Then, we had nude mice injected with transgenic HT‐29 and HCT‐15 cell lines via lateral tail vein. The incidence of lung metastasis was examined with bioluminescent image at the time point designed. The bioluminescent examination showed that silencing of SATB2 can significantly enhance the metastatic abilities of CRC cell lines HT‐29 and HCT‐15 in vivo (Figure 3). The results we gleaned demonstrated that SATB2 was able to prevent the metastasis of CRC cells in vivo.
Figure 3.
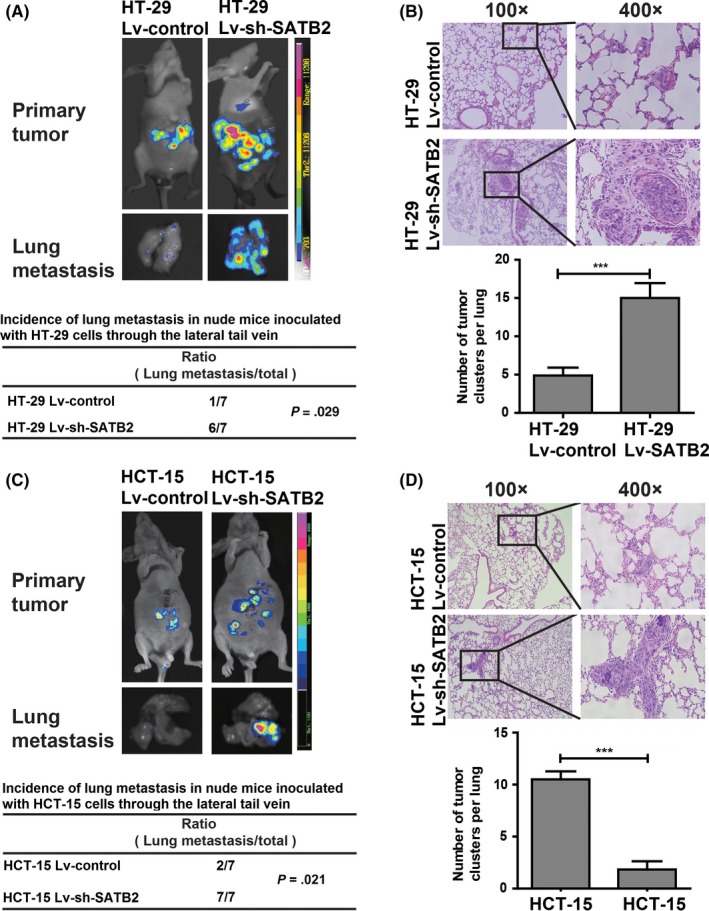
SATB2 prevents metastasis of colorectal cancer (CRC) cells in vivo. A, Bioluminescent images of in vivo incidence of lung metastasis and primary tumour in nude mice subjected to tail vein inoculation with HT‐29 cells whose endogenous SATB2 was stably knocked down (labelled as HT‐29 Lv‐sh‐SATB2) or not (HT‐29 Lv‐control). Fourteen nude mice were grouped into 2, with each having 7 mice. The incidence rate of lung metastasis in group where mice inoculated with HT‐29 Lv‐sh‐SATB2 cells was 6 of 7. In contrast, the incidence of lung metastasis in group where mice inoculated with HT‐29 Lv‐control cells were 1 of 7; there was significant difference with P value being .029 using Cross‐table analysis. B, Haematoxylin‐eosin (HE) section analysis of lung metastasis nodes and its quantitative counts of visible nodes per lung; ***P < .001 compared with Lv‐control group using the independent sample t‐test analysis. C, Similarly and parallel to HT‐29 cells, the evaluation of incidence of lung metastasis was verified in another kind of CRC cell line HCT‐15 whose endogenous SATB2 was stably knocked down (HCT‐15 Lv‐sh‐SATB2) or not (HCT‐15 Lv‐control). As presented, there was also significant difference in the case of incidence of lung metastasis, with P value being .021 using cross‐table analysis. D, HE section analysis of lung metastasis nodes and its quantitative counts of visible nodes per lung, ***P < .001 relative to Lv‐control group using the independent sample t‐test analysis. In terms of bioluminescent image presented, shown were the representative figures selected among the 7 candidates
3.4. MiR‐34c‐5p was identified to be able to directly and negatively regulate SATB2
Having understood that SATB2 can prevent metastasis of CRC cells in vivo, next, we asked the question why SATB2 was down‐regulated in CRC. To solve it, we were in an attempt to analyse the question from the angle of miRNA‐mRNA regulation.16 Through bioinformatic prediction, we found that in actuality, there was more than one potential binding site of miR‐34c‐5p in the 3′‐untranslated region (UTR) of SATB2. Among which, shown was the one representative binding site of miR‐34c‐5p, which was highly conserved in mammals, at 705 of 3′‐UTR of SATB2 (Figure 4A). To verify the prediction, luciferase reporter assay was, therefore, performed. We generated the luciferase reporters of 3′‐UTR containing the binding site of miR‐34c‐5p and its corresponding mutational control (Figure 4SA‐C), then co‐transfected with miR‐34c‐5p mimics and its scramble sequence control into CRC cell lines HT‐29 and HCT‐15. It exhibited that miR‐34c‐5p was able to significantly bind to the 3′‐UTR of SATB2 (Figure 4B), suggesting that SATB2 can be one of the downstream targets of SATB2. Next, to make clear the modulation exerted over SATB2 by miR‐34c‐5p, we transfected with miR‐34c‐5p mimics and inhibitor sequences into CRC cell lines HT‐29 and SW480 based on the endogenous level of miR‐34c‐5p (Figure S5A), followed by analysis of expression variation of SATB2 via immunoblotting. As shown in Figure 4C, SATB2 was decreased after miR‐34c‐5p was up‐regulated, while SATB2 increased with miR‐34c‐5p being inhibited (Figure 4C), strongly suggesting that miR‐34c‐5p regulated SATB2 in a negative control fashion. Meanwhile, given that SATB1 was the paralogue of SATB2, to observe whether miR‐34c‐5p could influence the expression of SATB1 in CRC cell lines, we detected the expression variation of SATB1. Expectedly, no significant variation was found for SATB1 (Figure S4D), indicating that the modulation of SATB2 by miR‐34c‐5p was specific. In subsequent, to explore the role of miR‐34c‐5p in the metastasis of CRC cells in vivo, we also established the transgenic CRC cell lines HT‐29 and HCT‐15 whose basal miR‐34c‐5p were stably significantly up‐regulated (Figure S5B), using lentiviral vector technique. Then, we quantitatively evaluated the lung metastasis after inoculation of transgenic CRC cell lines HT‐29 and HCT‐15; we generated into nude mice through its lateral tail vein. It was found that the metastatic ability of CRC cells was significantly inhibited in vivo after miR‐34c‐5p being up‐regulated (Figure 4D). Actually, not only the lung organ but also the liver of nude mice that metastasis node was pronouncedly suppressed after miR‐34c‐5p being stably re‐expressed (Figure S5C). These results demonstrated that SATB2 was directly and negatively modulated by miR‐34c‐5p that can prevent the metastatic ability of CRC cells in vivo.
Figure 4.
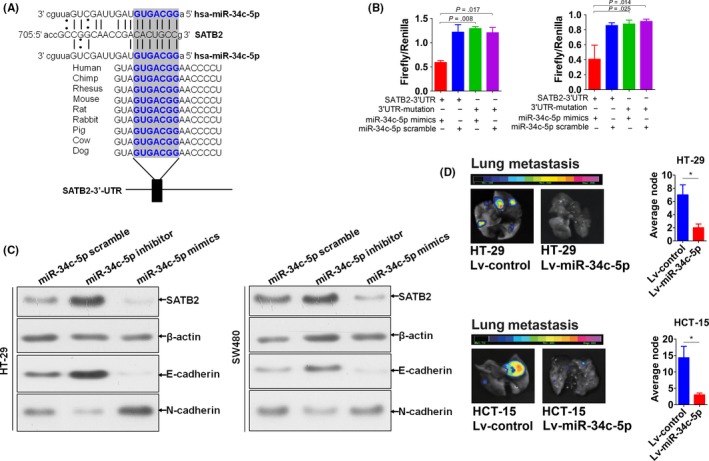
MiR‐34c‐5p was identified to be able to directly and negatively modulate SATB2. A, Bioinformatic prediction of the potential binding sites of SATB2 in the mature sequence of miR‐34c‐5p, which was highly conserved in mammalians. The bold blue words were the highly conserved binding site of miR‐34c‐5p binding to SATB2. B, Verification of the potential binding of miR‐34c‐5p with SATB2 using Luciferase reporter assay. Independent sample t test was used to analyse the statistical difference relative to control groups. Experiment was performed in triplicate and shown was the representative. C, Expression variation of SATB2 as well as the typical EMT relevant biomarkers, including E‐cadherin and N‐cadherin, after transfection with miR‐34c‐5p mimics and inhibitor sequence into HT‐29 and SW480 cells, as exemplified by immunoblot. The experiment was performed independently in triplicate and shown were the representative figures selected among the candidates. D, In vivo evaluation of metastatic variation of CRC cells whose endogenous miR‐34c‐5p was stably re‐expressed using lentivirus (Lv) vector fused with bioluminescent tag. For HT‐29 cells, 14 nude mice were grouped into 2, with each 7. In control group, mice were subjected to the tail vein inoculation of HT‐29 cells transfected with Lv‐miR‐34c‐5p‐scramble (hereafter referred to as Lv‐control), whereas in experimental group, mice subjected to the tail vein inoculation of HT‐29 cells transfected with Lv‐miR‐34c‐5p. The same holds true for HCT‐15 cells. Presented were the representative bioluminescent images picked up among the candidates from at least 3 different times of repeat. *P<0.05 compared with control group using independent sample t test
3.5. Repressed miR‐34c‐5p in CRC resulted from methylation in its promoter sequence
To further verify the negative regulation between miR‐34c‐5p and SATB2, for one thing we analysed the basal level of miR‐34c‐5p in the panel of CRC cell lines. It turned out that miR‐34c‐5p was significantly lower than that of HCoEpiC cell lines (Figure 5A), indicating that miR‐34c‐5p was repressed in CRC cell lines. To further verify, we extended from in vitro CRC cell lines to in vivo clinical tissues. We detected using qRT‐PCR the level of miR‐34c‐5p in the same cohort of CRC tissues as SATB2 was assayed with qRT‐PCR, which is to say, using the same DNA extracted from the 85 paired cases of CRC and its normal control tissue block sections. Consistent with that on CRC cell line level, miR‐34c‐5p was lower in CRC tissues relative to paired normal controls (Figure 5B). Subsequently, we tried to further analyse the possible correlation between mRNA level of miR‐34c‐5p and SATB2 that has been determined at the outset (Figure 1B). The Spearman correlation analysis displayed that miR‐34c‐5p significantly correlated with SATB2 on mRNA level, but in a positive fashion (Figure 5C). Thus, the data from our in vivo CRC tissue level and in vitro CRC cell lines, therefore, corroborated each other, confirming the regulation of SATB2 by miR‐34c‐5p. To figure out why miR‐34c‐5p was significantly and unexpectedly reduced in CRC tissues compared with paired normal control tissues, we made further investigation in the relevant literatures regarding miR‐34c‐5p. Suggested by the previous studies11, 12 that the promoter sequence of miR‐34 family was discovered to be hypermethylated which could account for its frequent down‐regulation in cancers,17 we reasonably extrapolated that methylation could also unexceptionally occur to miR‐34c‐5p in CRC cells. Thus, to test our extrapolation, first, we analysed the methylation status of the 5′ up‐stream flanking sequence of miR‐34c‐5p in CRC tissues and its paired normal controls. It revealed that the 5′ up‐stream flanking sequence as long as 500 bp, within which there must be the promoter sequence of SATB2 (Figure S6), was hypermethylated compared with the normal control (Figure 5D). Incidentally, we analysed the correlation between the methylated miR‐34c‐5p and miR‐34c‐5p relative expression. It showed that there was significantly inversed correlation between them (Figure 5E). Next, we detected the variation of miR‐34c‐5p expression in HT‐29 and HCT‐15 cells before and after treatment with 5‐Aza‐2‐deoxycytidine (5‐Aza‐dC), a commonly used inhibitor for DNA methyltransferase, for 48 hours. It was found that miR‐34c‐5p was markedly rebounded after treatment with 5‐Aza‐dC for 48 hours, compared with control group, strongly suggesting that miR‐34c‐5p was methylated in CRC cells (Figure 5F). Ensuingly, we detected the variation of SATB2 as well as EMT makers, E‐cadherin and N‐cadherin, on protein level using western blot in the presence and absence of 5‐Aza‐dC treatment. As expected, SATB2 was remarkably suppressed in the presence of 5‐Aza‐dC relative to control group (Figure 5G) in CRC cell lines HT‐29 and SW480, which was strongly suggestive of the methylation of miR‐34c‐5p results in its down‐regulation in CRC, which was commonly seen. Moreover, we also analysed the clinicopathological significance of miR‐34c‐5p expression on mRNA level. It was shown that reduced miR‐34c‐5p markedly correlated with N classification and distant metastasis of CRC (Table 2), other than the significant difference between CRC tissues and paired normal controls (Table 1). No significant linkage was observed with other clinicopathological variables, including gender, differentiation, T classification and TNM stage. Collectively, these results we gleaned indicated that reduced miR‐34c‐5p in CRC resulted from methylation in its promoter sequence.
Figure 5.
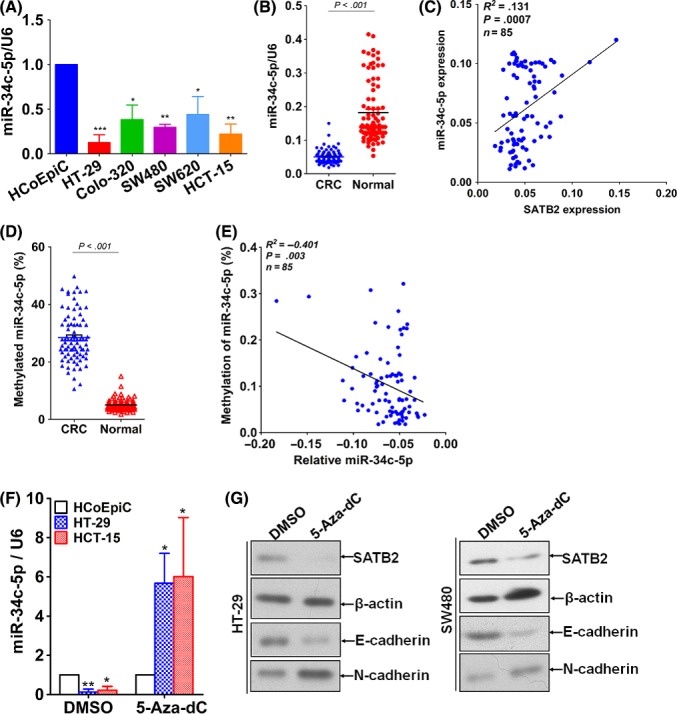
Repressed miR‐34c‐5p in CRC resulted from methylation in its promoter sequence. A, Basal level of miR‐34c‐5p in the same panel of CRC cell lines as SATB2 was detected using immunoblotting. B, Detection of miR‐34c‐5p level in the 85 paired cases of CRC and its normal control using qRT‐PCR. U6, the internal loading control. Independent sample t test was used to analyse the statistical difference between CRC and its paired normal control. C, Spearman correlation was carried out to analyse the correlation between miR‐34c‐5p and SATB2 expression on mRNA level. As displayed, the R 2 coefficient was .131, the sample size was 85 cases and P value was .0007. D, Detection of methylated miR‐34c‐5p level in CRC and paired normal control using methylated qRT‐PCR. E, Similarly, Spearman correlation was carried out to analyse the correlation between methylated miR‐34c‐5p and miR‐34c‐5p expression on mRNA level, as shown, the R 2 coefficient was −.401, the sample size was 85 cases, and P value was .003. F, the miR‐34c‐5p level was assayed before and after treatment with 5‐aza‐2′‐deoxycytidine (abbreviated as 5‐Aza‐dC), an inhibitor for DNA methyltransferase, for 48 h in CRC cell lines HT‐29 and HCT‐15. *P < .05, **P < .01, ***P < .001 in comparison with their control group, that is, HCoEpiC using independent sample t test. G: expression variation of SATB2 as well as E‐cadherin and N‐cadherin in the presence and absence of 5‐Aza‐dC treatment for 48 h, as exemplified by western blot
Table 2.
Correlation between miR‐34c‐5p expression and clinicopathological characteristics of CRC
| Parameters | Total (85 cases) | MiR‐34c‐5p expression | P |
|---|---|---|---|
| Gender | |||
| Male | 50 | 0.73 ± 0.46 | .328 |
| Female | 35 | 0.89 ± 0.48 | |
| Differentiation | |||
| Well | 17 | 0.89 ± 0.48 | .127 |
| Moderate | 51 | 0.71 ± 0.46 | |
| Poor | 17 | 0.46 ± 0.13 | |
| N classification | |||
| N0 | 19 | 0.81 ± 0.13 | .002 |
| N1‐3 | 66 | 0.46 ± 0.47 | |
| T classification | |||
| T1‐2 | 29 | 0.80 ± 0.47 | .459 |
| T3‐4 | 56 | 0.69 ± 0.45 | |
| Distant metastasis | |||
| Yes | 60 | 0.42 ± 0.43 | .026 |
| No | 25 | 0.77 ± 0.49 | |
| TNM stage | |||
| I | 24 | 0.93 ± 1.03 | .739 |
| II | 24 | 0.78 ± 0.43 | |
| III | 12 | 0.78 ± 0.60 | |
| IV | 25 | 0.59 ± 0.24 | |
4. DISCUSSION
In the present investigation, we confirmed the previous finding in our own cases that SATB2 was remarkably down‐regulated in CRC tissues relative to paired normal controls; and that reduced SATB2 was markedly associated with poor overall prognosis in CRC. We found that SATB2 was able to suppress the metastasis of CRC cells in vivo, preventing the EMT occurrence in vitro. Furthermore, we identified that miR‐34c‐5p was able to directly and negatively modulate the SATB2 in CRC, which could account for the phenotype observed that SATB2 was commonly seen to be significantly decreased in CRC. Besides, we also found that it was the methylation of promoter of miR‐34c‐5p that results in the reduced miR‐34c‐5p in CRC where miR‐34c‐5p was shown to be anti‐oncogenic role.
SATB, abbreviated from special AT‐rich sequence‐binding proteins, are nuclear matrix‐associated proteins that are important for growth and development. Of which, SATB1 and SATB2 are the only 2 recognized members. Despite from the same SATB class, SATB1 and SATB2 have been found to play a different even opposing roles in the progression of CRC,15, 18, 19 suggesting that their roles distinctively differ from each other in CRC. In actuality, both SATB1 and SATB2 have been found to be involved in the pathogenesis of CRC, with SATB2 being reported to be lower in CRC tissues compared with normal controls.20 Nonetheless, considering that SATB2 expression is selectively expressed in the lower gastrointestinal tract mucosa, SATB2 was more commonly used alone21, 22 or together with other markers23, 24 than SATB1 for differential pathology diagnosis of CRC from other tumours with morphological similarity, we have, therefore, picked up SATB2, as opposed to SATB1, in our present study, in an attempt to confirm the previous finding in our own cases that SATB2 has been reported to be significantly down‐regulated in CRC. As expected, the observational association we made between the clinicopathological significance and status of SATB2 in CRC was totally in agreement with previous reports3, 25 that down‐regulated expression of SATB2 was closely linked with metastasis, whatever distant or lymph node, and poor overall survival in CRC. Besides, SATB2 has been suggested to modulate the sensitivity to chemotherapy and radiation in CRC in one previous study by Eberhard et al25. In our study, on account of the relevant information were unavailable regarding the chemo‐ or radio‐therapy for the patients with CRC, our analysis could not lead to any suggestion regarding the linkage between SATB2 expression pattern and chemotherapeutic sensitivity. It should be noted that the relevant reports concerning the prognostic significance of SATB2 in the setting of CRC were highly concordant that SATB2 expression was markedly associated with shorter overall survival. Nonetheless, it was not necessarily the case in other kind of cancers. As an exceptional example of pancreatic adenocarcinoma, SATB2 was reported to be unassociated with the overall prognosis of patients with pancreatic adenocarcinoma.26 The discrepancy may be mainly owing to the fact that the varying cutoff values were adopted between our study and Elebro et al's when immunoscoring the positive expression of STAB2 on sections and when stratifying the subcohorts based on the intensity of immunostaining in the analysis of overall survival.
While several lines of evidence have revealed that SATB2 was reduced even lost in CRC tissues using different detection techniques, how this is achieved still remains poorly understood in spite of several mechanistic studies emerged from the angle of miRNA‐mRNA regulation5, 6 in CRC. In 2 previous serial studies by Yang and colleagues, the authors presented that both miR‐182 and miR‐31 were shown to be able to negatively modulate the SATB2 expression, providing possible explanations for why SATB2 was commonly seen to be reduced in CRC tissues compared with normal control.5, 6 Inspired by these 2 reports, we attempted to find out another new miRNA that can regulate the STAB2 in CRC. Following this line of thought, we identified miR‐34c‐5p as another new miRNA that was found to be capable of negatively modulating SATB2 that has been unreported yet. As exemplified by luciferase reporter assay, miR‐34c‐5p was shown to directly bind to the 3′‐UTR of SATB2, thereby regulating SATB2 in a canonical negative fashion as miR‐182 and miR‐31 did in CRC. In addition, considering that SATB1 and SATB2 were from the same family sharing some similarities in alignment of amino acid, to rule out the possibility that miR‐34c‐5p regulated SATB2 meanwhile potentially influencing the SATB1 as well, we, therefore, evaluated the variation of SATB1 after miR‐34c‐5p being up‐ or down‐regulated in CRC cells. As a result, no significant variation of SATB1 was seen, thus basically excluding the likelihood that miR‐34c‐5p would unspecifically works on SATB1 as we concerned initially. Our evidence from in vivo and in vitro corroborated that suppression of SATB2 can enhance the metastatic abilities of CRC cells, strongly suggesting that SATB2 could inhibit the metastasis of CRC cells, which was totally supported by earlier relevant findings by others made in CRC4, 18, 27, 28 and in other cancers, as reviewed in reference 19.20 Besides, we also showed that SATB2 prevented metastasis alleviating the EMT process, as previously observed.5, 6 On the other hand, we exhibited that the metastatic abilities were remarkably suppressed after miR‐34c‐5p being re‐expressed in CRC cells, which was further corroborated by the clinicopathological significance of miR‐34c‐5p expression on mRNA level in clinical tissues. However, as to how does SATB2 work in CRC still remains largely unknown that requires to be further investigated in spite of one recent study by Mansour et al,4 reporting that SATB2 suppresses the progression of CRC cells via inactivation of MEK5/ERK5 signalling pathway.
In consideration that miR‐34c‐5p was identified as a new miRNA that can negatively modulate the SATB2 in CRC cells, we initially assumed that miR‐34c‐5p could be significantly elevated in CRC cells compared with normal control according to the general regulation mode of miRNA on its targeted mRNA. However, miR‐34c‐5p turned out to be remarkably decreased in CRC cell lines in comparison with normal colorectal epithelial cell line HCoEpiC. To verify the trend, detection of miR‐34c‐5p using qRT‐PCR was extended from in vitro CRC cell lines to in vivo tissue samples. It turned out that miR‐34c‐5p was shown to be pronouncedly reduced in CRC tissues relative to paired normal control, which corroborated with its level in CRC cell lines in vitro which seems to be conflicting with our initial assumption. Nonetheless, our observation concerning the expression pattern of miR‐34c‐5p in CRC was wholly congruent with and supported by the earlier reports12, 29, 30 despite performed in other cancers. Although the underlying reason resulting in why miR‐34c‐5p was markedly reduced in CRC remains to be determined, multiple studies12, 31, 32 suggested that hypermethylation of the promoter sequence of miR‐34c‐5p could explain. Indicated by these previous literatures, we tried to analyse the methylated status of 5′ up‐stream flanking sequence as long as 500pb, within which there must be the promoter of miR‐34c‐5p and expression variation of its downstream target SATB2 before and after treatment with 5‐Aza‐dC, an effective and commonly used inhibitor for DNA methyltransferase, as stated previously already. Treatment with 5‐Aza‐dC was shown to be able to restore the level of miR‐34c‐5p in CRC cells, thereby down‐regulating the SATB2 as we observed in our experiment. Despite this, the question that why was the promoter of miR‐34c‐5p subject to hypermethylation remains which deserves to be further investigated in the following.
Here, we presented the direct evidence demonstrating that SATB2 targeted by miR‐34c‐5p suppressed the metastasis alleviating the EMT process in CRC cells, providing another feasible explanation for why SATB2 was observed to be reduced in CRC tissues. Some questions still remain that need to be further studied. First, is the down‐regulated SATB2 cause or effect of CRC development remains unclear; second, what happened behind the phenomenon that SATB2 suppresses metastasis of CRC? which obviously requires further to be explored in the following.
In conclusion, in our current setting, we identified another new miRNA, that is to say, miR‐34c‐5p that can directly regulate the SATB2, which was shown to be able to significantly inhibit the metastasis of CRC cells both in vivo and in vitro, enriching the miRNA profiles that modulate the SATB2 in CRC.
ACKNOWLEDGEMENT
The study was supported by the project from the Health and Family Planning Commission of Hebei province (no. 20160203).
AUTHORS' CONTRIBUTION
JG performed all the experiments involved; HL helped collected both the clinical tissues and data; CX revised the manuscript and provided critical perspective in the discussion; GW conceived the study and drafted the manuscript.
Supporting information
Gu J, Wang G, Liu H, Xiong C. SATB2 targeted by methylated miR‐34c‐5p suppresses proliferation and metastasis attenuating the epithelial‐mesenchymal transition in colorectal cancer. Cell Prolif. 2018;51:e12455 10.1111/cpr.12455
REFERENCES
- 1. Du LB, Li HZ, Wang YQ, et al. Report of colorectal cancer incidence and mortality in China, 2013. Zhonghua Zhong Liu Za Zhi. 2017;39:701‐706. [DOI] [PubMed] [Google Scholar]
- 2. Siegel RL, Miller KD, Jemal A. Cancer statistics, 2016. CA Cancer J Clin. 2016;66:7‐30. [DOI] [PubMed] [Google Scholar]
- 3. Wang S, Zhou J, Wang XY, et al. Down‐regulated expression of SATB2 is associated with metastasis and poor prognosis in colorectal cancer. J Pathol. 2009;219:114‐122. [DOI] [PubMed] [Google Scholar]
- 4. Mansour MA, Hyodo T, Ito S, et al. SATB2 suppresses the progression of colorectal cancer cells via inactivation of MEK5/ERK5 signaling. FEBS J. 2015;282:1394‐1405. [DOI] [PubMed] [Google Scholar]
- 5. Yang MH, Yu J, Jiang DM, et al. microRNA‐182 targets special AT‐rich sequence‐binding protein 2 to promote colorectal cancer proliferation and metastasis. J Transl Med. 2014;12:109. [DOI] [PMC free article] [PubMed] [Google Scholar]
- 6. Yang MH, Yu J, Chen N, et al. Elevated microRNA‐31 expression regulates colorectal cancer progression by repressing its target gene SATB2. PLoS ONE. 2013;8:e85353. [DOI] [PMC free article] [PubMed] [Google Scholar]
- 7. Lopez JA, Alvarez‐Salas LM. Differential effects of miR‐34c‐3p and miR‐34c‐5p on SiHa cells proliferation apoptosis, migration and invasion. Biochem Biophys Res Commun. 2011;409:513‐519. [DOI] [PubMed] [Google Scholar]
- 8. Wu Z, Wu Y, Tian Y, et al. Differential effects of miR‐34c‐3p and miR‐34c‐5p on the proliferation, apoptosis and invasion of glioma cells. Oncol Lett. 2013;6:1447‐1452. [DOI] [PMC free article] [PubMed] [Google Scholar]
- 9. Kara M, Yumrutas O, Ozcan O, et al. Differential expressions of cancer‐associated genes and their regulatory miRNAs in colorectal carcinoma. Gene. 2015;567:81‐86. [DOI] [PubMed] [Google Scholar]
- 10. Engkvist ME, Stratford EW, Lorenz S, et al. Analysis of the miR‐34 family functions in breast cancer reveals annotation error of miR‐34b. Sci Rep. 2017;7:9655. [DOI] [PMC free article] [PubMed] [Google Scholar]
- 11. Wong KY, Yu L, Chim CS. DNA methylation of tumor suppressor miRNA genes: a lesson from the miR‐34 family. Epigenomics. 2011;3:83‐92. [DOI] [PubMed] [Google Scholar]
- 12. Roy S, Levi E, Majumdar AP, et al. Expression of miR‐34 is lost in colon cancer which can be re‐expressed by a novel agent CDF. J Hematol Oncol. 2012;5:58. [DOI] [PMC free article] [PubMed] [Google Scholar]
- 13. Baker M. Reproducibility crisis: blame it on the antibodies. Nature. 2015;521:274‐276. [DOI] [PubMed] [Google Scholar]
- 14. Holmseth S, Zhou Y, Follin‐Arbelet VV, et al. Specificity controls for immunocytochemistry: the antigen preadsorption test can lead to inaccurate assessment of antibody specificity. J Histochem Cytochem. 2012;60:174‐187. [DOI] [PMC free article] [PubMed] [Google Scholar]
- 15. Kucuksayan H, Ozes ON, Akca H. Downregulation of SATB2 is critical for induction of epithelial‐to‐mesenchymal transition and invasion of NSCLC cells. Lung Cancer. 2016;98:122‐129. [DOI] [PubMed] [Google Scholar]
- 16. Wang C, Hu DZ, Liu JZ. Identification of critical TF‐miRNA‐mRNA regulation loops for colorectal cancer metastasis. Genet Mol Res. 2015;14:5485‐5495. [DOI] [PubMed] [Google Scholar]
- 17. Corney DC, Hwang CI, Matoso A, et al. Frequent downregulation of miR‐34 family in human ovarian cancers. Clin Cancer Res. 2010;16:1119‐1128. [DOI] [PMC free article] [PubMed] [Google Scholar]
- 18. Mansour MA, Hyodo T, Akter KA, et al. SATB1 and SATB2 play opposing roles in c‐Myc expression and progression of colorectal cancer. Oncotarget. 2016;7:4993‐5006. [DOI] [PMC free article] [PubMed] [Google Scholar]
- 19. Zhang Y, Tian X, Ji H, et al. Expression of SATB1 promotes the growth and metastasis of colorectal cancer. PLoS ONE. 2014;9:e100413. [DOI] [PMC free article] [PubMed] [Google Scholar]
- 20. Brocato J, Costa M. SATB1 and 2 in colorectal cancer. Carcinogenesis. 2015;36:186‐191. [DOI] [PMC free article] [PubMed] [Google Scholar]
- 21. Berg KB, Schaeffer DF. SATB2 as an immunohistochemical marker for colorectal adenocarcinoma: a concise review of benefits and pitfalls. Arch Pathol Lab Med. 2017;141:1428‐1433. [DOI] [PubMed] [Google Scholar]
- 22. Kim CJ, Baruch‐Oren T, Lin F, et al. Value of SATB2 immunostaining in the distinction between small intestinal and colorectal adenocarcinomas. J Clin Pathol. 2016;69:1046‐1050. [DOI] [PubMed] [Google Scholar]
- 23. Brandler TC, Jelloul FZ, Soto D, et al. Young investigator challenge: cadherin‐17 and SATB2 in cytology specimens: do these new immunostains help in differentiating metastatic colorectal adenocarcinoma from adenocarcinomas of other origins? Cancer Cytopathol. 2015;123:706‐713. [DOI] [PubMed] [Google Scholar]
- 24. Magnusson K, de Wit M, Brennan DJ, et al. SATB2 in combination with cytokeratin 20 identifies over 95% of all colorectal carcinomas. Am J Surg Pathol. 2011;35:937‐948. [DOI] [PubMed] [Google Scholar]
- 25. Eberhard J, Gaber A, Wangefjord S, et al. A cohort study of the prognostic and treatment predictive value of SATB2 expression in colorectal cancer. Br J Cancer. 2012;106:931‐938. [DOI] [PMC free article] [PubMed] [Google Scholar]
- 26. Elebro J, Heby M, Gaber A, et al. Prognostic and treatment predictive significance of SATB1 and SATB2 expression in pancreatic and periampullary adenocarcinoma. J Transl Med. 2014;12:289. [DOI] [PMC free article] [PubMed] [Google Scholar]
- 27. Li Y, Liu YH, Hu YY, et al. Special AT‐rich sequence‐binding protein 2 acts as a negative regulator of stemness in colorectal cancer cells. World J Gastroenterol. 2016;22:8528‐8539. [DOI] [PMC free article] [PubMed] [Google Scholar]
- 28. Mansour MA, Asano E, Hyodo T, et al. Special AT‐rich sequence‐binding protein 2 suppresses invadopodia formation in HCT116 cells via palladin inhibition. Exp Cell Res. 2015;332:78‐88. [DOI] [PubMed] [Google Scholar]
- 29. Varghese VK, Shukla V, Kabekkodu SP, et al. DNA methylation regulated microRNAs in human cervical cancer. Mol Carcinog. 2017;57:370‐382. [DOI] [PubMed] [Google Scholar]
- 30. Daugaard I, Knudsen A, Kjeldsen TE, et al. The association between miR‐34 dysregulation and distant metastases formation in lung adenocarcinoma. Exp Mol Pathol. 2017;102:484‐491. [DOI] [PubMed] [Google Scholar]
- 31. Wang Z, Chen Z, Gao Y, et al. DNA hypermethylation of microRNA‐34b/c has prognostic value for stage non‐small cell lung cancer. Cancer Biol Ther. 2011;11:490‐496. [DOI] [PubMed] [Google Scholar]
- 32. Yu F, Jiao Y, Zhu Y, et al. MicroRNA 34c gene down‐regulation via DNA methylation promotes self‐renewal and epithelial‐mesenchymal transition in breast tumor‐initiating cells. J Biol Chem. 2012;287:465‐473. [DOI] [PMC free article] [PubMed] [Google Scholar]
Associated Data
This section collects any data citations, data availability statements, or supplementary materials included in this article.
Supplementary Materials