Abstract
Objectives
Gastric cancer mesenchymal stem cells (GC‐MSCs) can promote the development of tumour growth. The tumour‐promoting role of tumour‐associated MSCs and T cells has been demonstrated. T cells as the major immune cells may influence and induce a pro‐tumour phenotype in MSCs. This study focused on whether CD4+ T cells can affect GC‐MSCs to promote gastric cancer growth.
Materials and methods
CD4+ T cells upregulation of programmed death ligand 1 (PD‐L1) expression in GC‐MSCs through the phosphorylated signal transducer and activator of transcription (p‐STAT3) signalling pathway was confirmed by immunofluorescence, western blotting and RT‐PCR. Migration of GC cells was detected by Transwell migration assay, and apoptosis of GC cells was measured by flow cytometry using annexin V/propidium iodide double staining. CD4+ T cell‐primed GC‐MSCs promoted GC growth in a subcutaneously transplanted tumour model in BALB/c nu/nu mice.
Results
Gastric cancer mesenchymal stem cells stimulated by activated CD4+ T cells promoted migration of GC cells and enhanced GC growth potential in BALB/c nu/nu xenografts. PD‐L1 upregulation of GC‐MSCs stimulated by CD4+ T cells was mediated through the p‐STAT3 signalling pathway. CD4+ T cells‐primed GC‐MSCs have greater GC volume and growth rate‐promoting role than GC‐MSCs, with cancer cell‐intrinsic PD‐1/mammalian target of rapamycin (mTOR) signalling activation.
Conclusions
This study showed that GC‐MSCs are plastic. The immunophenotype of GC‐MSCs stimulated by CD4+ T cells has major changes that may influence tumour cell growth. This research was based on the interaction between tumour cells, MSCs and immune cells, providing a new understanding of the development and immunotherapy of GC.
1. INTRODUCTION
Gastric cancer (GC) is a common type of human cancer with high morbidity and mortality,1 although its carcinogenesis is not well known. Mesenchymal stem cells (MSCs) can promote tumour development and are an important component of the tumour microenvironment.2, 3, 4 About gastric cancer, our previous findings suggest that bone marrow‐derived MSCs (BM‐MSCs) play a role in promoting tumour growth in GC, which may be through exosomes or paracrine soluble cytokines.5, 6, 7 MSCs derived from GC tissues (GC‐MSCs) have been isolated, and are more potent at promoting tumour growth than BM‐MSCs.4
However, the crosstalk between MSCs and other cells in the tumour microenvironment cannot be ignored, such as immune cells and blood and lymphatic vessels. The interaction of cancer cells with stromal cells, immune cells or related cytokines promotes tumour growth and metastasis.8 MSCs are multipotent cells with plastic ability, whose phenotype and immunomodulatory potential can be altered by the tumour microenvironment to promote tumour growth. Some results have shown that BM‐MSCs can be transdifferentiated into GC‐MSCs.9 However, the exact mechanism is unclear, which may be related to immune cells. Some studies have indicated that macrophage‐educated MSCs can promote inflammatory breast cancer.10 Collaboration between cancer‐associated fibroblasts and tumour‐associated macrophages is essential for tumour progression, and the cells induce recruitment and activation of each other via cell‐cell interaction.11, 12 T cells are the dominant cell clusters in the tumour environment.13, 14 CD4+ T cells play important roles in response to pathogens or danger‐associated signals and induce anti‐tumour immunity mediated by CD8+ T cells. It is significant that Daniel et al15 have revealed an unexpected capability of CD4+ T cells to promote transition to invasive cancer. Some groups have demonstrated that the loss of CD4+ T cells can lead to strong anti‐tumour effects, which is related to the modulation of immune checkpoints. How CD4+ T cells affect tumour stromal cells is unknown, therefore, we focused on the GC‐promoting role of GC‐MSCs stimulated by CD4+ T cells.
Targeted therapy for immune checkpoint of programmed death 1 (PD‐1) and PD ligand (PD‐L1) was a significant breakthrough for tumour immunotherapy. PD‐L1 is expressed not only on cancer cells, but also on immune infiltrating cells, including T lymphocytes and associated histiocytes/macrophages.16 Accumulating evidence suggests that proinflammatory cytokines such as interferon (IFN)‐γ in the tumour microenvironment can induce upregulation of PD‐L1 on MSCs, and inhibit T‐cell proliferation via a contact‐dependent mechanism.17, 18 It has been shown previously that PD‐1 is expressed in T cells as well as some types of human tumours. Melanoma cell‐intrinsic PD‐1 can augment phosphorylated ribosomal protein S6 (p‐S6) levels and enhance tumour growth in immunocompromised mice.19 Here, we studied PD‐L1 expression and its role in promoting GC growth of GC‐MSCs primed by CD4+ T cells, and the mechanisms involved.
2. MATERIALS AND METHODS
2.1. Cell culture
The Ethical Committee of the Affiliated Hospital of Jiangsu University approved this study and all samples were obtained with informed consent. GC‐MSCs were derived from human GC tissues, which were isolated and cultured as previously described.20 AGS, MGC‐803, SGC‐7901, HGC‐27, BGC‐823 and MKN‐45 GC cells were obtained from the China Academia Sinica Cell Repository, Shanghai, China, and were maintained in medium (Invitrogen, Carlsbad, CA, USA) containing 10% foetal bovine serum (FBS) at 37°C in humid air with 5% CO2.
2.2. Purification of CD4+ T cells
CD4+ T cells were collected from peripheral blood mononuclear cells (PBMCs) of healthy people using the CD4+ T cell Isolation Kit II (Miltenyi, Bergisch Gladbach, Germany). CD4+ T cells were activated by anti‐human CD3 (100 ng/mL) and CD28 (200 ng/mL) antibodies (BD Biosciences, San Jose, CA, USA) for 48 hours, and were used in subsequent experiments.
2.3. Co‐culture experiments
Gastric cancer mesenchymal stem cells were cultured for 24 hours in normal culture medium. The culture medium was collected as GC‐MSCs‐CM; GC‐MSCs (1 × 10⁵ cells/well) and active CD4+ T cells (1 × 10⁶ cells/well) were co‐cultured for 24 hours, the polarized GC‐MSCs were cultured for another 24 hours in normal culture medium. The culture medium was collected as CD4+ T cells‐primed GC‐MSCs‐CM, which was used in vivo and in vitro to observe the effect on GC cells.
Gastric cancer mesenchymal stem cells stimulated by CD4+ T cells for 24 hours and GC‐MSCs alone were collected to detect the expression of PD‐L1 using immunofluorescence, western blotting and reverse transcription polymerase chain reaction (RT‐PCR), and expression of GC‐MSC surface molecules was detected using flow cytometry. GC‐MSCs alone or pre‐treated with 5 μmol/L phosphorylated signal transducer and activator of transcription (p‐STAT3) inhibitor stattic (eBioscience, San Diego, CA, USA) for 24 hours, then stimulated by CD4+ T cells for 0, 6, 12, 24 and 48 hours, and the expression of p‐STAT3(Y705), STAT3 and PD‐L1 was examined by western blotting. Each experiment was repeated three times.
2.4. Immunofluorescence
Gastric cancer mesenchymal stem cells stimulated by CD4+ T cells for 24 hours and GC‐MSCs alone were fixed with 4% paraformaldehyde for 20 minutes at room temperature, and permeabilized with 0.1% Triton‐X 100 for 1 hour. Bovine serum albumin was used to block the aspecific points, then the cells were stained with human anti‐PD‐L1 antibody (1:300, Cell Signalling, Danvers, MA, USA) at 4°C overnight. The cells were washed with phosphate‐buffered saline (PBS) and incubated with Alexa Fluor 594 Goat Anti‐Rabbit IgG (Catalog #:R37117) (Invitrogen). Finally, the cells were stained with Hoechst33342, and photographs were taken using a microscope (Olympus, Tokyo, Japan).
2.5. RT‐PCR
Total RNA was extracted from cells using Trizol reagent (Invitrogen). The first‐strand cDNA was synthesized from RNA using a reverse transcription kit (Vazyme, China). Quantitative RT‐PCR (qRT‐PCR) for measurement of PD‐L1 was performed using the Ultra SYBR Green PCR Kit (CWBIO, China) using CFX96 Touch Real‐Time PCR Detection System (Bio‐Rad, Hercules, CA, USA). The primer sets are listed in Table 1.
Table 1.
Primer sequences of genes
| Gene | Primer sequences(5′‐3′) | Amplification length (bp) | Annealing temperature (°C) |
|---|---|---|---|
| β‐actin |
For: CCTGGCACCCAGCACAAT Rev: GGGCCGGACTCGTCATAC |
256 | 60 |
| PD‐L1 |
For: TGTGCTTGAACCCTTGAATG Rev: GCCAAGAGGGAAAGGAAACT |
120 | 60 |
PD‐L1: programmed death ligand 1
2.6. Flow cytometry
Gastric cancer mesenchymal stem cells or GC‐MSCs stimulated by CD4+ T cells were trypsinized, washed twice in PBS, and labelled for 30 minutes in the dark at 4°C with monoclonal antibodies against CD29, CD45, CD90, CD105 [phycoerythrin (PE)‐conjugated]; CD14, CD34 [fluorescein isothiocyanate (FITC)‐conjugated]; and PD‐L1 (PE‐conjugated) (eBioscience). Labelled cells were analysed using a FACS Caliber flow cytometer (FITC: Ex = 488 nm, Em = 525 nm; PE: Ex = 488 nm, Em = 575 nm) (BD Biosciences) and WinMDI 2.8 software (BD Biosciences, San Jose, CA, USA). PE‐IgG and FITC‐IgG were used as controls.
2.7. Transwell migration assay
Control CM, GC‐MSCs‐CM and CD4+ T cell‐primed GC‐MSCs‐CM were added to 24‐well plates. SGC‐7901 cells (8 × 10⁴/well) were added to the top chambers (8.0‐μm pore size; Costar, Washington, DC, USA), 8 hours after incubation. Cells that had migrated through the chambers were fixed with 4% paraformaldehyde, dyed with crystal violet and photographed using a microscope.
2.8. Apoptosis assay
Apoptosis was evaluated using the FITC‐Annexin V Apoptosis Detection Kit I (eBioscience). SGC‐7901 cells were harvested at 48 hours after co‐culture with control CM, GC‐MSCs‐CM and CD4+ T cell‐primed GC‐MSCs‐CM. The fractions of viable, necrotic and apoptotic cells were detected and quantified by flow cytometry.
2.9. Colony formation assay
SGC‐7901 cells were seeded in six‐well plates at 103/well (Corning, Corning, NY, USA) and incubated in control CM, GC‐MSCs‐CM and CD4+ T cell‐primed GC‐MSCs‐CM for 12 hours. Then, all groups of cells were incubated at 37°C in 5% CO2 for 14 days in RPMI‐1640 medium with 10% FBS. The medium was changed every 3 days. The numbers of colonies were evaluated after crystal violet staining.
2.10. Animal model
Male BALB/c nu/nu mice (Laboratory Animal Center of Shanghai, Academy of Science, China) aged 4‐6 weeks were randomly divided into three groups of six. All groups received subcutaneous injection of 200 μL PBS per mouse containing 2 × 10⁶ SGC‐7901 cells alone (control group); 2 × 10⁶ SGC‐7901 cells pre‐treated with GC‐MSCs‐CM; or 2 × 10⁶ SGC‐7901 cells pre‐treated with CD4+ T cell‐primed GC‐MSCs‐CM. Tumour size was recorded every 2 or 3 days, and tumour growth was evaluated by measuring the length and width of the tumour with calipers. Tumour volume was calculated by the modified ellipsoidal formula: V = (length × width2)/2.
2.11. Western blotting
Cells or xenograft tumour tissues were lysed in RIPA buffer, and protein concentration was determined. A total of 100 μg protein was loaded and run on SDS gels, then transferred onto polyvinylidene difluoride membranes (Life Sciences, Ann Arbor, MI, USA). After blocking with 5% milk in Tris‐buffered saline/Tween 20 for 1 hour, membranes were incubated with antibodies to PD‐1, PD‐L1 (dilution 1:1000; Cell Signalling), antibodies to p‐STAT3, STAT3 (dilution 1:1000; Cell Signalling), p‐S6, and S6 (dilution 1:1000; Cell Signalling) at 4°C overnight, and acquired secondary antibodies (CWBIO) (37°C, 1 hour), and visualized by an enhanced chemiluminescence detection system (Amersham Pharmacia Biotech, Little Chalfont, UK). GAPDH was selected as a control (dilution 1:2000; CWBIO).
2.12. Statistical analysis
Data were expressed as mean ± standard deviation (SD). Statistically significant differences were tested by t test or one‐way analysis of variance. For in vivo tumour growth experiment, the Kruskal‐Wallis H test was used for statistical analysis. P < .05 was considered to be statistically significant.
3. RESULTS
3.1. PD‐L1 expression in GC‐MSCs was upregulated by CD4+ T cells
Proinflammatory cytokines in the tumour microenvironment can upregulate PD‐L1 expression in MSCs. Here, we isolated CD4+ T cells from PBMCs of healthy people (Figure 1A), and analysed the expression of PD‐L1 in GC‐MSCs and CD4+ T cell‐primed GC‐MSCs. Expression of PD‐L1 was upregulated in GC‐MSCs after co‐culture with CD4+ T cells for 24 hours (Figure 1B‐D).
Figure 1.
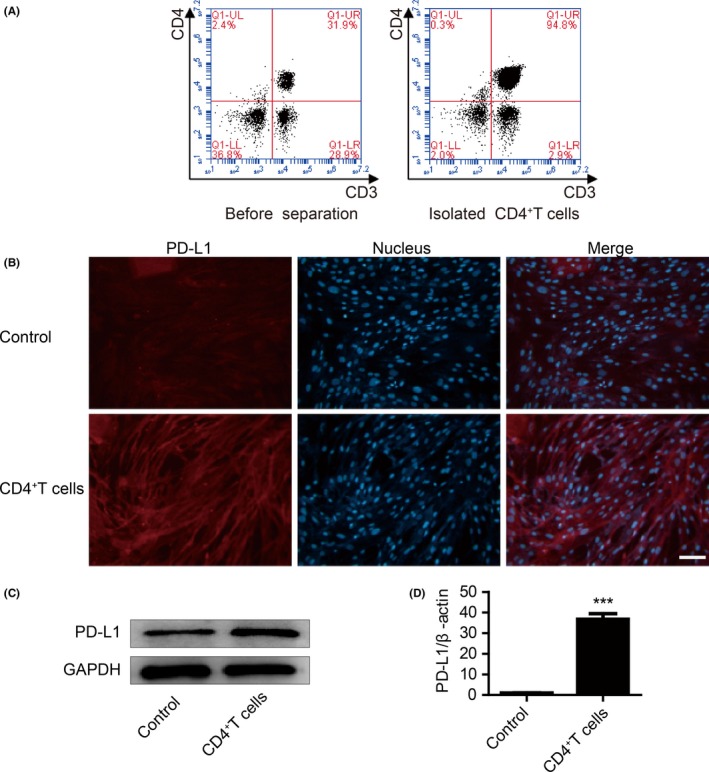
CD4+ T cells upregulated programmed death ligand 1 (PD‐L1) expression in Gastric cancer mesenchymal stem cells (GC‐MSCs). (A) CD4+ T cells were collected from PBMCs of healthy people. (B) GC‐MSCs were incubated with CD4+ T cells for 24 hours. Expression of PD‐L1 in GC‐MSCs was determined by immunofluorescent staining. PD‐L1 (red). Cell nuclei were counterstained with Hoechst33342 (blue) in the same view in each section. Scale bar = 100 μm. (C) After CD4+ T cells were co‐cultured with GC‐MSCs for 24 hours, protein expression of PD‐L1 in GC‐MSCs was determined by western blotting. (D) Gene expression of PD‐L1 in GC‐MSCs was confirmed using qRT‐PCR. The level of PD‐L1 was normalized to β‐actin. ***P < .001
3.2. No difference in surface molecules between GC‐MSCs and CD4+ T cell‐primed GC‐MSCs
We aimed to establish whether the surface characteristics of GC‐MSCs were changed by CD4+ T cells. Surface molecules of GC‐MSCs and CD4+ T cell‐primed GC‐MSCs were detected by flow cytometry. High expression of CD29, CD90 and CD105 and negative expression of CD34, CD14 and CD45 were not changed by stimulation with CD4+ T cells (Figure 2).
Figure 2.
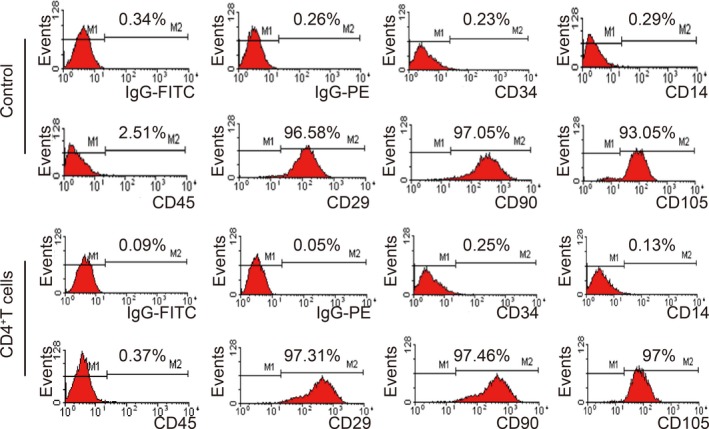
No difference in surface molecules between GC‐MSCs and CD4+ T cell‐primed GC‐MSCs. The surface molecules of GC‐MSCs were detected by flow cytometry. The results were similar in control and CD4+ T cell‐treated groups, with high expression of CD29, CD90 and CD105 and negative expression of CD34, CD14 and CD45
3.3. CD4+ T cells upregulated PD‐L1 expression in GC‐MSCs by activating p‐STAT3
We next examined which pathways were involved in PD‐L1 expression in GC‐MSCs. It is reported that many pathways tightly regulate PD‐L1 expression.21, 22, 23, 24 Proinflammatory cytokines like IFN‐γ induce PD‐L1 expression in tumours via Janus kinase (JAK)/STAT signalling.25, 26 CD4+ T cells are the major IFN‐γ‐producing T cells.27 STAT3 has more potent binding to PD‐L1 promoter in dendritic cells. Thus, we investigated whether p‐STAT3 has similar effect in GC‐MSCs. When CD4+ T cells and GC‐MSCs were co‐cultured for 24 hours, CD4+ T cells activated STAT3 signalling, as well as PD‐L1 expression (Figure 3A). To elucidate the p‐STAT3 signalling pathway that mediates CD4+ T cell‐induced PD‐L1 expression in GC‐MSCs, we pre‐treated GC‐MSCs with p‐STAT3 inhibitor (stattic) and co‐cultured them with CD4+ T cells. Stattic rapidly decreased PD‐L1 protein expression, indicating that PD‐L1 may be regulated by p‐STAT3 in GC‐MSCs (Figure 3B). These data indicate that the p‐STAT3 pathway plays an important role in CD4+ T‐cell promotion of PD‐L1 expression in GC‐MSCs.
Figure 3.
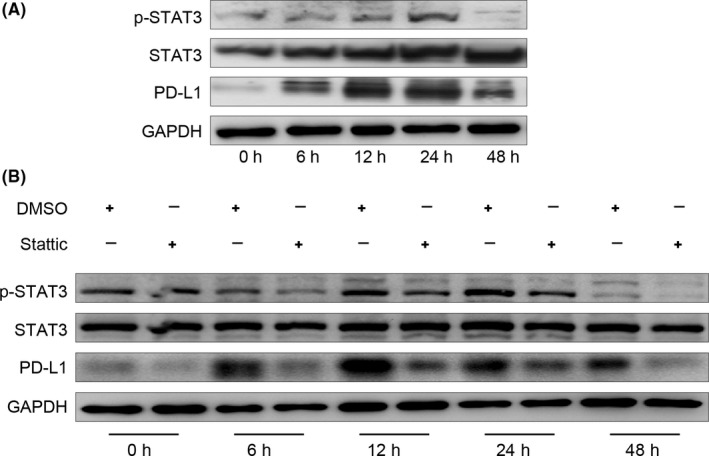
Phosphorylated signal transducer and activator of transcription (p‐STAT3) activation was detected in GC‐MSCs after co‐culture with CD4+ T cells. (A) GC‐MSCs were incubated with CD4+ T cells for 0, 6, 12, 24 and 48 hours. Programmed death ligand 1 (PD‐L1), p‐STAT3 and STAT3 in GC‐MSCs were detected by western blotting. (B) GC‐MSCs were co‐cultured with CD4+ T cells for 0, 6, 12, 24 and 48 hours in the presence or absence of stattic (5 μmol/L) and PD‐L1, p‐STAT3 and STAT3 were determined using western blotting
3.4. Promotion of GC cell migration by CD4+ T cell‐primed GC‐MSCs
In the GC environment, tumour cells are affected by stromal cells and immune cells. We explored the role of GC‐MSCs stimulated by CD4+ T cells in GC development. A Transwell migration assay was performed to evaluate the effect of CD4+ T cell‐primed GC‐MSCs‐CM on the migratory ability of SGC‐7901 cells. CD4+ T cell‐primed GC‐MSCs‐CM significantly promoted SGC‐7901 cells to migrate compared to GC‐MSCs‐CM (Figure 4A). However, there was no difference in GC cell apoptosis between the GC‐MSCs‐CM and CD4+ T cell‐primed GC‐MSCs‐CM groups (Figure 4B). Similarly, both GC‐MSCs‐CM and CD4+ T cell‐primed GC‐MSCs‐CM had no impact on the proliferation of SGC‐7901 cells (Figure 4C).
Figure 4.
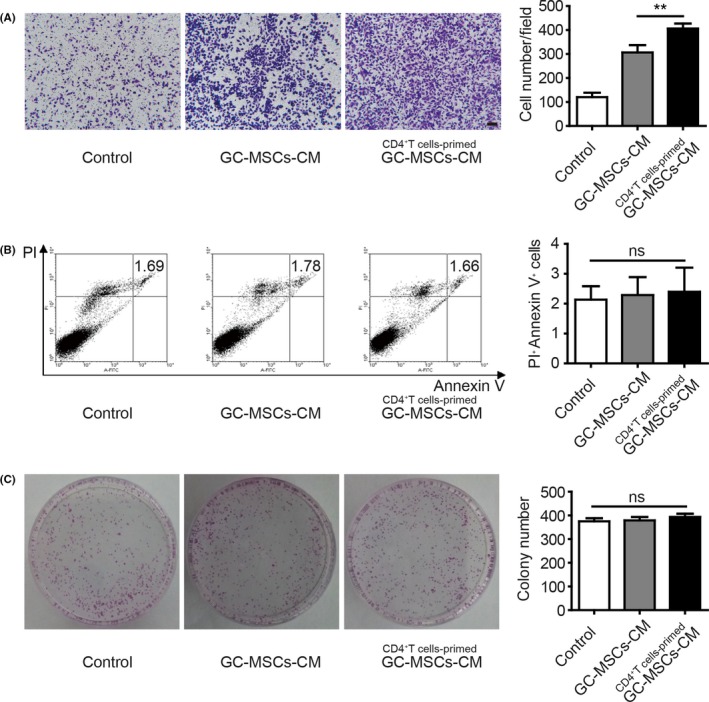
CD4+ T cell‐primed GC‐MSCs have greater GC cell migration‐promoting role than GC‐MSCs in vitro. (A) Ability of GC‐MSCs‐CM and CD4+ T cell‐primed GC‐MSCs‐CM to induce SGC‐7901 cell migration was evaluated by Transwell migration assay (n = 3). Migrated cells on the lower layer were stained and photographed. The number of migrated cells was counted and presented as columns. Scale bar = 100 μm. **P < .01. (B) After co‐culture with control CM, GC‐MSCs‐CM and CD4+ T cell‐primed GC‐MSCs‐CM for 48 hours, SGC‐7901 cells were collected and stained with annexin V/PI (n = 4). Columns represented the ratio of annexin V and PI double‐positive cells. ns, no significant difference. (C) Colony forming assay of SGC‐7901 cells after pre‐treatment with control CM, GC‐MSCs‐CM and CD4+ T cell‐primed GC‐MSCs‐CM (n = 3). Columns represented the number of colonies. ns, no significant difference
3.5. CD4+ T cell‐primed GC‐MSCs have greater GC growth‐promoting role than GC‐MSCs, with PD‐1/mammalian target of rapamycin (mTOR) signalling activation
To investigate further the role of GC‐MSCs stimulated by CD4+ T cells in GC growth, we injected SGC‐7901 cells treated with GC‐MSCs‐CM and CD4+ T cell‐primed GC‐MSCs‐CM into BALB/c nu/nu mice to establish subcutaneous xenograft tumour models. SGC‐7901 cells alone were used as a control. The growth of xenograft tumours was monitored for 3 weeks. Compared with the control group, tumours in the treated groups had markedly increased volume, and CD4+ T cell‐primed GC‐MSCs‐CM had more potent promotion of GC cell growth than GC‐MSCs‐CM (Figure 5A,B). These results demonstrate that GC‐MSCs stimulated by CD4+ T cells have greater potency in promoting tumour growth, and PD‐L1 may be involved in the enhanced tumour‐promoting effects of GC‐MSCs stimulated by CD4+ T cells.
Figure 5.
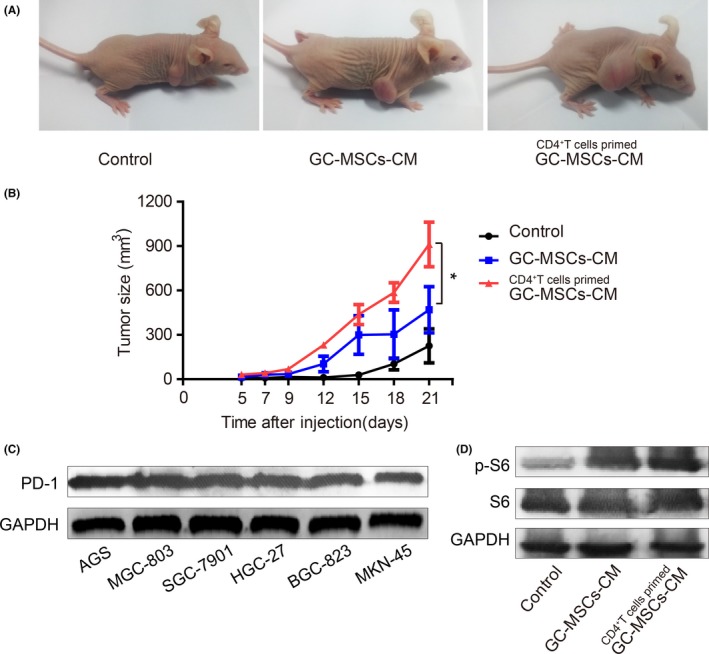
CD4+ T cell‐primed GC‐MSCs have greater GC growth‐promoting role than GC‐MSCs in vivo, with PD‐1 pathway activation. (A) BALB/c nu/nu mice were injected subcutaneously with SGC‐7901 cells pre‐treated with GC‐MSCs‐CM and CD4+ T cell‐primed GC‐MSCs‐CM. SGC‐7901 cells alone were used as controls. Tumour size was measured for 3 weeks. The photograph was taken at 21 days after SGC‐7901 cell injection. (B) Tumour growth curve. *P < .05. (C) PD‐1 expression in GC cell lines was detected by western blotting. (D) p‐S6 expression in SGC‐7901 cell xenograft tumours was analysed by western blotting
It has been reported that melanoma‐expressed PD‐L1 promotes tumour growth via combination with the melanoma PD‐1 receptor and activation of downstream mTOR signalling.19 We found that the PD‐1 was expressed in many types of GC cell line (Figure 5C). Hence, we assumed that CD4+ T cells upregulated PD‐L1 expression in GC‐MSCs, and then prompted GC growth in immunocompromised mice, which may be via combining with PD‐1 receptor in GC cells and activating downstream mTOR signalling. Whether the mTOR signalling pathways in SGC‐7901 cell xenograft were activated was not clear. Expression of p‐S6 in GC‐MSCs‐CM pre‐treatment xenograft tumour was higher than in the control group. There was higher expression in the CD4+ T cell‐primed GC‐MSCs‐CM group compared to the GC‐MSCs‐CM group (Figure 5D).
4. DISCUSSION
Recent studies have reported that many kinds of tumour‐associated MSCs are involved in tumour progression.2, 3 GC‐MSCs have been acquired from human GC tissues.4, 20 Related studies have found that these cells are similar to BM‐MSCs, but exhibit greater ability to promote GC cell proliferation and migration than do BM‐MSCs.4 The tumour microenvironment contains complex cellular components, such as MSCs, endothelial cells, and a wide range of immune cells. Most of these cells are derived from bone marrow and are recruited by tumour cells to promote tumour survival, growth and invasion.28 MSC‐mediated immunomodulation has received much attention.29 The interaction of MSCs and lymphocytes takes place via paracrine factors or cell‐to‐cell contact. In vitro experiments have shown that MSCs inhibit T‐cell proliferation via many soluble cytokines such as indolamine 2,3‐dioxygenase, transforming growth factor‐β and inhibitory molecules PD‐L1. Accumulating evidence suggests that proinflammatory cytokines such as IFN‐γ in the tumour microenvironment can upregulate PD‐L1 in MSCs and subsequently inhibit T‐cell proliferation via a contact‐dependent mechanism.17, 18 PD‐L1 expression can be induced by many proinflammatory cytokines. CD4+ T cells, as the major immune cells, have the ability to promote tumour growth. In this study, we focused on how CD4+ T cells affect GC‐MSCs, thus enabling GC progression.
In recent years, PD‐L1/PD‐1 antibodies have been used for tumour therapy and have shown promising outcomes.30, 31, 32 PD‐L1 expression is higher in GC tissues and serum. Positive staining of PD‐L1 was found in 42.2% of GC tissues, and PD‐L1 expression was significantly associated with tumour size, lymph node metastasis and tumour invasion.33, 34 PD‐L1 in cancer cells can induce T‐cell anergy or apoptosis through binding to its receptor PD‐1, resulting in cancer immune tolerance.35 However, Thompson et al36 reported that PD‐L1 was expressed in different cell types from the GC microenvironment; 12% in cancer cells and 44% in immune cells. We showed that PD‐L1 was expressed in GC‐MSCs, and CD4+ T cells upregulated PD‐L1 expression in GC‐MSCs. In addition, PD‐1 is expressed in many types of GC cell lines. This suggests the presence of another PD‐L1:PD‐1 axis that is relevant to tumour promotion, which may be GC‐MSC‐expressed PD‐L1 binding to its receptor PD‐1 in T cells or tumour cells.
Kleffel et al19 reported that the melanoma intrinsic PD‐1 receptor modulated a downstream effector of mTOR signalling and promoted tumour growth. We showed that many types of GC cell lines expressed PD‐1. Then, we established subcutaneous xenograft tumour models in BALB/c nu/nu mice using SGC‐7901 cells. The results suggested that CD4+ T cell‐primed GC‐MSCs‐CM had more potency in promoting tumour growth compared with GC‐MSCs‐CM. p‐S6 showed higher expression in the CD4+ T cell‐primed GC‐MSCs‐CM group than in the GC‐MSCs‐CM group. However, whether PD‐L1/PD‐1 antibody therapy can be applied to this GC model needs further experimental evidence. Further research could also determine which cytokines derived from CD4+ T cells improve PD‐L1 expression in GC‐MSCs, which may be a therapeutic target for GC. Combination treatment with CD4+ T cell‐derived cytokine antibodies and PD‐L1/PD‐1 antibodies may achieve a better therapeutic effect in GC patients.
Some studies have indicated that the JAK/STAT signalling pathway plays a central role in IFN‐γ‐induced PD‐L1 expression. Both STAT1 and STAT3 can bind to PD‐L1 promoter, but STAT3 typically mediates PD‐L1 transcription in cells.37, 38, 39 We also found that p‐STAT3 activation is related to PD‐L1 expression, and the p‐STAT3 pathway plays an important role in CD4+ T‐cell promotion of PD‐L1 expression in GC‐MSCs.
In summary, our data suggested that CD4+ T cells upregulated PD‐L1 expression in GC‐MSCs via p‐STAT3 signalling. CD4+ T cell‐primed GC‐MSCs promoted GC growth, via activating cancer cell‐intrinsic PD‐1/mTOR signalling. This reminds us that another PD‐L1/PD‐1 relevant regulatory approach may be present, which offers a novel underlying mechanism of GC progression.
AUTHOR CONTRIBUTIONS
Study design: WZ, RX and MW; data collection: RX, XZ, BC, BS, CX and LS; data analysis: WZ, RX, XZ and YZ; manuscript preparation: WZ, RX and WX.
CONFLICTS OF INTEREST
The authors declare no potential conflicts of interest.
Xu R, Zhao X, Zhao Y, et al. Enhanced gastric cancer growth potential of mesenchymal stem cells derived from gastric cancer tissues educated by CD4+ T cells. Cell Prolif. 2018;51:e12399 10.1111/cpr.12399
Funding information
This study was supported by the National Science Foundation of China (Grant number: 81472334) and Jiangsu province social development key research and development plan (Grant number: BE2017694).
Rongman Xu and Xiangdong Zhao contributed equally to this work.
REFERENCES
- 1. Chen W, Zheng R, Zuo T, Zeng H, Zhang S, He J. National cancer incidence and mortality in China, 2012. Chin J Cancer Res. 2016;28:1‐11. [DOI] [PMC free article] [PubMed] [Google Scholar]
- 2. Yan XL, Jia YL, Chen L, et al. Hepatocellular carcinoma‐associated mesenchymal stem cells promote hepatocarcinoma progression: role of the S100A4‐miR155‐SOCS1‐MMP9 axis. Hepatology. 2013;57:2274‐2286. [DOI] [PubMed] [Google Scholar]
- 3. McLean K, Gong Y, Choi Y, et al. Human ovarian carcinoma–associated mesenchymal stem cells regulate cancer stem cells and tumorigenesis via altered BMP production. J Clin Invest. 2011;121:3206‐3219. [DOI] [PMC free article] [PubMed] [Google Scholar]
- 4. Li W, Zhou Y, Yang J, et al. Gastric cancer‐derived mesenchymal stem cells prompt gastric cancer progression through secretion of interleukin‐8. J Exp Clin Cancer Res. 2015;34:52. [DOI] [PMC free article] [PubMed] [Google Scholar]
- 5. Zhu W, Xu W, Jiang R, et al. Mesenchymal stem cells derived from bone marrow favor tumor cell growth in vivo. Exp Mol Pathol. 2006;80:267‐274. [DOI] [PubMed] [Google Scholar]
- 6. Zhu W, Huang L, Li Y, et al. Exosomes derived from human bone marrow mesenchymal stem cells promote tumor growth in vivo. Cancer Lett. 2012;315:28‐37. [DOI] [PubMed] [Google Scholar]
- 7. Zhu W, Huang L, Li Y, et al. Mesenchymal stem cell‐secreted soluble signalingmolecules potentiate tumor growth. Cell Cycle. 2011;10:3198‐3207. [DOI] [PubMed] [Google Scholar]
- 8. Fridman WH, Dieu‐Nosjean MC, Pages F, et al. The immune microenvironment of human tumors: general significance and clinical impact. Cancer Microenviron. 2013;6:117‐122. [DOI] [PMC free article] [PubMed] [Google Scholar]
- 9. Zhu M, Wang M, Yang F, et al. miR‐155‐5p inhibition promotes the transition of bone marrow mesenchymal stem cells to gastric cancer tissue derived MSC‐like cells via NF‐κB p65 activation. Oncotarget. 2016;7:16567‐16580. [DOI] [PMC free article] [PubMed] [Google Scholar]
- 10. Wolfe AR, Trenton NJ, Debeb BG, et al. Mesenchymal stem cells and macrophages interact through IL‐6 to promote inflammatory breast cancer in pre‐clinical models. Oncotarget. 2016;7:82482‐82492. [DOI] [PMC free article] [PubMed] [Google Scholar]
- 11. Komohara Y, Takeya M. CAFs and TAMs: maestros of the tumour microenvironment. J Pathol. 2017;241:313‐315. [DOI] [PubMed] [Google Scholar]
- 12. Hashimoto O, Yoshida M, Koma Y, et al. Collaboration of cancer‐associated fibroblasts and tumour‐associated macrophages for neuroblastoma development. J Pathol. 2016;240:211‐223. [DOI] [PMC free article] [PubMed] [Google Scholar]
- 13. Arina A, Karrison T, Galka E, Schreiber K, Weichselbaum RR, Schreiber H. Transfer of allogeneic CD4+ T cells rescues CD8+ T cells in anti‐PD‐L1‐resistant tumors leading to tumor eradication. Cancer Immunol Res. 2017;5:127‐136. [DOI] [PMC free article] [PubMed] [Google Scholar]
- 14. Chevrier S, Levine JH, Zanotelli VRT, et al. An immune atlas of clear cell renal cell carcinoma. Cell. 2017;169:736‐749. [DOI] [PMC free article] [PubMed] [Google Scholar]
- 15. Daniel D, Meyer‐Morse N, Bergsland EK, Dehne K, Coussens LM, Hanahan D. Immune enhancement of skin carcinogenesis by CD4+ T cells. J Exp Med. 2003;197:1017‐1028. [DOI] [PMC free article] [PubMed] [Google Scholar]
- 16. Fusi A, Festino L, Botti G, et al. PD‐L1 expression as a potential predictive biomarker. Lancet Oncol. 2015;16:1285‐1287. [DOI] [PubMed] [Google Scholar]
- 17. Sheng H, Wang Y, Jin Y, et al. A critical role of IFNgamma in priming MSC‐mediated suppression of T cell proliferation through up‐regulation of B7‐H1. Cell Res. 2008;18:846‐857. [DOI] [PubMed] [Google Scholar]
- 18. Luz‐Crawford P, Noel D, Fernandez X, et al. Mesenchymal stem cells repress Th17 molecular program through the PD‐1 pathway. PLoS ONE. 2012;7:e45272. [DOI] [PMC free article] [PubMed] [Google Scholar]
- 19. Kleffel S, Posch C, Barthel SR, et al. Melanoma cell‐intrinsic PD‐1 receptor functions promote tumor growth. Cell. 2015;162:1242‐1256. [DOI] [PMC free article] [PubMed] [Google Scholar]
- 20. Xu X, Zhang X, Wang S, et al. Isolation and comparison of mesenchymal stem‐like cells from human gastric cancer and adjacent non‐cancerous tissues. J Cancer Res Clin Oncol. 2011;137:495‐504. [DOI] [PMC free article] [PubMed] [Google Scholar]
- 21. Dong L, Lv H, Li W, et al. Co‐expression of PD‐L1 and p‐AKT is associated with poor prognosis in diffuse large B‐cell lymphoma via PD‐1/PD‐L1 axis activating intracellular AKT/mTOR pathway in tumor cells. Oncotarget. 2016;7:33350‐33362. [DOI] [PMC free article] [PubMed] [Google Scholar]
- 22. Casey SC, Tong L, Li Y, et al. MYC regulates the antitumor immune response through CD47 and PD‐L1. Science. 2016;352:227‐231. [DOI] [PMC free article] [PubMed] [Google Scholar]
- 23. Lastwika KJ, Wilson W 3rd, Li QK, et al. Control of PD‐L1 expression by oncogenic activation of the AKT‐mTOR pathway in non‐small cell lung cancer. Cancer Res. 2016;76:227‐238. [DOI] [PubMed] [Google Scholar]
- 24. Wang WB, Yen ML, Liu KJ, et al. Interleukin‐25 mediates transcriptional control of PD‐L1 via STAT3 in multipotent human mesenchymal stromal cells (hMSCs) to suppress Th17 responses. Stem Cell Reports. 2015;5:392‐404. [DOI] [PMC free article] [PubMed] [Google Scholar]
- 25. Bellucci R, Martin A, Bommarito D, et al. Interferon‐γ‐induced activation of JAK1 and JAK2 suppresses tumor cell susceptibility to NK cells through upregulation of PD‐L1 expression. Oncoimmunology. 2015;4:e1008824. [DOI] [PMC free article] [PubMed] [Google Scholar]
- 26. Ritprajak P, Azuma M. Intrinsic and extrinsic control of expression of the immunoregulatory molecule PD‐L1 in epithelial cells and squamous cell carcinoma. Oral Oncol. 2015;51:221‐228. [DOI] [PubMed] [Google Scholar]
- 27. Dorand RD, Nthale J, Myers JT, et al. Cdk5 disruption attenuates tumor PD‐L1 expression and promotes antitumor immunity. Science. 2016;353:399‐403. [DOI] [PMC free article] [PubMed] [Google Scholar]
- 28. Turley SJ, Cremasco V, Astarita JL. Immunological hallmarks of stromal cells in the tumour microenvironment. Nat Rev Immunol. 2015;15:669‐682. [DOI] [PubMed] [Google Scholar]
- 29. Schepers K, Fibbe WE. Unraveling mechanisms of mesenchymal stromal cell‐mediated immunomodulation through patient monitoring and product characterization. Ann N Y Acad Sci. 2016;1370:15‐23. [DOI] [PubMed] [Google Scholar]
- 30. Tumeh PC, Harview CL, Yearley JH, et al. PD‐1 blockade induces responses by inhibiting adaptive immune resistance. Nature. 2014;515:568‐571. [DOI] [PMC free article] [PubMed] [Google Scholar]
- 31. Powles T, Eder JP, Fine GD, et al. MPDL3280A (anti‐PD‐L1) treatment leads to clinical activity in metastatic bladder cancer. Nature. 2014;515:558‐562. [DOI] [PubMed] [Google Scholar]
- 32. Chen J, Jiang CC, Jin L, Zhang XD. Regulation of PD‐L1: a novel role of pro‐survival signalling in cancer. Ann Oncol. 2016;27:409‐416. [DOI] [PubMed] [Google Scholar]
- 33. Boger C, Behrens HM, Mathiak M, Kruger S, Kalthoff H, Rocken C. PD‐L1 is an independent prognostic predictor in gastric cancer of Western patients. Oncotarget. 2016;7:24269‐24283. [DOI] [PMC free article] [PubMed] [Google Scholar]
- 34. Takahashi N, Iwasa S, Sasaki Y, et al. Serum levels of soluble programmed cell death ligand 1 as a prognostic factor on the first‐line treatment of metastatic or recurrent gastric cancer. J Cancer Res Clin Oncol. 2016;142:1727‐1738. [DOI] [PMC free article] [PubMed] [Google Scholar]
- 35. Afreen S, Dermime S. The immunoinhibitory B7‐H1 molecule as a potential target in cancer: killing many birds with one stone. Hematol Oncol Stem Cell Ther. 2014;7:1‐17. [DOI] [PubMed] [Google Scholar]
- 36. Thompson ED, Zahurak M, Murphy A, et al. Patterns of PD‐L1 expression and CD8 T cell infiltration in gastric adenocarcinomas and associated immune stroma. Gut. 2017;66:794‐801. [DOI] [PMC free article] [PubMed] [Google Scholar]
- 37. Wolfle SJ, Strebovsky J, Bartz H, et al. PD‐L1 expression on tolerogenic APCs is controlled by STAT‐3. Eur J Immunol. 2011;41:413‐424. [DOI] [PubMed] [Google Scholar]
- 38. Abiko K, Matsumura N, Hamanishi J, et al. IFN‐gamma from lymphocytes induces PD‐L1 expression and promotes progression of ovarian cancer. Br J Cancer. 2015;112:1501‐1509. [DOI] [PMC free article] [PubMed] [Google Scholar]
- 39. Mandai M, Hamanishi J, Abiko K, Matsumura N, Baba T, Konishi I. Dual faces of IFN in cancer progression: a role of PD‐L1 induction in the determination of pro‐ and antitumor Immunity. Clin Cancer Res. 2016;22:2329‐2334. [DOI] [PubMed] [Google Scholar]


