Abstract
Objectives
The goal of this study was to explore the effects of BHX on human chronic myeloid leukaemia (CML) cells and to elucidate the underlying molecular mechanism.
Materials and methods
CML cell line K562 cells were treated with BHX. The effects of BHX on cell proliferation, apoptosis and cell cycle were detected. Subsequently, the caspase, ATP activity, Ca2+, ROS and mitochondrial membrane potential (MMP) levels treated with various concentrations of BHX were analysed. The variation of relevant proteins and genes was detected. Further, toxicity of BHX on peripheral blood cells, bone marrow‐nucleated cells (BMNC) and organ index were investigated on mice.
Results
Results showed that BHX suppressed K562 cell proliferation in a dose‐dependent manner and induced apoptosis and G0/G1 phase arrest. BHX induced mitochondria‐mediated apoptosis, which was associated with downregulation of MMP, activation of caspase‐3 and caspase‐9, generation of intracellular ROS and elevation of Ca2+ in K562 cells. In treated cells, ATP levels were decreased, expression of total β‐catenin, phosphorylated β‐catenin and β‐catenin in the nucleus was decreased, and expression of cell cycle‐related proteins was decreased. Further analysis revealed that BHX lowered the transcriptional level of β‐catenin. Lastly, BHX treatment significantly reduced the number of white blood cells, but had no effect on BMNC and organ index.
Conclusions
These findings provide further insight into the potential use of BHX as an anti‐cancer agent against human leukaemia.
Keywords: apoptosis, chronic myeloid leukaemia, pyrazoline, β‐catenin
1. INTRODUCTION
β‐catenin, the main downstream effector of canonical Wnt signalling pathway, has a role in the maintenance of tissue homeostasis by regulating cellular processes, including cell proliferation, cell differentiation, cell survival and angiogenesis.1 Activation of the Wnt/β‐catenin signalling pathway is important in human tumourigenesis.2, 3 The Wnt/β‐catenin signalling cascade has become an increasing focus of interest in cancer research as β‐catenin may be a potential target for oncology drug discovery.
Leukaemia is a haematopoietic malignancy that originates in blood‐forming tissue. It has been estimated that in 2014 in the US, approximately 24 090 people died of leukaemia.4 Chronic myeloid leukaemia (CML) is characterized by granulocytosis and splenomegaly, with a disease course that is triphasic, commencing with a chronic phase, progressing to an accelerated phase and, ultimately, ending in a terminal phase called “blast crisis”.5, 6 Although treatment with imatinib mesylate and other tyrosine kinase inhibitors has improved the survival of CML patients, a significant proportion of patients expected effectiveness of treatment is not achieved, and some patients become refractory to treatment.7 It has been reported that the Wnt/β‐catenin signalling pathway contributes to the development of leukaemia stem cells (LSCs) in CML and plays an important role in the survival and renewal of CML cells.8, 9 Studies have shown that the suppression of β‐catenin results in CML cells becoming more susceptible to imatinib.10
In addition to the potential role of the Wnt/β‐catenin signalling pathway and its downstream effects as a potential target for treatment of human leukaemia, upstream regulatory signal pathways may also be attractive future targets for treatment. Funato et al11 have identified the activation of Wnt signalling through oxidative stress, while cellular defence against reactive oxygen species (ROS) has been shown to be mediated by β‐catenin.12 Similar to Wnt signalling, the formation of ROS plays an important role in carcinogenesis, specifically in the molecular regulation programmed cell death, or apoptosis.13 Mitochondria are the major source and target of ROS, and abnormal ROS levels will induce the apoptosis of cancer cells via the mitochondrial pathway.14 Mitochondria have a central role in maintaining cell viability, and in apoptosis there is a loss of mitochondrial membrane potential (MMP), mitochondrial outer membrane permeabilization followed by the release of proteins including cytochrome c, and Smac/DIABLO into the cytosol with the accumulation of cytosolic effector proteases (caspases).15 Because the abnormal regulation of apoptosis is an important component of cancer development, drugs that induce tumour cell apoptosis and prevent uncontrolled cell division may be effective in many forms of malignancy, including leukaemia.16
The novel pyrazoline derivative, N‐(4‐hydroxybenzyl)‐1,3,4‐triphenyl ‐4,5‐dihydro‐1H‐pyrazole‐5‐carboxamide (BHX), designed and synthesized previously, has been described to block the canonical Wnt/β‐catenin signalling pathway, and has been reported to exhibit cytotoxic effects in multiple solid tumour cell lines.17, 18, 19 However, the anti‐proliferative effects of BHX on leukaemia cells have not been previously investigated. The purpose of this study was to evaluate the effects of BHX on human CML cells in vitro and to elucidate the underlying molecular mechanism.
2. MATERIALS AND METHODS
2.1. Cell culture and reagents
The K562 cells were maintained in RPMI 1640 medium supplemented with 10% foetal bovine serum (FBS), 100 U/mL penicillin, 100 μg/mL streptomycin at 37°C in 5% CO2 in a humidified incubator. RPMI 1640, FBS, penicillin and streptomycin were purchased from Gibco (Gaithersburg, MD, USA). Primary antibodies against β‐catenin, c‐jun, c‐myc, cyclin D1, Lamin B and GAPDH were obtained from Cell Signalling Technology (Danvers, MA, USA).
2.2. Cell proliferation assay
Cells were plated, treated with BHX and maintained for 12, 24 or 48 hours. Then, MTT solution was added and incubated at 37°C for 4 hours. The solution in the wells was aspirated gently after centrifugation, and dimethyl sulphoxide (DMSO) was added to dissolve the formazan crystals. After mixing for 5 minutes, the absorbance was measured at 490 nm by a SpectraMax Plus 384 absorbance microplate reader (Molecular Devices, Sunnyvale, CA, USA). Further, the morphology of the treated cells was visualized using an EVOS XL light microscope (Thermo Fisher, Waltham, MA, USA) equipped with an inverted lens.
2.3. Cellular uptake
Pyrazolines, including BHX, are fluorophores that emit fluorescence when viewed under UV light. After treating the cells with BHX for increasing time points at 37°C, the medium was removed and the cells were rinsed 3 times with PBS to remove the extracellular BHX. An HCl/DMSO solution (0.04 mol/L, 100 μL) was added to lyse the cells, and the intensity of the fluorescence of the BMX in the lysate was determined by the use of a fluorescence SpectraMax M5 microplate reader (Molecular Devices) with the excitation and emission wavelengths set at 350 and 460 nm, respectively.
2.4. Apoptosis and cell cycle assay
For apoptosis assay, cells were seeded into 6‐well plates and increasing concentrations of BHX were added. After 24 hours of treatment, cells were harvested, washed and resuspended in binding buffer (1×) with the addition of 5 μL of Annexin V and 5 μL of PI. The mixture was incubated in the dark for 15 minutes before 400 μL of binding buffer was added. For cell cycle analysis, cells were pre‐treated in the presence or absence of 3 mmol/L N‐acetylcysteine (NAC) for 2 hours, followed by treatment with the indicated concentrations of BHX for 24 hours. Then, the treated cells were fixed overnight in 75% ethanol at −20°C. The cells were washed, incubated with 5 μL RNase (0.25 mg/mL) at 37°C for 30 minutes, pelleted, resuspended in PI (50 μg/mL), and incubated in the dark for 15 minutes. Cells were analysed by flow cytometry using a FACSCanto II flow cytometer (BD Biosciences, Franklin Lakes, NJ, USA).
2.5. Measurement of ROS generation, MMP and intracellular Ca2+
The effect of BHX on the intracellular ROS generation was monitored by a dichlorofluorescein diacetate (H2DCFDA) assay. After treating the cells with BHX for 24 hours, the culture medium was replaced with 1 mL of H2DCFDA/RPMI 1640 medium and incubated at 37°C for 30 minutes, with the final H2DCFDA concentration being 10 μmol/L. Stained cells were analysed using a FACSCanto II flow cytometer (BD Biosciences).
A JC‐1 staining assay for flow cytometry evaluation of MMP was performed using a membrane‐permeable lipophilic cationic fluorescent carbocyanine dye. 5,5′,6,6′‐tetrachloro‐1,1′,3,3′‐tetraethyl‐imidacarbocyanine iodide, was used to allow for dissipation of the cells to evaluate the MMP. Briefly, treated cells were collected and stained with JC‐1 at 37°C in the dark for 20 minutes. Then, the cells were washed twice, suspended in the assay buffer and measured using a FACSCanto II flow cytometer (BD Biosciences). Monomers and aggregates of JC‐1 were detected in the FL1 channel (green channel) and FL2 channel (red channel), respectively. Intracellular Ca2+ was detected using 5 μmol/L of Fluo‐3 acetoxymethyl ester derivative.
2.6. Caspase activity assay
The activity of caspase‐3 and caspase‐9 was determined using a colorimetric activity assay kit (Beyotime, Jiangsu, China). Briefly, cells were pre‐treated with 3 mmol/L NAC for 2 hours. After treating the cells with increasing concentrations of BHX for 24 hours, the cells were harvested and lysed on ice for 15 minutes. After centrifugation, the supernatants were obtained and incubated with Ac‐DEVD‐pNA (caspase‐3 substrate) or Ac‐LEHD‐pNA (caspase‐9 substrate) at 37°C in the dark for 2 hours. The absorbance at 405 nm was recorded on a Synergy H1 multi‐mode microplate reader (BioTek, Winooski, VT, USA). The increase in caspase activity was calculated by direct comparison with the level of absorbance of a standard control.
2.7. ATP‐luciferase assay
Intracellular ATP levels were measured using the firefly luciferase‐based ATP assay kit (Beyotime). Briefly, after BHX treatment, the K562 cells were centrifuged at 12 000 g for 5 minutes. In 96‐well plates, 100 μL of each supernatant was mixed with 100 μL ATP working dilution of detection solution. Luminance was measured in relative luminescence units with an Epoch microplate reader (BioTek) and data were normalized to total cell protein.
2.8. Western blot analysis
Protein was lysed from the treated cells by SDS lysis buffer. Similarly, nuclear extracts were prepared by using NE‐PER nuclear extraction reagents (Thermo Fisher, Waltham, MA, USA). The protein was then transferred onto polyvinylidene fluoride membrane (Millipore, Billerica, MA, USA). The membranes were then incubated with antibodies against GAPDH, Lamin B, β‐catenin, c‐jun, c‐myc and cyclin D1 (1:1000 dilution), followed by incubation with IRDye‐conjugated anti‐rabbit or anti‐mouse IgG secondary antibody (1:1000 dilution). Blot images were visualized and recorded with an Odyssey LI‐COR infrared imaging system (LI‐COR, Lincoln, NE, USA).
2.9. PCR analysis
Total RNA from K562 cells was isolated using TRIzol reagent (Life Technologies, Carlsbad, CA, USA). Synthesis of cDNA was done by using a RevertAid First Strand cDNA Synthesis Kit (Thermo Scientific). β‐Catenin was amplified by a standard PCR protocol using 5′‐CATCATCGTGAGGGCTTACTG‐3′ as forward primer, and 5′‐TGAAGGCAGTCTGTCGTAATAG‐3′ as reverse primer. The reaction mixtures were heated at 95°C for 10 minutes, followed by 30 cycles of 94°C for 30 seconds, 58°C for 30 seconds, 72°C for 20 seconds and a final extension at 72°C for 5 minutes. Subsequently, PCR products were electrophoresed through 1.5% agarose gel and then subjected to a gel/fluorescence image analysis system for scanning. GAPDH was selected as the endogenous control in the assay.
2.10. Animal studies
Animal experiments were conducted according to protocols approved by the Institutional Animal Care and Use Committee of the Tianjin Medical University Cancer Institute & Hospital. Male BALB/C mice (clean grade), weighing 20 ± 2 g, were purchased from Institute of Laboratory Animal Sciences (Beijing, China). The mice were randomized into 4 groups (N = 6). The experimental groups were treated with consecutive intraperitoneal injections of BHX with the dosage of 40, 80 or 160 mg/kg d for 7 days. Mice of the control group were treated with the same volume of saline.
The bone marrow cells were collected as previously described with slight modification.20 The femoral bones were separated, briefly immersed in 75% ethanol, and rinsed 3 times in PBS. The epiphyses of each bone were removed and the bone marrow suspensions were prepared by flushing the diaphysis with PBS through a syringe for several times. The bone marrow‐nucleated cells (BMNC) were prepared with mouse lymphocyte separation medium according to the manufacture's protocol. Then, the nucleated cells were counted.
Peripheral blood was collected into ethylenediaminetetraacetic acid‐coated tubes by extracting eyeballs. The red blood cells (RBC), white blood cells (WBC), haemoglobins (Hb) and platelets (Plt) were measured by a MEK722 automatic analyser (Japan). Further, the thymuses and spleens of the mice were removed and weighed immediately after sacrifice, and the organ index was calculated as the ratio of organ weight to body weight (mg/g).
2.11. Statistical analysis
All data were presented as mean ± SD. Statistical analysis was performed using a 2‐tailed t test and analysis of variance (ANOVA). A value of P < .05 was considered statistically significant.
3. RESULTS
3.1. Cellular uptake of BHX
The chemical structure of BHX is presented in Figure 1A. BHX has an absorption peak at wavelength 350 nm (Figure 1B), which was chosen as the excitation wavelength; the proximal fluorescence emission wavelength was 460 nm (Figure 1C). The uptake of BHX increased as the time increased to 5 hours, followed by a rapid decrease. The amount of BHX uptaken reached up to 3.83 ± 0.19 μmol/L per 108 cells 5 hours after incubation, about 5‐fold greater than that at 1 hour. After exposure to BHX for 24 hours, the amount of intracellular BHX decreased to 0.72 ± 0.16 μmol/L per 108 cells (Figure 1D).
Figure 1.
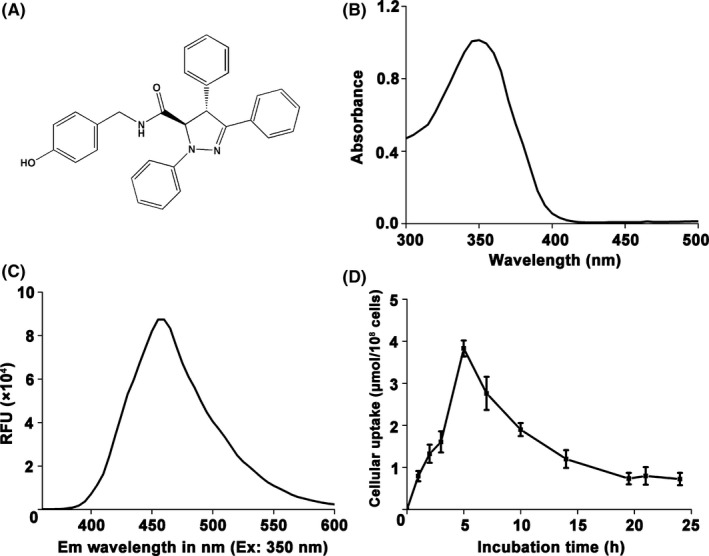
The cellular uptake of BHX in K562 cells was based upon its fluorescent property. A, Chemical structure of BHX. B, Ultraviolet‐visible spectroscopy of BHX. C, Fluorescence emission spectra of BHX with excitation wavelength at 350 nm. D, Cells were treated with 20 μmol/L of BHX for different time points. Values expressed were mean ± SD of experiments performed in triplicate
3.2. BHX inhibited cell proliferation
BHX treatment showed dose‐ and time‐dependent inhibition of K562 proliferation (Figure 2A). After incubation for 24 hours at a concentration as low as 10 μmol/L, BHX significantly inhibited K562 proliferation by 19.83 ± 2.4% (P < .05). Cell proliferation as high as 78.68 ± 5.5% was inhibited by BHX at the concentration of 80 μmol/L after 48 hours incubation (P < .05). The result supports the inhibitory effect of BHX on the growth of K562 cells.
Figure 2.
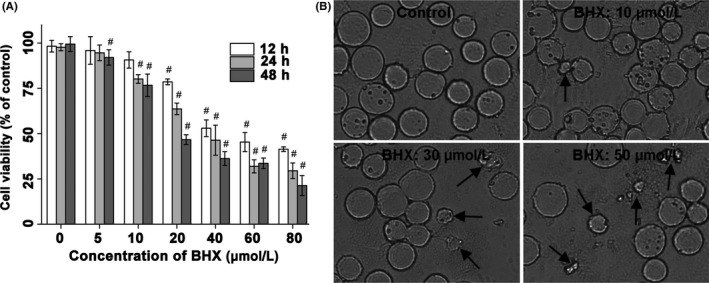
BHX inhibited the growth capacity of K562 cells. A, The cell viability was inhibited in K562 cells at the indicated time points according to the MTT assay. B, Morphological changes of K562 after 24 h incubation with BHX (200×). Black arrows indicate cell shrinkage and cell fragmentation
3.3. Morphology of BHX‐treated cells
The morphological changes of K562 cells induced by BHX were depicted in Figure 2B. Cells treated with BHX showed the characteristics of apoptosis, including cell shrinkage, cell fragmentation and perinuclear clumping of condensed chromatin. The morphological changes were much more noticeable after incubation of K562 cells with relatively high concentrations of BHX.
3.4. BHX arrested the cell cycle and induced apoptosis
As shown in Figure 3A, BHX treatment arrested the K562 cell cycle at the G0/G1 phase and resulted in a decrease in the number of cells in the S and G2/M phases, in a dose‐dependent manner. Cells in the G0/G1 phase were 55.33 ± 0.52% and 68.06 ± 1.31%, respectively, following BHX treatment at doses of 40 or 50 μmol/L. Cells in the G0/G1 phase in non‐treated cells were 21.80%. Furthermore, the rate of G0/G1 phase in K562 cells pre‐treated with NAC was partially diminished compared to cells without pre‐treatment. K562 cells underwent early apoptosis (Figure 3B) in a dose‐dependent manner. The apoptosis rates of BHX treated with BHX (40 or 50 μmol/L) for 24 hours were 20.4 ± 1.18% and 27.0 ± 1.89%, respectively (P < .01 and P < .05, compared with the control group). To further investigate how BHX regulates cell cycle, we detected Wnt pathway downstream target genes c‐jun, c‐myc and cyclin D1 by Western blot. As depicted in Figure 3C, the expression of related proteins was downregulated in a dose‐dependent manner.
Figure 3.
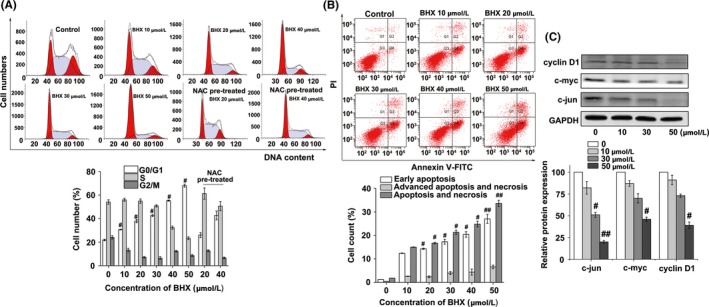
Effects of BHX on K562 cell cycle and apoptosis in vitro. BHX induced (A) G0/G1 arrest and (B) early apoptosis in K562 cells when compared with the control group. (C) Effect of BHX on Wnt target genes c‐myc, c‐jun, and cyclin D1 were determined by Western blot analysis. GAPDH was used as a loading control. Results were representative of 3 separate experiments; data were expressed as mean ± SD #P < .05 when compared with the control group
3.5. BHX‐induced caspase activation
As illustrated in Figure 4A, the activity of caspase‐3 and caspase‐9 were increased in a concentration‐dependent manner following BHX treatment. The caspase‐3 activity increased to 1.18 ± 0.09, 1.39 ± 0.06 and 1.85 ± 0.06‐fold following treatment with BHX at concentrations of 10, 30 and 50 μmol/L, respectively. Similarly, the caspase‐9 activity increased to 1.29 ± 0.06, 1.81 ± 0.04 and 2.69 ± 0.10‐fold following treatment with BHX at concentrations of 10, 30 and 50 μmol/L, respectively. Further, co‐treatment of BHX with the reducing agent, NAC, reduced the effect of BHX‐induced caspase activation.
Figure 4.
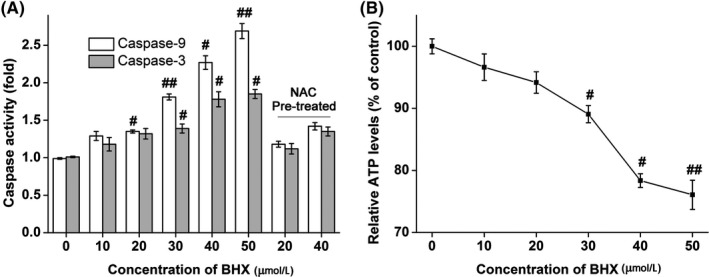
Activities of caspase‐3 or caspase‐9 (A) and ATP (B) in K562 cells following incubation with varying BHX concentrations for 24 h. The results were expressed as mean ± SD. #P < .05 and ##P < .01 when compared with the control group
3.6. BHX‐induced generation of ROS, mitochondrial dysfunction, elevation of intracellular Ca2+ and reduced ATP activity
Flow cytometry analysis showed that BHX induced ROS generation in a dose‐dependent way following treatment with BHX for 24 hours (Figure 5A). Figure 6 shows that the cell population showing green fluorescence was increased following the addition of increasing doses of BHX, reduced the MMP in the K562 cells. In addition, treatment with BHX increased the proportion of fluorescence‐positive cells from 0.9% in control group to 5.5%, 15.5% and 61.7% in the BHX‐treated groups with doses of 10, 30 and 50 μmol/L, respectively (Figure 5B). Figure 4B shows the ATP activities in K562 cells. Compared with the control group, BHX treatment resulted in a significant reduction of MMP when BHX at concentrations of 30 μmol/L (P < .05), 40 μmol/L (P < .05) and 50 μmol/L (P < .01), respectively.
Figure 5.
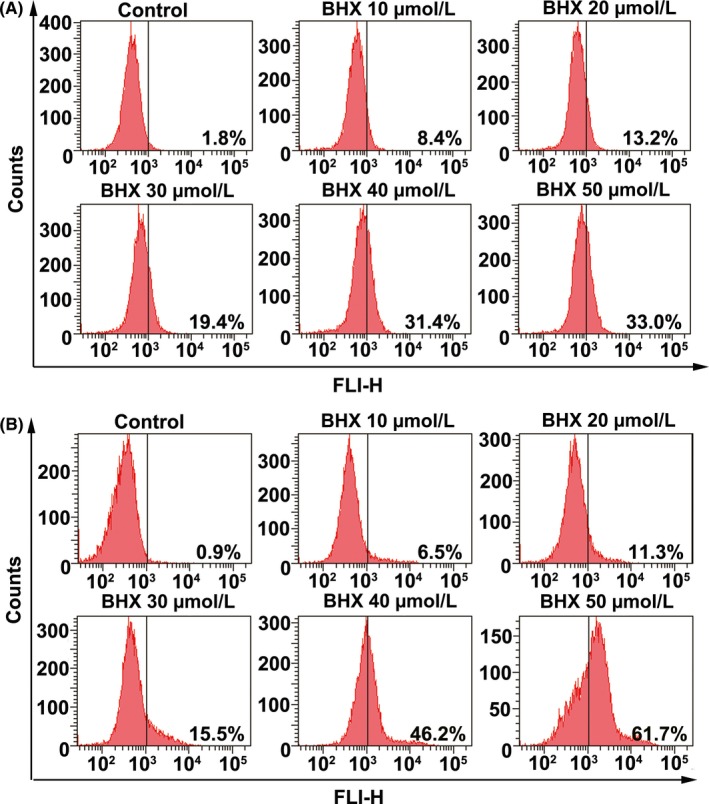
BHX induced intracellular ROS generation (A) and elevation of intracellular calcium (B) in K562 cells. The cells were treated with different concentrations of BHX for 24 h. Flow cytometry analysis was used to detect the intracellular ROS level by staining with DCFH‐DA (A) and the intracellular calcium was detected by probing with Fluo‐3 (B)
Figure 6.
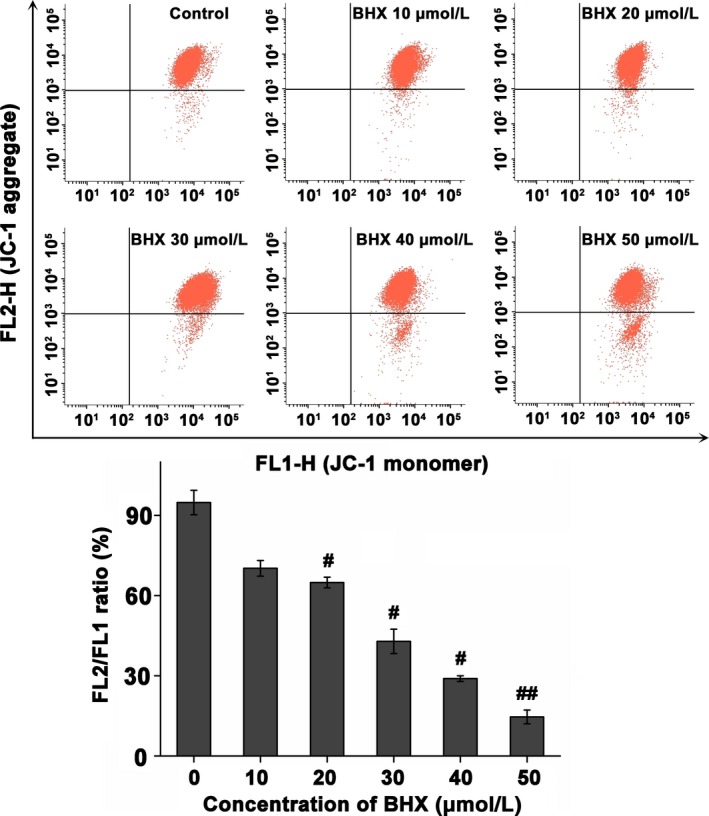
Dissipation of mitochondrial membrane potentials in K562 cells following incubation with varied concentrations of BHX for 24 h. Treated cells were harvested, stained with JC‐1, and assayed by flow cytometry. The histogram illustrates the ratio of FL2/FL1. Each assay was repeated in triplicate; data were expressed as mean ± SD #P < .05 and ##P < .01 compared with the control group
3.7. BHX inhibited the transcription of β‐catenin
The results of Western blotting reviewed that the expression of β‐catenin in the nucleus was downregulated after BHX treatment (Figure 7A). What is more, the expression level of total β‐catenin after BHX treatment was also downregulated. However, compared with the control group, the expression of p‐β‐catenin did not increase. In contrast, BHX slightly decreased the p‐β‐catenin expression (Figure 7B). Further, we examined β‐catenin at the transcriptional level by PCR, and the results in Figure 7C showed that the mRNA level of β‐catenin was significantly decreased by 50 μmol/L BHX treatment (P < .05).
Figure 7.
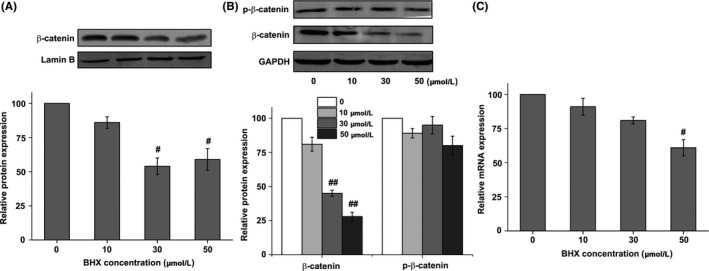
Effect of BHX on the protein expression of β‐catenin in the nucleus (A), total β‐catenin and p‐β‐catenin (B). Effect of BHX on the mRNA expression of β‐catenin (C). K562 cells were treated with different concentrations of BHX for 24 h and the protein expression of p‐β‐catenin, β‐catenin in the nucleus and total β‐catenin was determined by Western blot analysis. mRNA expression of β‐catenin was determined by PCR. GAPDH was used as a loading control
3.8. Effect of BHX on peripheral blood cells, BMNC and organ index
There were no unexpected deaths after BHX treatment. The routine blood test indicators of WBC, RBC, Hb, Plt and the BMNC are shown in Table 1. The quantities of WBC, RBC, Hb, Plt from peripheral blood and the BMNC in the control group were 7.81 × 10⁹/L, 9.96 × 10¹²/L, 16.74 g/dL, 1031.42 × 109/L and 9.27 × 10⁶/femur, respectively. And the quantities of WBC were significantly reduced after BHX treatment (80 or 160 mg/kg, P < .05). However, no statistically significant differences were found in the organ index between the control group and the BHX‐treated group (Table 2).
Table 1.
Effect of BHX on the peripheral haemogram and BMNC of BHX‐treated mice (mean ± SD, n = 6)
| Group | WBC (×109/L) | RBC (×1012/L) | Hb (g/dL) | Plt (×109/L) | BMNC (×106/femur) |
|---|---|---|---|---|---|
| Control | 7.81 ± 1.63 | 9.96 ± 1.48 | 16.74 ± 2.51 | 1031.42 ± 218.43 | 9.27 ± 2.14 |
| BHX‐low | 7.63 ± 2.04 | 9.87 ± 1.25 | 15.34 ± 3.28 | 973.09 ± 164.33 | 8.92 ± 1.59 |
| BHX‐medium | 5.18 ± 0.96a | 10.38 ± 2.41 | 14.92 ± 1.63 | 1147.26 ± 253.20 | 9.17 ± 2.38 |
| BHX‐high | 4.32 ± 0.69a | 9.91 ± 1.97 | 15.58 ± 2.59 | 1092.17 ± 187.29 | 8.07 ± 2.16 |
BMNC, bone marrow‐nucleated cells.
P < .05, compared with the control group.
Table 2.
Effect of BHX on the thymus index and spleen index of BHX‐treated mice (mean ± SD, n = 6)
| Group | Thymus index (mg/g) | Spleen index (mg/g) |
|---|---|---|
| Control | 3.64 ± 0.26 | 2.86 ± 0.17 |
| BHX‐low | 3.98 ± 0.37 | 2.74 ± 0.25 |
| BHX‐medium | 3.40 ± 0.31 | 2.91 ± 0.28 |
| BHX‐high | 3.87 ± 0.22 | 2.65 ± 0.16 |
4. DISCUSSION
In the present study, BHX suppressed K562 cell proliferation in a dose‐dependent manner and induced apoptosis and G0/G1 phase arrest. K562 cells treated with BHX showed morphological characteristics of apoptosis, which was associated with downregulation of MMP, activation of caspase‐3 and caspase‐9, generation of intracellular ROS, and elevation of Ca2+ in K562 cells. In BHX‐treated cells, ATP levels were decreased, the expression of β‐catenin in the nucleus, total β‐catenin and p‐β‐catenin was decreased, and the expression of cell cycle‐related proteins c‐jun, c‐myc and cyclin D1 was decreased. Co‐treatment of BHX with the reducing agent, NAC, decreased the effect of BHX‐induced G0/G1 phase arrest and caspase activation. The PCR analysis showed that BHX had inhibitory effect on the β‐catenin mRNA level. The findings are supported by previous studies and, as the published literature shows, they have implications for future treatment approaches for human CML.
The Wnt/β‐catenin signalling pathway is known to play an important role in the pathogenesis and progression of CML.21 The deletion of β‐catenin in mice has been reported to cause a reduction in the risk of CML induced by Bcr‐Abl.22 Increased activity of the Wnt/β‐catenin pathway has been shown to correlate with a poor patient response to imatinib and LSC transformation in “blast crisis” CML.23 The effect of BHX on leukaemia cells and the underlying molecular mechanisms of action have remained unclear, until the present study demonstrated that BHX inhibited the growth of K562 cells by inducing apoptosis and G0/G1 arrest. To our knowledge, this is the first report of the possible effect of BHX in CML.
Furthermore, this study found that BHX treatment decreased the expression of β‐catenin and the protein products of the Wnt target genes c‐myc, c‐jun and cyclin D1 in the G1‐S transition, which resulted in cell cycle arrest during the G0/G1 phase, a finding which is supported by a previous study.24 Accumulated β‐catenin travels to the nucleus and activates the Wnt signalling pathway. In the absence of Wnt signalling, the level of β‐catenin remained low through the degradation of cytoplasmic β‐catenin, which is targeted for phosphorylation by CK1‐α at the Ser45 site, followed by phosphorylation by GSK3‐β at Ser33, Ser37 and Thr41.25 Therefore, we detected the protein levels of p‐β‐catenin at the Ser45/Thr41 site after BHX treatment. However, the p‐β‐catenin protein level was slightly downregulated. Hence, BHX reduced the expression of β‐catenin not by blocking the Wnt signalling pathway. PCR experiment revealed that β‐catenin mRNA levels decreased, implying that the synthesis of β‐catenin was reduced. Hence, β‐catenin transcription and translation was downregulated, reducing β‐catenin protein levels in the cytoplasm, and ultimately inhibiting the Wnt signalling pathway. Thus, the total amount of β‐catenin was reduced, and p‐β‐catenin level also was lowered slightly.
Apoptosis, or programmed cell death, may occur through an intrinsic cell death receptor‐mediated pathway or an extrinsic mitochondria‐mediated pathway.26 Apoptotic cell death serves as a natural barrier to cancer development, and may be an effective target to preventing the progression of malignancy.27 The mitochondrial pathway is generated by internal signals arising within the cell, including ROS, reactive nitrogen species, hormones, cell‐cell interactions, growth factors, antigens and chemotherapeutics.28 The present study illustrated that BHX decreased the level of MMP in K562 cells in a dose‐dependent manner. The loss of MMP is recognized as a pivotal event in early mitochondrial‐dependent apoptosis, resulting in the release of cytochrome c from the mitochondria to the cytoplasm, activation of caspase‐9, leading to the downstream activation of caspase‐3.29, 30 Caspases are aspartate‐specific cysteine proteases that execute selective cleavage of key cellular components with a key role in regulating biological processes, including apoptosis.31, 32 Induction of apoptosis in cells leads to the activation of a family of caspases including effector caspase‐3, ‐6, ‐7 and initiator caspase‐8, ‐9 and‐10.33 The active form of caspase‐9 activates caspase‐3, resulting in the disintegration of cytoskeletal and nuclear proteins.34 The finding in this study that increased activities of caspase‐3 and caspase‐9 in K562 cells following BHX treatment supported the mitochondria‐dependent activation of the caspase cascade.35
ROS play important roles in cell signalling and homeostasis, and are chemically reactive, oxygen‐containing molecules.36 Funato et al11 identified the activation of Wnt signalling through oxidative stress, while cellular defence against ROS is mediated by β‐catenin.12 Large intracellular ROS levels could attack biological molecules, breaking the redox balance of the cells, leading to DNA damage and cell apoptosis through downstream signalling pathways, thereby playing a role in carcinogenesis.37 In the current study, following BHX treatment, ROS levels increased dramatically, which indicated that BHX is a ROS‐sensitive drug and the effect of leukaemic cell apoptosis requires the ROS signalling pathway.35 High levels of ROS could result in oxidative damage to mitochondrial proteins and is sufficient to trigger mitochondrial dysfunction, including the ability to synthesize ATP.38, 39 Therefore, ATP levels were measured, and showed a dose‐dependent decrease in ATP levels following BHX treatment, indicating that BHX can affect cell viability by inhibiting the respiratory cycle.40 Mitochondrial modulation of Ca2+ signalling and intracellular Ca2+ is produced during apoptosis and acts as a second messenger.41 Furthermore, intracellular Ca2+ can be sequestered in mitochondria to promote oxidative phosphorylation, but Ca2+ overload can trigger mitochondria depolarization and leads to the release of apoptosis promoting factors.42 The elevation of Ca2+ demonstrated in this study was associated with mitochondrial‐mediated apoptosis triggered by BHX. Although the detailed molecular mechanisms of mitochondrial dysfunction remain to be further elucidated, these results demonstrated that mitochondrial dysfunction was induced by BHX.
In summary, these findings support a role for BHX‐induced mitochondrial‐dependent apoptosis and G0/G1 phase in K562 human myelogenous leukaemia cells in vitro connected to the Wnt/β‐catenin signalling pathway. This study suggested that BHX should be evaluated further as a potential treatment for human leukaemia.
ACKNOWLEDGEMENTS
This work was supported by the Tianjin Key Project in the Health Sector (14KG140) and National Clinical Research Center for Cancer Cultivation Project. The authors thank Professor Zheng Tian, Peking Union Medical College, for providing K562 cells.
CONFLICT OF INTEREST
The authors declare that they have no competing interests.
Bao H, Zhang Q, Du Y, et al. Apoptosis induction in K562 human myelogenous leukaemia cells is connected to the modulation of Wnt/β‐catenin signalling by BHX, a novel pyrazoline derivative. Cell Prolif. 2018;51:e12433 10.1111/cpr.12433
REFERENCES
- 1. Lien WH, Fuchs E. Wnt some lose some: transcriptional governance of stem cells by Wnt/beta‐catenin signaling. Genes Dev. 2014;28:1517‐1532. [DOI] [PMC free article] [PubMed] [Google Scholar]
- 2. Rhee CS, Sen M, Lu D, et al. Wnt and frizzled receptors as potential targets for immunotherapy in head and neck squamous cell carcinomas. Oncogene. 2002;21:6598‐6605. [DOI] [PubMed] [Google Scholar]
- 3. Lu D, Zhao Y, Tawatao R, et al. Activation of the Wnt signaling pathway in chronic lymphocytic leukemia. Proc Natl Acad Sci USA. 2004;101:3118‐3123. [DOI] [PMC free article] [PubMed] [Google Scholar]
- 4. Siegel R, Ma J, Zou Z, Jemal A. Cancer statistics, 2014. CA Cancer J Clin. 2014;64:9‐29. [DOI] [PubMed] [Google Scholar]
- 5. Chen Y, Peng C, Sullivan C, Li D, Li S. Critical molecular pathways in cancer stem cells of chronic myeloid leukemia. Leukemia. 2010;24:1545‐1554. [DOI] [PMC free article] [PubMed] [Google Scholar]
- 6. Chang G, Zhang H, Wang J, et al. CD44 targets Wnt/beta‐catenin pathway to mediate the proliferation of K562 cells. Cancer Cell Int. 2013;13:117. [DOI] [PMC free article] [PubMed] [Google Scholar]
- 7. Druker BJ, Guilhot F, O'Brien SG, et al. Five‐year follow‐up of patients receiving imatinib for chronic myeloid leukemia. N Engl J Med. 2006;355:2408‐2417. [DOI] [PubMed] [Google Scholar]
- 8. Hu Y, Chen Y, Douglas L, Li S. beta‐Catenin is essential for survival of leukemic stem cells insensitive to kinase inhibition in mice with BCR‐ABL‐induced chronic myeloid leukemia. Leukemia. 2009;23:109‐116. [DOI] [PubMed] [Google Scholar]
- 9. Kleppe M, Levine RL. Targeting beta‐catenin in CML: leukemia stem cells beware!. Cell Stem Cell. 2012;10:351‐353. [DOI] [PubMed] [Google Scholar]
- 10. Heidel FH, Bullinger L, Feng Z, et al. Genetic and pharmacologic inhibition of beta‐catenin targets imatinib‐resistant leukemia stem cells in CML. Cell Stem Cell. 2012;10:412‐424. [DOI] [PMC free article] [PubMed] [Google Scholar]
- 11. Funato Y, Miki H. Redox regulation of Wnt signalling via nucleoredoxin. Free Radic Res. 2010;44:379‐388. [DOI] [PubMed] [Google Scholar]
- 12. Jin T, George Fantus I, Sun J. Wnt and beyond Wnt: multiple mechanisms control the transcriptional property of beta‐catenin. Cell Signal. 2008;20:1697‐1704. [DOI] [PubMed] [Google Scholar]
- 13. Sosa V, Moline T, Somoza R, Paciucci R, Kondoh H, Me LL. Oxidative stress and cancer: an overview. Ageing Res Rev. 2013;12:376‐390. [DOI] [PubMed] [Google Scholar]
- 14. Brady NR, Hamacher‐Brady A, Westerhoff HV, Gottlieb RA. A wave of reactive oxygen species (ROS)‐induced ROS release in a sea of excitable mitochondria. Antioxid Redox Signal. 2006;8:1651‐1665. [DOI] [PubMed] [Google Scholar]
- 15. Kroemer G, Reed JC. Mitochondrial control of cell death. Nat Med. 2000;6:513‐519. [DOI] [PubMed] [Google Scholar]
- 16. Fesik SW. Promoting apoptosis as a strategy for cancer drug discovery. Nat Rev Cancer. 2005;5:876‐885. [DOI] [PubMed] [Google Scholar]
- 17. Yan Z, Zhu Z, Wang J, et al. Synthesis, characterization, and evaluation of a novel inhibitor of WNT/beta‐catenin signaling pathway. Mol Cancer. 2013;12:116. [DOI] [PMC free article] [PubMed] [Google Scholar]
- 18. Ding F, Wang M, Du Y, et al. BHX inhibits the Wnt signaling pathway by suppressing β‐catenin transcription in the nucleus. Sci Rep. 2016;6:38331. [DOI] [PMC free article] [PubMed] [Google Scholar]
- 19. Bao H, Zhang Q, Zhu Z, et al. BHX, a novel pyrazoline derivative, inhibits breast cancer cell invasion by reversing the epithelial‐mesenchymal transition and down‐regulating Wnt/β‐catenin signalling. Sci Rep. 2017;7:9153. [DOI] [PMC free article] [PubMed] [Google Scholar]
- 20. Raghavendran HR, Sathyanath R, Shin J, et al. Panax ginseng modulates cytokines in bone marrow toxicity and myelopoiesis: ginsenoside Rg1 partially supports myelopoiesis. PLoS ONE. 2012;7:e33733. [DOI] [PMC free article] [PubMed] [Google Scholar]
- 21. Liu N, Zang S, Liu Y, et al. FZD7 regulates BMSCs‐mediated protection of CML cells. Oncotarget. 2016;7:6175‐6187. [DOI] [PMC free article] [PubMed] [Google Scholar]
- 22. Zhao C, Blum J, Chen A, et al. Loss of beta‐catenin impairs the renewal of normal and CML stem cells in vivo. Cancer Cell. 2007;12:528‐541. [DOI] [PMC free article] [PubMed] [Google Scholar]
- 23. Jamieson CH, Ailles LE, Dylla SJ, et al. Granulocyte‐macrophage progenitors as candidate leukemic stem cells in blast‐crisis CML. N Engl J Med. 2004;351:657‐667. [DOI] [PubMed] [Google Scholar]
- 24. van de Wetering M, Sancho E, Verweij C, et al. The beta‐catenin/TCF‐4 complex imposes a crypt progenitor phenotype on colorectal cancer cells. Cell. 2002;111:241‐250. [DOI] [PubMed] [Google Scholar]
- 25. Ohishi K, Toume K, Arai MA, Sadhu SK, Ahmed F, Ishibashi M. Coronaridine, an iboga type alkaloid from Tabernaemontana divaricata, inhibits the Wnt signaling pathway by decreasing beta‐catenin mRNA expression. Bioorg Med Chem Lett. 2015;25:3937‐3940. [DOI] [PubMed] [Google Scholar]
- 26. Johnstone RW, Ruefli AA, Lowe SW. Apoptosis: a link between cancer genetics and chemotherapy. Cell. 2002;108:153‐164. [DOI] [PubMed] [Google Scholar]
- 27. Adams JM, Cory S. The Bcl‐2 apoptotic switch in cancer development and therapy. Oncogene. 2007;26:1324‐1337. [DOI] [PMC free article] [PubMed] [Google Scholar]
- 28. Ou HC, Lee WJ, Lee SD, et al. Ellagic acid protects endothelial cells from oxidized low‐density lipoprotein‐induced apoptosis by modulating the PI3K/Akt/eNOS pathway. Toxicol Appl Pharmacol. 2010;248:134‐143. [DOI] [PubMed] [Google Scholar]
- 29. Zamzami N, Marchetti P, Castedo M, et al. Sequential reduction of mitochondrial transmembrane potential and generation of reactive oxygen species in early programmed cell death. J Exp Med. 1995;182:367‐377. [DOI] [PMC free article] [PubMed] [Google Scholar]
- 30. Saelens X, Festjens N, Vande Walle L, van Gurp M, van Loo G, Vandenabeele P. Toxic proteins released from mitochondria in cell death. Oncogene. 2004;23:2861‐2874. [DOI] [PubMed] [Google Scholar]
- 31. Fuentes‐Prior P, Salvesen GS. The protein structures that shape caspase activity, specificity, activation and inhibition. Biochem J. 2004;384:201‐232. [DOI] [PMC free article] [PubMed] [Google Scholar]
- 32. Li J, Yuan J. Caspases in apoptosis and beyond. Oncogene. 2008;27:6194‐6206. [DOI] [PubMed] [Google Scholar]
- 33. Marino G, Niso‐Santano M, Baehrecke EH, Kroemer G. Self‐consumption: the interplay of autophagy and apoptosis. Nat Rev Mol Cell Biol. 2014;15:81‐94. [DOI] [PMC free article] [PubMed] [Google Scholar]
- 34. Wolf BB, Green DR. Suicidal tendencies: apoptotic cell death by caspase family proteinases. J Biol Chem. 1999;274:20049‐20052. [DOI] [PubMed] [Google Scholar]
- 35. Calvino E, Estan MC, Simon GP, et al. Increased apoptotic efficacy of lonidamine plus arsenic trioxide combination in human leukemia cells. Reactive oxygen species generation and defensive protein kinase (MEK/ERK, Akt/mTOR) modulation. Biochem Pharmacol. 2011;82:1619‐1629. [DOI] [PubMed] [Google Scholar]
- 36. Kuilman T, Michaloglou C, Mooi WJ, Peeper DS. The essence of senescence. Genes Dev. 2010;24:2463‐2479. [DOI] [PMC free article] [PubMed] [Google Scholar]
- 37. Fan C, Chen J, Wang Y, et al. Selenocystine potentiates cancer cell apoptosis induced by 5‐fluorouracil by triggering reactive oxygen species‐mediated DNA damage and inactivation of the ERK pathway. Free Radic Biol Med. 2013;65:305‐316. [DOI] [PubMed] [Google Scholar]
- 38. Skulachev VP. Functions of mitochondria: from intracellular power stations to mediators of a senescence program. Cell Mol Life Sci. 2009;66:1785‐1793. [DOI] [PMC free article] [PubMed] [Google Scholar]
- 39. Park J, Lee J, Choi C. Mitochondrial network determines intracellular ROS dynamics and sensitivity to oxidative stress through switching inter‐mitochondrial messengers. PLoS ONE. 2011;6:e23211. [DOI] [PMC free article] [PubMed] [Google Scholar]
- 40. Floridi A, Bruno T, Miccadei S, Fanciulli M, Federico A, Paggi MG. Enhancement of doxorubicin content by the antitumor drug lonidamine in resistant Ehrlich ascites tumor cells through modulation of energy metabolism. Biochem Pharmacol. 1998;56:841‐849. [DOI] [PubMed] [Google Scholar]
- 41. Uzhachenko R, Shanker A, Yarbrough WG, Ivanova AV. Mitochondria, calcium, and tumor suppressor Fus1: at the crossroad of cancer, inflammation, and autoimmunity. Oncotarget. 2015;6:20754‐20772. [DOI] [PMC free article] [PubMed] [Google Scholar]
- 42. Tait SW, Green DR. Mitochondria and cell death: outer membrane permeabilization and beyond. Nat Rev Mol Cell Biol. 2010;11:621‐632. [DOI] [PubMed] [Google Scholar]


