Abstract
Objectives
Steroid‐induced osteonecrosis of the femoral head (ONFH) is a common orthopaedic disease of which early detection remains clinically challenging. Accumulating evidences indicated that circulating microRNAs (miRNAs) plays vital roles in the development of several bone diseases. However, the association between circulating miRNAs and steroid‐induced ONFH remains elusive.
Materials and methods
miRNA microarray was performed to identify the differentially abundant miRNAs in the serums of systemic lupus erythematosus (SLE) patients with steroid‐induced ONFH as compared with SLE control and healthy control group. We predicted the potential functions of these differentially abundant miRNAs using Gene Ontology (GO) and Kyoto Encyclopedia of Genes and Genomes (KEGG) pathway analyses and reconstructed the regulatory networks of miRNA‐mRNA interactions.
Results
Our data indicated that there were 11 differentially abundant miRNAs (2 upregulated and 9 downregulated) between SLE‐ONFH group and healthy control group and 42 differentially abundant miRNAs (14 upregulated and 28 downregulated) between SLE‐ONFH group and SLE control group. We also predicted the potential functions of these differentially abundant miRNAs using Gene Ontology (GO) and Kyoto Encyclopedia of Genes and Genomes (KEGG) pathway analyses and reconstructed the regulatory networks of miRNA‐mRNA interactions.
Conclusions
These findings corroborated the idea that circulating miRNAs play significant roles in the development of ONFH and may serve as diagnostic markers and therapeutic targets.
Keywords: circulating microRNAs, GO, KEGG, ONFH, osteonecrosis of the femoral head
1. INTRODUCTION
Osteonecrosis of the femoral head (ONFH), which can be categorized as traumatic or non‐traumatic, is characterized by progressive osteocyte and bone marrow necrosis as a result of interruption of blood supply to the femoral head, causing the associated structural changes and even collapse.1, 2, 3, 4 ONFH is a common orthopaedic condition, which afflicts more than 20 million of people worldwide.5, 6, 7 The use of corticosteroids alone accounts for approximately 24.1% of all ONFH cases.8, 9 The pathogenesis of steroid‐associated ONFH is poorly understood, in which fat cell hypertrophy, fat embolization, intravascular coagulation and osteocyte apoptosis are believed to play significant role in the pathogenesis.9, 10, 11 Several studies have shown that only a subset of patients would develop ONFH within a few weeks of steroid therapy, suggesting that genetic factors might dictate the susceptibility to steroid‐associated ONFH.12, 13, 14 Nevertheless, early detection of steroid‐associated ONFH remains clinically challenging. Therefore, it is pivotal to identify biomarkers for early non‐invasive diagnosis of this disabling condition.
MicroRNAs (miRNAs) are a group of non‐coding, endogenous, small RNAs of ~23 nucleotides in length.15, 16, 17, 18 miRNAs are highly evolutionarily conserved and their expression is tissue‐specific.19, 20 They play vital roles in different physiological and pathological processes via regulating gene expression post‐transcriptionally.21, 22, 23 Aberrant expression of miRNAs has been documented in the different orthopaedic conditions, such as intervertebral disc degeneration, osteoarthritis, osteoporosis and osteosarcoma.24, 25, 26, 27 Several recent studies also suggested that miRNAs might take part in the development of ONFH.28, 29, 30 To date, alterations in circulating miRNAs in steroid‐associated ONFH remain largely unknown.
In this study, we profiled differentially abundant miRNAs in serums of systemic lupus erythematosus (SLE) patients with steroid‐associated ONFH as compared with SLE and healthy controls. We further inferred the potential functions of these differentially abundant miRNAs by Gene Ontology (GO) and Kyoto Encyclopedia of Genes and Genomes (KEGG) pathway analyses to reconstruct the regulatory networks among the deregulated miRNAs and their target mRNAs.
2. MATERIALS AND METHODS
2.1. Serum collection
Blood samples were collected from 3 patients with ONFH secondary to application of corticosteroids for the treatment of SLE. Three SLE patients that underwent similar corticosteroid treatment but without ONFH together with 3 matched healthy subjects were used as controls. Subject information is provided in Table S1. This study had been approved by the Clinical Research Ethics Committee of the Peking Union Medical College Hospital (PUMCH) with a fully informed written consent obtained from each participated patient. Serum was separated from the blood sample immediately after blood collection and was stored at −80°C.
2.2. RNA extraction
Total RNA from the serum was extracted using the MiRNeasy Mini kit (217004; Qiagen, Hilden, Germany) according to the manufacturers’ instructions. Total RNA was dissolved in 300 μL elution buffers and measured by the NanoDrop 2000 (Thermo Fisher Scientific, Waltham, MA, USA). The total RNA was concentrated following centrifugation.
2.3. MicroRNA microarray
Affymetrix microRNA 4.0 array was performed to analyse serum microRNAs according to the manufacturer's instructions. For each sample, a total of 100 ng of RNA was dephosphorylated, the 3′‐end labelled with the Cy3‐pCp, purified, dried and hybridized to the array. Average values of the replicate spots of each miRNA were background subtracted, normalized and subject to further analysis. The expressed result was normalized by using median normalization assay, after which differentially expressed miRNA was identified through the volcano plot filtering. Hierarchical clustering was performed by using MEV software. Normalization was performed using the signal of U6 small nuclear RNA on the chip.
2.4. KEGG pathway and Go annotation analyses
Kyoto Encyclopedia of Genes and Genomes pathways and GO annotations were used to infer the functional roles of differentially abundant circulating miRNAs. KEGG pathway analysis was applied to identify the significant signalling pathways (http://www.genome.jp/kegg/). GO analysis was performed to determine genetic regulatory networks of interest through forming hierarchical categories in BP (biological process), CC (cellular component) and MF (molecular function) fields (http://www.geneontology.org).
2.5. Analysis of miRNA regulatory network
To delineate the role and interactions among miRNAs and mRNAs in steroid‐associated ONFH pathogenesis, we constructed a miRNA regulatory network. The interaction network was established and visually displayed using the Cytoscape software. miRNA‐mRNA interactions were predicted with the miRNA and PsRobot software.
2.6. Statistical analysis
Results were presented as the mean ± SD (standard deviation). The difference between 2 groups was analysed by Student's t test. One‐way or two‐way analysis of variance (ANOVA) was performed to measure the significant difference between 3 or more groups. P < .05 was considered to be statistically significant.
3. RESULTS
3.1. Differentially abundant miRNAs in serums of SLE‐ONFH patients
To investigate if circulating miRNAs could be used to differentiate steroid‐associated SLE‐ONFH patients from SLE and healthy controls, microRNA microarray was performed. We analysed differentially abundant miRNAs by the significance analysis of microarrays (SAM) method with the Cuffdiff software following the criteria of q < 0.05. Differentially abundant miRNAs between different groups were visualized using heatmap and Volcano plot. Serum miRNAs with increased or decreased levels in the SLE‐ONFH group compared with SLE or healthy controls are listed in Tables 1, 2, 3, respectively. All differentially abundant miRNAs are shown in Figure 1A as a heatmap. Figure 1B shows the heatmap of differentially abundant miRNAs between the SLE‐ONFH group and healthy control group, while Figure 1C shows the heatmap of differentially abundant miRNAs between SLE‐ONFH group and the SLE control group. The heatmap of differentially abundant miRNAs between the SLE and healthy control groups was shown in Figure 1D. Figure 2 shows volcano plots, which depict significance vs fold change on the y‐ and x‐axes, respectively, of differentially abundant miRNAs between groups. Details of differentially abundant miRNAs are as follows: 11 differentially abundant miRNAs (2 upregulated and 9 downregulated), 42 differentially abundant miRNAs (14 upregulated and 28 downregulated) and 9 differentially abundant miRNAs (1 upregulated and 8 downregulated) between SLE‐ONFH group and healthy control group, SLE‐ONFH group and SLE control group, and SLE control group and healthy control group, respectively. In particular, we observed consistent increased levels ofmiR‐4440 and decreased levels of 6 miRNAs, namely miR‐6787‐5p, 6717‐5p, miR‐500a‐3p, miR‐130a‐3p, miR‐3663‐3p and miR‐222‐3p, in SLE‐ONFH patients as compared with both control groups.
Table 1.
Differentially abundant circulating miRNAs in SLE‐ONFH patients as compared with healthy controls
| Gene ID | Gene name | Gene location | log2 (fold change) | P‐value | Deregulation |
|---|---|---|---|---|---|
| MIMAT0018958 | hsa‐miR‐4440 | chr2:239990525‐239990546 (−) | 1.646161 | .004331 | Up |
| MIMAT0027526 | hsa‐miR‐6813‐5p | chr20:62708336‐62708358 (−) | 1.770415 | .033599 | Up |
| MIMAT0027474 | hsa‐miR‐6787‐5p | chr17:80194549‐80194570 (+) | −3.8425 | .002981 | Down |
| MIMAT0003274 | hsa‐miR‐606 | chr10:77312276‐77312296 (+) | −1.21348 | .009628 | Down |
| MIMAT0000077 | hsa‐miR‐22‐3p | chr17:1617208‐1617229 (−) | −1.22175 | .026513 | Down |
| MIMAT0025846 | hsa‐miR‐6717‐5p | chr14:21491514‐21491535 (−) | −1.88701 | .028749 | Down |
| MIMAT0002871 | hsa‐miR‐500a‐3p | chrX:49773090‐49773111 (+) | −1.0331 | .032831 | Down |
| MIMAT0000425 | hsa‐miR‐130a‐3p | chr11:57408725‐57408746 (+) | −2.12937 | .038925 | Down |
| MIMAT0018085 | hsa‐miR‐3663‐3p | chr10:118927206‐118927228 (−) | −1.34975 | .043827 | Down |
| MIMAT0000279 | hsa‐miR‐222‐3p | chrX:45606442‐45606462 (−) | −1.84502 | .044527 | Down |
| MIMAT0000762 | hsa‐miR‐324‐3p | chr17:7126627‐7126646 (−) | −1.28867 | .048921 | Down |
Table 2.
Differentially abundant circulating miRNAs in SLE‐ONFH patients as compared with SLE controls
| Gene ID | Gene name | Gene location | log2 (fold change) | P‐value | Deregulation |
|---|---|---|---|---|---|
| MIMAT0004949 | hsa‐miR‐877‐5p | chr6:30552109‐30552128 (+) | 1.403665 | .000171 | Up |
| MIMAT0005939 | hsa‐miR‐1281 | chr22:41488549‐41488565 (+) | 1.88578 | .002078 | Up |
| MIMAT0018958 | hsa‐miR‐4440 | chr2:239990525‐239990546 (−) | 2.089196 | .002646 | Up |
| MIMAT0019069 | hsa‐miR‐4530 | chr19:39900269‐39900286 (−) | 1.695803 | .004219 | Up |
| MIMAT0019021 | hsa‐miR‐4487 | chr11:47422574‐47422592 (+) | 1.955596 | .006841 | Up |
| MIMAT0019027 | hsa‐miR‐4492 | chr11:118781474‐118781490 (+) | 1.361523 | .009779 | Up |
| MIMAT0006765 | hsa‐miR‐1825 | chr20:30825633‐30825650 (+) | 1.013609 | .012637 | Up |
| MIMAT0019044 | hsa‐miR‐4507 | chr14:106324294‐106324313 (−) | 1.221411 | .013724 | Up |
| MIMAT0026641 | hsa‐miR‐1298‐3p | chrX:113949721‐113949741 (+) | 1.697628 | .01588 | Up |
| MIMAT0027655 | hsa‐miR‐6877‐3p | chr9:135927422‐135927442 (+) | 2.656321 | .016403 | Up |
| MIMAT0009447 | hsa‐miR‐1972 | chr16:15104186‐15104207 (−) /// chr16:70064296‐70064317 (+) | 1.539704 | .01892 | Up |
| MIMAT0003239 | hsa‐miR‐574‐3p | chr4:38869713‐38869734 (+) | 1.907779 | .039479 | Up |
| MIMAT0017990 | hsa‐miR‐3613‐5p | chr13:50570601‐50570622 (−) | 2.193916 | .045219 | Up |
| MIMAT0021021 | hsa‐miR‐5001‐5p | chr2:233415240‐233415263 (−) | 1.758833 | .047778 | Up |
| MIMAT0027474 | hsa‐miR‐6787‐5p | chr17:80194549‐80194570 (+) | −3.6371 | .000723 | Down |
| MIMAT0030422 | hsa‐miR‐7847‐3p | chr11:1901335‐1901355 (+) | −1.11224 | .002968 | Down |
| MIMAT0002871 | hsa‐miR‐500a‐3p | chrX:49773090‐49773111 (+) | −1.46197 | .006979 | Down |
| MIMAT0000455 | hsa‐miR‐185‐5p | chr22:20020676‐20020697 (+) | −1.73268 | .011071 | Down |
| MIMAT0018936 | hsa‐miR‐4423‐3p | chr1:85599525‐85599545 (+) | −1.25316 | .012616 | Down |
| MIMAT0000279 | hsa‐miR‐222‐3p | chrX:45606442‐45606462 (−) | −2.34661 | .013065 | Down |
| MIMAT0016858 | hsa‐miR‐4306 | chr13:100295377‐100295393 (+) | −1.91896 | .017459 | Down |
| MIMAT0000691 | hsa‐miR‐130b‐3p | chr22:22007643‐22007664 (+) | −1.9629 | .018315 | Down |
| MIMAT0000425 | hsa‐miR‐130a‐3p | chr11:57408725‐57408746 (+) | −2.4702 | .018528 | Down |
| MIMAT0018085 | hsa‐miR‐3663‐3p | chr10:118927206‐118927228 (−) | −1.57788 | .01914 | Down |
| MIMAT0000765 | hsa‐miR‐335‐5p | chr7:130135967‐130135989 (+) | −1.12202 | .01966 | Down |
| MIMAT0000078 | hsa‐miR‐23a‐3p | chr19:13947409‐13947429 (−) | −3.85085 | .019784 | Down |
| MIMAT0025846 | hsa‐miR‐6717‐5p | chr14:21491514‐21491535 (−) | −1.95966 | .020968 | Down |
| MIMAT0000080 | hsa‐miR‐24‐3p | chr19:13947103‐13947124 (−) /// chr9:97848346‐97848367 (+) | −4.1226 | .022312 | Down |
| MIMAT0014991 | hsa‐miR‐3128 | chr2:178120712‐178120734 (−) | −2.19444 | .02537 | Down |
| MIMAT0004775 | hsa‐miR‐502‐3p | chrX:49779257‐49779278 (+) | −1.00727 | .026379 | Down |
| MIMAT0000104 | hsa‐miR‐107 | chr10:91352513‐91352535 (−) | −2.41354 | .031698 | Down |
| MIMAT0000101 | hsa‐miR‐103a‐3p | chr20:3898188‐3898210 (+) /// chr5:167987909‐167987931 (−) | −2.07257 | .034555 | Down |
| MIMAT0000418 | hsa‐miR‐23b‐3p | chr9:97847547‐97847567 (+) | −2.86383 | .036149 | Down |
| MIMAT0018976 | hsa‐miR‐4454 | chr4:164014759‐164014778 (−) | −2.35459 | .040317 | Down |
| MIMAT0000278 | hsa‐miR‐221‐3p | chrX:45605608‐45605630 (−) | −3.00149 | .04083 | Down |
| MIMAT0000075 | hsa‐miR‐20a‐5p | chr13:92003326‐92003348 (+) | −2.01992 | .040896 | Down |
| MIMAT0000449 | hsa‐miR‐146a‐5p | chr5:159912379‐159912400 (+) | −2.68623 | .042199 | Down |
| MIMAT0031011 | hsa‐miR‐8084 | chr8:94041989‐94042011 (+) | −2.57342 | .042858 | Down |
| MIMAT0000256 | hsa‐miR‐181a‐5p | chr1:198828237‐198828259 (−) /// chr9:127454759‐127454781 (+) | −2.4832 | .043138 | Down |
| MIMAT0004945 | hsa‐miR‐744‐5p | chr17:11985226‐11985247 (+) | −2.12729 | .04388 | Down |
| MIMAT0000440 | hsa‐miR‐191‐5p | chr3:49058105‐49058127 (−) | −2.6033 | .046884 | Down |
| MIMAT0000082 | hsa‐miR‐26a‐5p | chr12:58218441‐58218462 (−) /// chr3:38010904‐38010925 (+) | −2.99502 | .047823 | Down |
Table 3.
Differentially abundant circulating miRNAs in SLE controls as compared with healthy controls
| Gene ID | Gene name | Gene location | log2 (fold change) | P‐value | Deregulation |
|---|---|---|---|---|---|
| MIMAT0027526 | hsa‐miR‐6813‐5p | chr20:62708336‐62708358 (−) | 1.692362 | .047435 | Up |
| MIMAT0015072 | hsa‐miR‐320e | chr19:47212551‐47212568 (−) | −2.03805 | .001062 | Down |
| MIMAT0018352 | hsa‐miR‐3937 | chrX:39520530‐39520552 (+) | −1.18781 | .012754 | Down |
| MIMAT0005929 | hsa‐miR‐1275 | chr6:33967795‐33967811 (−) | −1.10311 | .019332 | Down |
| MIMAT0003251 | hsa‐miR‐548a‐3p | chr6:18572075‐18572096 (+) /// chr6:135560358‐135560379 (+) /// chr8:105496612‐105496633 (−) | −1.2154 | .021813 | Down |
| MIMAT0027454 | hsa‐miR‐6777‐5p | chr17:17716832‐17716854 (−) | −1.33424 | .024055 | Down |
| MIMAT0015081 | hsa‐miR‐548x‐3p | chr13:66540484‐66540503 (−) /// chr21:20058418‐20058437 (−) | −1.34711 | .036122 | Down |
| MIMAT0027393 | hsa‐miR‐6746‐3p | chr11:61645688‐61645709 (−) | −1.03827 | .04293 | Down |
| MIMAT0028117 | hsa‐miR‐7110‐5p | chr3:122880646‐122880666 (+) | −1.6558 | .049989 | Down |
Figure 1.
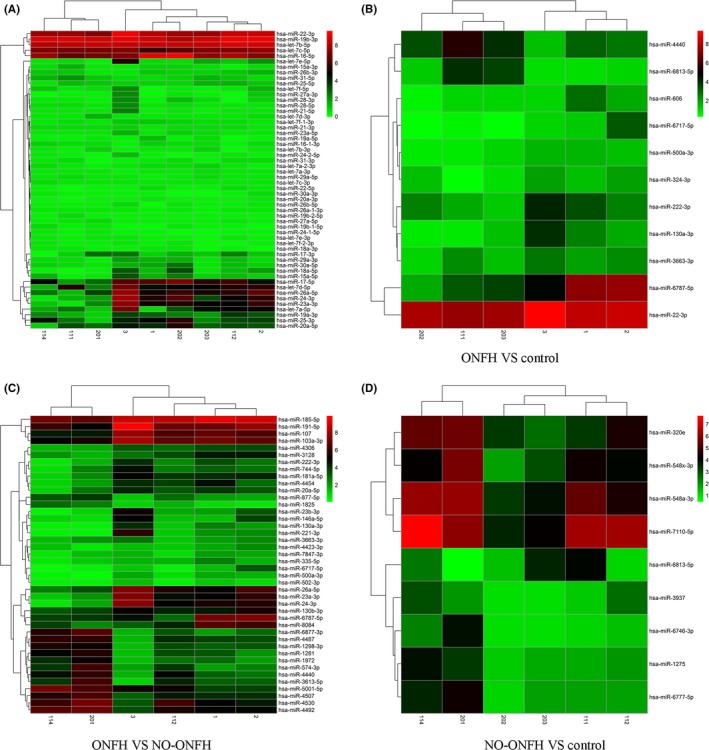
Differentially abundant miRNAs in serums of SLE‐ONFH patients. A, A heatmap representation of all differentially abundant miRNAs is shown. B, A heatmap of differentially abundant miRNAs between the SLE‐ONFH group and healthy control group. C, A heatmap of differentially abundant miRNAs between SLE‐ONFH group and the SLE control group. D, The heatmap of differentially abundant miRNAs between the SLE and healthy control groups was shown. 1, 2 and 3 denote samples in the SLE‐ONFH group; 112, 114 and 201 denote samples in the SLE control group; 111, 202 and 203 denote healthy control samples
Figure 2.
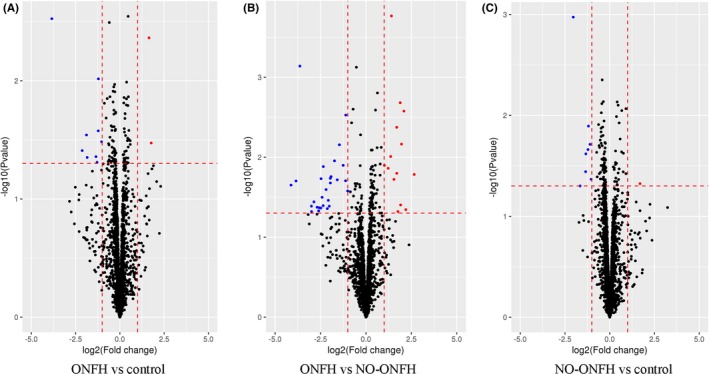
Volcano plots of differentially abundant miRNAs in serums of ONFH patients. A, Volcano plots showing differentially abundant miRNAs between the SLE‐ONFH group and healthy control group. B, Volcano plots showing differentially abundant miRNAs between SLE‐ONFH group and the SLE control group. C, Volcano plots showing differentially abundant miRNAs between the SLE and healthy control groups. Blue and red dots indicate downregulated and upregulated miRNAs, respectively
3.2. Functional prediction of differentially abundant miRNAs in ONFH
To infer the biological functions of differentially abundant circulating miRNAs in the pathogenesis of ONFH, genes with absolute value of correlation of>0.95 were chosen to predict the function of miRNAs by using the GO and KEGG pathway assay. GO is the standard classification system of gene function, whereas directed acyclic graph (DAG) is a graphical display of differentially expressed GO enrichment results. The branch shows the relationship of the inclusion, which indicates the scope from top to bottom. The top data of GO enrichment were selected as the master node of DAG and were shown together through GO term by including the relationship. Systematic GO terms are shown together, where the colour depth represents the enrichment degree. The DAGs of the BP, CC and MF, whose GO enrichment by the colocalization and co‐expression of genes of differentially abundant miRNAs, are shown in Figures 3A‐G between SLE‐ONFH group and healthy control group. The DAGs of BP, CC and MF, whose GO enrichment through target genes of differentially abundant miRNAs between SLE‐ONFH group and SLE group, are shown in Figure 4A‐G. Figure 5A‐G shows the DAG of BP, CC and MF, all of which GO enrichment analysis through target genes of differentially expressed miRNAs between SLE group and healthy control group. In particular, SNARE complex that consists of a large protein superfamily involved in vesicle fusion and transport was significantly enriched in the SLE‐ONFH groups as compared with both control groups.
Figure 3.
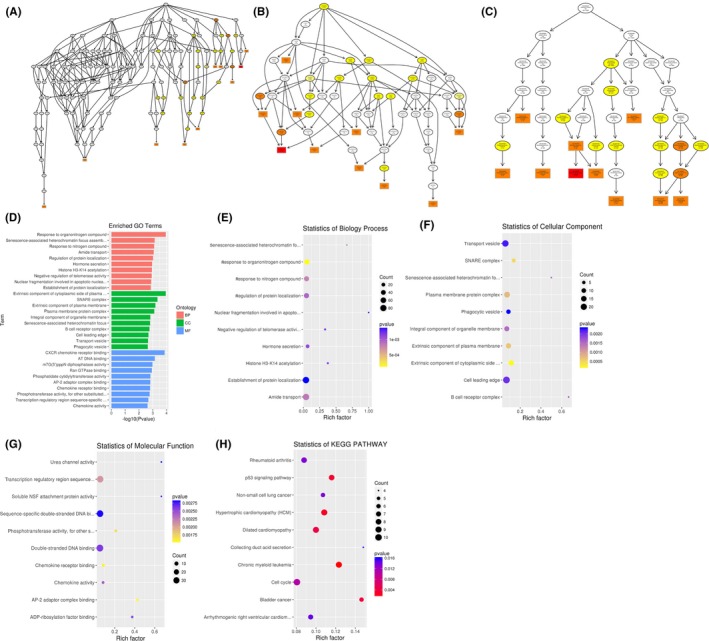
Functional predictions of differentially abundant miRNAs in SLE‐ONFH vs healthy control. A‐C, Molecular functions, biological processes and cellular components were predicted to be altered by mRNAs targeted by differentially abundant miRNAs in ONFH. Directed Acyclic Graph (DAG) is the graphical display of GO enrichment results with candidate target genes. D, The number of genes in GO term was shown in histograph. E‐G, Enriched biological processes, cellular components and molecular functions in ONFH were shown. H, Scatterplot of enriched KEGG pathway showing statistics of pathway enrichment in ONFH
Figure 4.
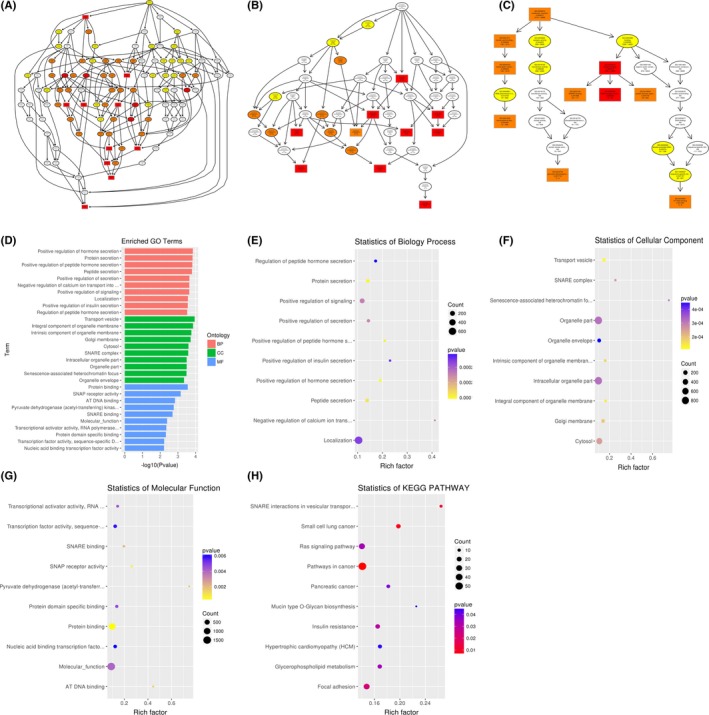
Functional predictions of differentially abundant miRNAs in SLE‐ONFH vs SLE control. A‐C, Molecular functions, biological processes and cellular components were predicted to be altered by mRNAs targeted by differentially abundant miRNAs in ONFH. Directed Acyclic Graph (DAG) is the graphical display of GO enrichment results with candidate target genes. D, The number of genes in GO term was shown in histograph. E‐G, Enriched biological processes, cellular components and molecular functions in ONFH were shown. H, Scatterplot of enriched KEGG pathway showing statistics of pathway enrichment in ONFH
Figure 5.
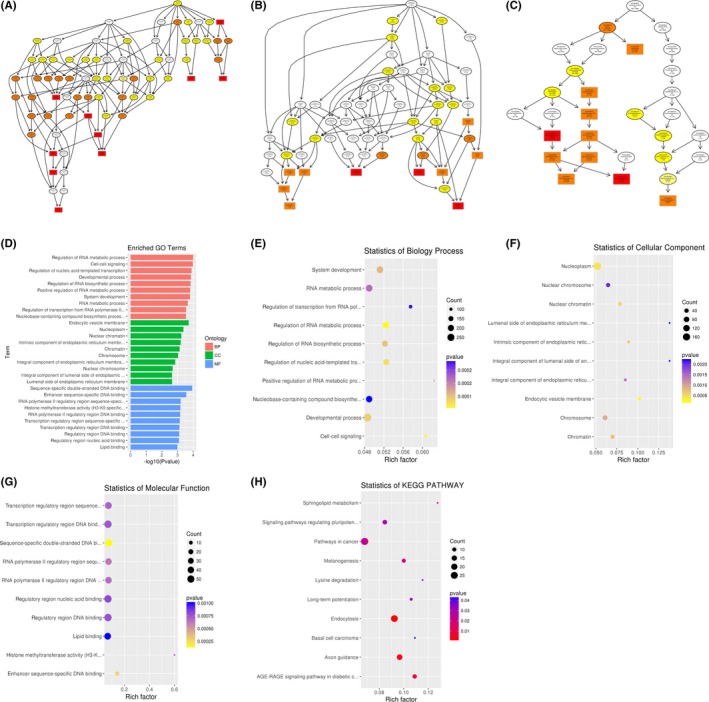
Functional predictions of differentially abundant miRNAs in SLE vs healthy controls. A‐C, Molecular functions, biological processes and cellular components were predicted to be altered by mRNAs targeted by differentially abundant miRNAs in SLE. Directed Acyclic Graph (DAG) is the graphical display of GO enrichment results with candidate target genes. D, The number of genes in GO term was shown in histograph. E‐G, Enriched biological processes, cellular components and molecular functions were shown. H, Scatterplot of enriched KEGG pathway showing statistics of pathway enrichment in SLE
Different genes interact with each other to exert their biological functions in the tissue. The main signal transduction pathways and biochemical pathways engaged by candidate target genes can be identified by pathway enrichment analysis. KEGG is a major public database of cellular signalling pathways. KEGG pathway was adopted as a unit, and when using the hyper‐geometric test, and significantly enriched pathways engaged by candidate target genes compared with the entire genome background can be identified. Herein, we combined KEGG analysis with intersection of co‐expression and co‐localization of genes of differentially abundant miRNAs, target genes of differentially expressed miRNAs and predicted mRNAs; the most significantly involved pathways in ONFH pathogenesis were shown in Panel H of Figures 3, 4, 5 for comparison between SLE‐ONFH group and control group (Figure 3H), SLE‐ONFH group and SLE control group (Figure 4H), and SLE control group and healthy control group (Figure 5H). In particular, hypertrophic cardiomyopathy was significantly enriched in the SLE‐ONFH groups as compared with both control groups, suggesting that hypertrophic cardiomyopathy and steroid‐associated ONFN might share an overlapped molecular pathogenic pathway.
3.3. Regulatory network of miRNAs and mRNAs
To analyse the molecular mechanism of the differentially abundant miRNAs in ONFH pathogenesis, we constructed the regulatory network of the involved miRNAs and the predicted target mRNAs. Figure 6 shows miRNA‐mRNA regulatory network, involving deregulated (down/up) miRNAs and their deregulated target genes (fold change: >2.0; P ≤ .05) between SLE‐ONFH group and healthy control group. Figures 7 and 8 show miRNA‐mRNA regulatory network, involving deregulated (down/up) miRNAs and their deregulated target genes (fold change: >2.0; P ≤ .05) between SLE‐ONFH group and SLE control group and between SLE control group and healthy control group, respectively. These data explained the regulatory relationship between miRNA and mRNA in the pathogenesis of steroid‐associated ONFH.
Figure 6.
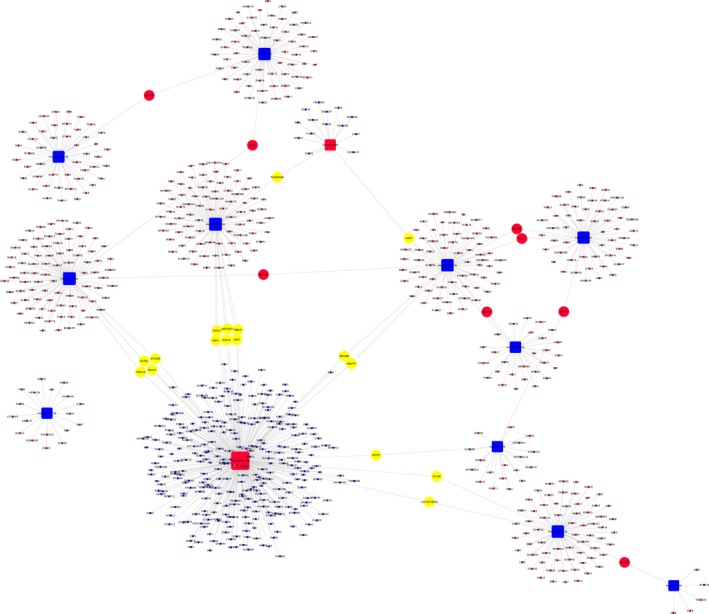
Regulatory networks of miRNAs and mRNAs between SLE‐ONFH group and healthy control group
Figure 7.
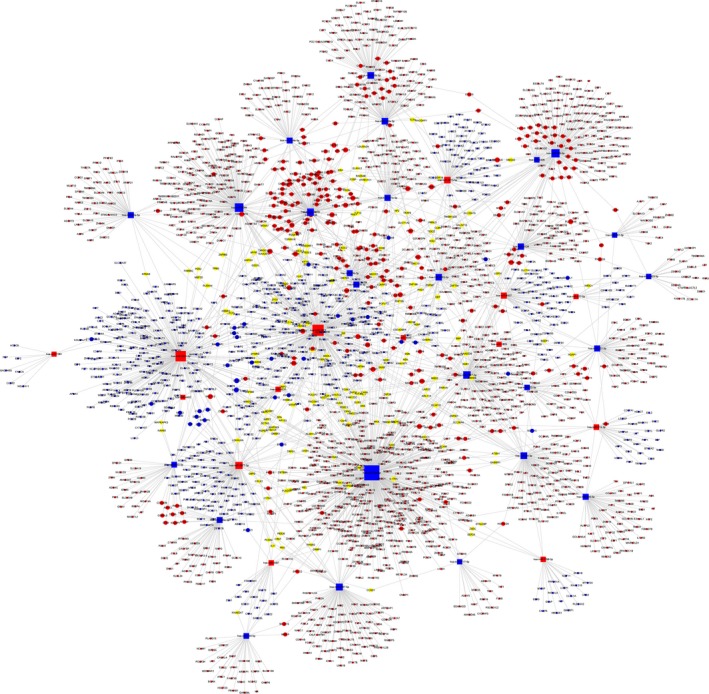
Regulatory networks of miRNAs and mRNAs between SLE‐ONFH group and the SLE control group
Figure 8.
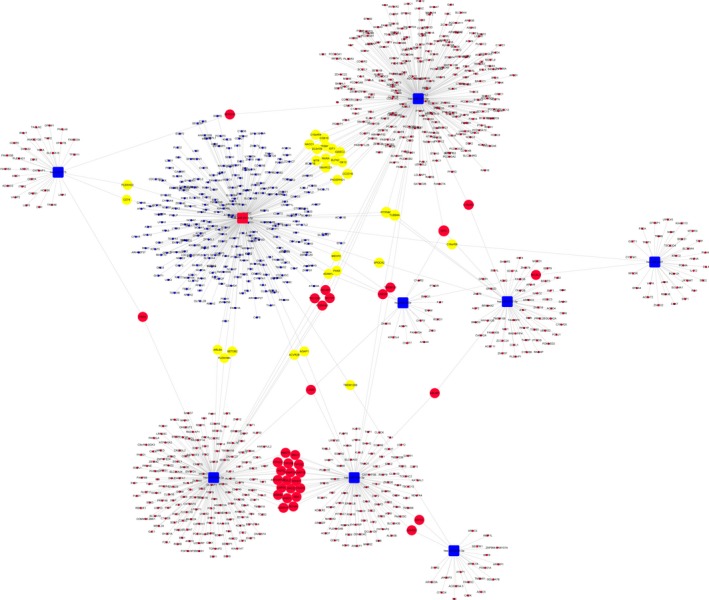
Regulatory networks of miRNAs and mRNAs between SLE and healthy control groups
4. DISCUSSION
Multiple lines of evidences have suggested that miRNAs could play active and crucial roles in the development of ONFH.8, 31, 32, 33, 34 In this study, we performed miRNA microarray to identify the differentially abundant miRNAs in the serums of SLE patients with steroid‐induced ONFH as compared with SLE control and healthy control groups. Our data indicated that miR‐4440 was commonly increased, while miR‐6787‐5p, 6717‐5p, miR‐500a‐3p, miR‐130a‐3p, miR‐3663‐3p and miR‐222‐3p were consistently decreased in SLE‐ONFH patients as compared with both control groups. We also predicted the potential functions of differentially abundant miRNAs using GO and KEGG pathway analyses and reconstructed the regulatory networks of miRNA‐mRNA interactions. These findings corroborated the idea that miRNAs play significant roles in the development of ONFH and may serve as diagnostic markers and therapeutic targets.
Previous studies indicated that miRNAs played important roles in the development of ONFH. For example, Wu et al32 used the miRNA microarray to investigate miRNA expression in the femoral head from cases with ONFH and femoral neck fracture. Their data revealed that 17 miRNAs were downregulated while 22 miRNAs were upregulated. Wei et al35 used miRNA microarray to profile miRNA expression in the serum of hormone non‐traumatic ONFH and the serum of healthy volunteers. There were 3 miRNAs downregulated and 9 miRNAs upregulated in the hormone non‐traumatic ONFH group compared with healthy control. Our previous study also showed that there were 27 miRNAs deregulated in the steroid‐induced ONFH patients. Some miRNAs were involved in the modulation of cell differentiation, proliferation and apoptosis of stem cells. However, miRNAs deregulated in these studies were not consistent.
In this study, we found that there were 11 differentially abundant miRNAs (2 upregulated, miR‐4440 and miR‐6813‐5p; and 9 downregulated: miR‐6787‐5p, miR‐606, miR‐22‐3p, miR‐6717‐5p, miR‐500a‐3p, miR‐130a‐3p, miR‐3663‐3p, miR‐222‐3p and miR‐324‐3p) between ONFH group and healthy control group. Forty‐two differentially abundant miRNAs (14 upregulated and 28 downregulated) were found between ONFH group and SLE control group. These microarray results offered a starting point for explaining the potential roles of miRNAs in the ONFH. Among these differentially abundant miRNAs identified in study, the consistently deregulated miRNAs, namely miR‐4440, miR‐6787‐5p, 6717‐5p, miR‐500a‐3p, miR‐130a‐3p, miR‐3663‐3p and miR‐222‐3p, might be key regulators for non‐traumatic steroid‐induced ONFH.
Although we identified the differentially abundant miRNAs in steroid‐induced ONFH, the mechanism underlying such alterations is still poorly understood. The GO is a powerful bioinformatic tool, which unifies the representation of genes and their attributes across all species.36, 37, 38 GO annotations and GO terms were good predictors for function and trend of gene.39, 40 KEGG pathway databases conserved the higher useful order functional information for systematic assignment of gene functions and were widely used in the enrichment analysis.38, 41, 42 Thus, we determined the miRNA‐related functions and the relevance of corresponding pathways in the steroid‐associated ONFH with KEGG term and GO enrichment analyses in this study. Our results showed that the most involved pathways in ONFH pathogenesis were signalling pathways regulating pluripotential cell, endocytosis and axon guidance. We also found that SNARE complex plays a key role in vesicle transport and fusion was significantly enriched. In this connection, vesicle trafficking is fundamental to the normal functions of osteoclasts and osteoblasts in bone remodelling and homeostasis [43]. However, the function and mechanisms of miRNAs as predicted by KEGG and GO analyses should be experimentally verified and studied in‐depth in the future work. The molecular mechanism underlying the interaction of miRNAs and mRNAs in ONFH remains largely unclear. Therefore, for the first time, the miRNA‐mRNA network of ONFH was reconstructed based on our second sequencing data. These pioneering discoveries might enrich our understanding on the mechanisms underlying the role of miRNAs in ONFH pathogenesis.
In conclusion, our study indicated that several miRNAs were differentially abundant in the serums of steroid‐induced ONFH with SLE, as compared with SLE patients without ONFH and healthy subjects. Our bioinformatic analyses also predicted the signalling pathways and target genes of these miRNAs, which may provide potential understanding of the involvement of miRNAs in the initiation and development of ONFH. These data may provide new targets for the early diagnosis and treatment of ONFH. However, large‐scale validation studies in different populations are still required to fully realize the potential of circulating miRNAs as diagnostic markers for ONFH.
Supporting information
Li Z, Jiang C, Li X, et al. Circulating microRNA signature of steroid‐induced osteonecrosis of the femoral head. Cell Prolif. 2018;51:e12418 10.1111/cpr.12418
Funding
National Natural Science Foundation of China (NSFC), Grant/Award Number: 81572110 and 81171775.
Zheng Li, Chao Jiang, Xingye Li and William K.K. Wu contributed equally to this work.
REFERENCES
- 1. Adesina OO, Brunson AM, Gotlib JR, Keegan T, Wun T. Osteonecrosis of the femoral head in sickle cell disease: prevalence, comorbidities and surgical outcomes in California. Blood. 2016;128:22. [DOI] [PMC free article] [PubMed] [Google Scholar]
- 2. Liu XL, Li Q, Sheng JG, et al. Unique plasma metabolomic signature of osteonecrosis of the femoral head. J Orthop Res. 2016;34:1158‐1167. [DOI] [PubMed] [Google Scholar]
- 3. Kuroda Y, Asada R, So K, et al. A pilot study of regenerative therapy using controlled release of recombinant human fibroblast growth factor for patients with pre‐collapse osteonecrosis of the femoral head. Int Orthop. 2016;40:1747‐1754. [DOI] [PubMed] [Google Scholar]
- 4. Okura T, Hasegawa Y, Morita D, Osawa Y, Ishiguro N. What factors predict the failure of curved intertrochanteric varus osteotomy for the osteonecrosis of the femoral head? Arch Orthop Trauma Surg. 2016;136:1647‐1655. [DOI] [PubMed] [Google Scholar]
- 5. Kubo T, Ueshima K, Saito M, Ishida M, Arai Y, Fujiwara H. Clinical and basic research on steroid‐induced osteonecrosis of the femoral head in Japan. J Orthop Sci. 2016;21:407‐413. [DOI] [PubMed] [Google Scholar]
- 6. Tsai SW, Wu PK, Chen CF, et al. Etiologies and outcome of osteonecrosis of the femoral head: etiology and outcome study in a Taiwan population. J Chin Med Assoc. 2016;79:39‐45. [DOI] [PubMed] [Google Scholar]
- 7. Yuan HF, Zhang J, Guo CA, Yan ZQ. Clinical outcomes of osteonecrosis of the femoral head after autologous bone marrow stem cell implantation: a meta‐analysis of seven case‐control studies. Clinics. 2016;71:110‐113. [DOI] [PMC free article] [PubMed] [Google Scholar]
- 8. Yuan HF, Christina V, Guo CA, Chu YW, Liu RH, Yan ZQ. Involvement of MicroRNA‐210 demethylation in steroid‐associated osteonecrosis of the femoral head. Sci Rep. 2016;6:20046. [DOI] [PMC free article] [PubMed] [Google Scholar]
- 9. Houdek MT, Wyles CC, Packard BD, Terzic A, Behfar A, Sierra RJ. Decreased osteogenic activity of mesenchymal stem cells in patients with corticosteroid‐induced osteonecrosis of the femoral head. J Arthroplasty. 2016;31:893‐898. [DOI] [PubMed] [Google Scholar]
- 10. Yu ZF, Fan LH, Li J, Ge ZG, Dang XQ, Wang KZ. Lithium prevents rat steroid‐related osteonecrosis of the femoral head by beta‐catenin activation. Endocrine. 2016;52:380‐390. [DOI] [PubMed] [Google Scholar]
- 11. Zhang YL, Yin JH, Ding H, Zhang CQ, Gao YS. Vitamin K‐2 ameliorates damage of blood vessels by glucocorticoid: a potential mechanism for its protective effects in glucocorticoid‐induced osteonecrosis of the femoral head in a rat model. Int J Biol Sci. 2016;12:776‐785. [DOI] [PMC free article] [PubMed] [Google Scholar]
- 12. Du JL, Liu WL, Jin TB, et al. A single‐nucleotide polymorphism in MMP9 is associated with decreased risk of steroid‐induced osteonecrosis of the femoral head. Oncotarget. 2016;7:68434‐68441. [DOI] [PMC free article] [PubMed] [Google Scholar]
- 13. Han N, Li ZC, Cai ZD, Yan ZQ, Hua YQ, Xu C. P‐glycoprotein overexpression in bone marrow‐derived multipotent stromal cells decreases the risk of steroid‐induced osteonecrosis in the femoral head. J Cell Mol Med. 2016;20:2173‐2182. [DOI] [PMC free article] [PubMed] [Google Scholar]
- 14. Du JL, Jin TB, Cao YJ, et al. Association between genetic polymorphisms of MMP8 and the risk of steroid‐induced osteonecrosis of the femoral head in the population of northern China. Medicine. 2016;95:e4794. [DOI] [PMC free article] [PubMed] [Google Scholar]
- 15. Li Z, Yu X, Shen JX. Long non‐coding RNAs: emerging players in osteosarcoma. Tumor Biol. 2016;37:2811‐2816. [DOI] [PubMed] [Google Scholar]
- 16. Li Z, Yu X, Shen J, Wu WK, Chan MT. MicroRNA expression and its clinical implications in Ewing's sarcoma. Cell Prolif. 2015;48:1‐6. [DOI] [PMC free article] [PubMed] [Google Scholar]
- 17. Huang K, Dong X, Sui C, et al. MiR‐223 suppresses endometrial carcinoma cells proliferation by targeting IGF‐1R. Am J Transl Res. 2014;6:841‐849. [PMC free article] [PubMed] [Google Scholar]
- 18. He PH, Zhang ZJ, Huang GX, et al. miR‐141 modulates osteoblastic cell proliferation by regulating the target gene of lncRNA H19 and lncRNA H19‐derived miR‐675. Am J Transl Res. 2016;8:1780‐1788. [PMC free article] [PubMed] [Google Scholar]
- 19. Liu F, Wang X, Li J, et al. miR‐34c‐3p functions as a tumour suppressor by inhibiting eIF4E expression in non‐small cell lung cancer. Cell Prolif. 2015;48:582‐592. [DOI] [PMC free article] [PubMed] [Google Scholar]
- 20. Shan TD, Ouyang H, Yu T, et al. miRNA‐30e regulates abnormal differentiation of small intestinal epithelial cells in diabetic mice by downregulating Dll4 expression. Cell Prolif. 2016;49:102‐114. [DOI] [PMC free article] [PubMed] [Google Scholar]
- 21. Li Z, Yu X, Shen J, Chan MT, Wu WK. MicroRNA in intervertebral disc degeneration. Cell Prolif. 2015;48:278‐283 [DOI] [PMC free article] [PubMed] [Google Scholar]
- 22. Wang Y, Jia LS, Yuan W, et al. Low miR‐34a and miR‐192 are associated with unfavorable prognosis in patients suffering from osteosarcoma. Am J Transl Res 2015;7:111‐119. [PMC free article] [PubMed] [Google Scholar]
- 23. Lv C, Bai Z, Liu Z, Luo P, Zhang J. MicroRNA‐495 suppresses human renal cell carcinoma malignancy by targeting SATB1. Am J Transl Res 2015;7:1992‐1999. [PMC free article] [PubMed] [Google Scholar]
- 24. Jing W, Jiang W. MicroRNA‐93 regulates collagen loss by targeting MMP3 in human nucleus pulposus cells. Cell Prolif 2015;48:284‐292. [DOI] [PMC free article] [PubMed] [Google Scholar]
- 25. Jackson MT, Moradi B, Smith MM, Jackson CJ, Little CB. Activation of matrix metalloproteinases 2, 9, and 13 by activated protein C in human osteoarthritic cartilage chondrocytes. Arthritis Rheumatol 2014;66:1525‐1536. [DOI] [PubMed] [Google Scholar]
- 26. Li Z, Shen JX, Chan MTV, Wu WKK. MicroRNA‐379 suppresses osteosarcoma progression by targeting PDK1. J Cell Mol Med. 2017;21:315‐323. [DOI] [PMC free article] [PubMed] [Google Scholar] [Retracted]
- 27. He X, Zhang W, Liao L, Fu X, Yu Q, Jin Y. Identification and characterization of MicroRNAs by high through‐put sequencing in mesenchymal stem cells and bone tissue from mice of age‐related osteoporosis. PLoS ONE. 2013;8:e71895. [DOI] [PMC free article] [PubMed] [Google Scholar]
- 28. Hao C, Yang SH, Xu WH, et al. MiR‐708 promotes steroid‐induced osteonecrosis of femoral head, suppresses osteogenic differentiation by targeting SMAD3. Sci Rep. 2016;6:22599. [DOI] [PMC free article] [PubMed] [Google Scholar]
- 29. Gu CX, Xu Y, Zhang SF, et al. miR‐27a attenuates adipogenesis and promotes osteogenesis in steroid‐induced rat BMSCs by targeting PPAR gamma and GREM1. Sci Rep. 2016;6:38491. [DOI] [PMC free article] [PubMed] [Google Scholar]
- 30. Chen J, Xia J, Wei YB, et al. Role of microRNAs in pathogenesis of osteonecrosis of the femoral head in BSO rat model. Int J Clin Exp Pathol 2016;9:3521‐3528. [Google Scholar]
- 31. Jia J, Feng XB, Xu WH, et al. MiR‐17‐5p modulates osteoblastic differentiation and cell proliferation by targeting SMAD7 in non‐traumatic osteonecrosis. Exp Mol Med. 2014;46:e107. [DOI] [PMC free article] [PubMed] [Google Scholar]
- 32. Wu XJ, Zhang YT, Guo X, et al. Identification of differentially expressed microRNAs involved in non‐traumatic osteonecrosis through microRNA expression profiling. Gene. 2015;565:22‐29. [DOI] [PubMed] [Google Scholar]
- 33. Wang BQ, Yu P, Li T, Bian YY, Weng XS. MicroRNA expression in bone marrow mesenchymal stem cells from mice with steroid‐induced osteonecrosis of the femoral head. Mol Med Rep. 2015;12:7447‐7454. [DOI] [PubMed] [Google Scholar]
- 34. Yamasaki K, Nakasa T, Miyaki S, Yamasaki T, Yasunaga Y, Ochi M. Angiogenic microRNA‐210 is present in cells surrounding osteonecrosis. J Orthop Res. 2012;30:1263‐1270. [DOI] [PubMed] [Google Scholar]
- 35. Wei BF, Wei W. Identification of aberrantly expressed of serum microRNAs in patients with hormone‐induced non‐traumatic osteonecrosis of the femoral head. Biomed Pharmacother. 2015;75:191‐195. [DOI] [PMC free article] [PubMed] [Google Scholar]
- 36. Hadarovich A, Anishchenko I, Tuzikov AV, Kundrotas PJ, Vakser IA. Gene ontology in comparative protein docking. Protein Sci 2016;25:135‐136.26073558 [Google Scholar]
- 37. Zhang YH, Chu C, Wang SP, et al. The use of gene ontology term and KEGG pathway enrichment for analysis of drug half‐life. PLoS ONE. 2016;11:e0165496. [DOI] [PMC free article] [PubMed] [Google Scholar]
- 38. Xing ZH, Chu C, Chen L, Kong XY. The use of gene ontology terms and KEGG pathways for analysis and prediction of oncogenes. Bba‐Gen Subjects. 2016;1860:2725‐2734. [DOI] [PubMed] [Google Scholar]
- 39. Zhang SB, Tang QR. Predicting protein subcellular localization based on information content of gene ontology terms. Comput Biol Chem. 2016;65:1‐7. [DOI] [PubMed] [Google Scholar]
- 40. Lan CW, Chen QF, Li JY. Grouping miRNAs of similar functions via weighted information content of gene ontology. BMC Bioinformatics 2016;17:507. [DOI] [PMC free article] [PubMed] [Google Scholar]
- 41. Chen L, Zhang YH, Zou Q, Chu C, Ji ZL. Analysis of the chemical toxicity effects using the enrichment of Gene Ontology terms and KEGG pathways. Bba‐Gen Subjects. 2016;1860:2619‐2626. [DOI] [PubMed] [Google Scholar]
- 42. Chen L, Zhang YH, Zheng MY, Huang T, Cai YD. Identification of compound‐protein interactions through the analysis of gene ontology, KEGG enrichment for proteins and molecular fragments of compounds. Mol Genet Genomics. 2016;291:2065‐2079. [DOI] [PubMed] [Google Scholar]
- 43. Alakangas A, Selander K, Mulari M, Halleen J, Lehenkari P, Mönkkönen J, et al. Alendronate disturbs vesicular trafficking in osteoclasts. Calcif Tissue Int. 2002;70:40‐47. [DOI] [PubMed] [Google Scholar]
Associated Data
This section collects any data citations, data availability statements, or supplementary materials included in this article.
Supplementary Materials


