

Abstract
Objectives
Lidocaine is the most commonly used local anaesthetic in clinical and can inhibit proliferation, suppress invasion and migration and induce apoptosis in human lung adenocarcinoma (LAD) cells. However, its specific downstream molecular mechanism is unclear.
Materials and methods
LAD cell lines, A549 and H1299 cells, were treated with lidocaine. The proliferation was evaluated by the methylthiazolyldiphenyl‐tetrazolium bromide (MTT) and bromodeoxyuridine (BrdU) assay. The expression level of related proteins was detected by real‐time quantitative PCR (qPCR) and Western blot assay.
Results
The results indicated that lidocaine dose‐dependently suppressed the proliferation of A549 and H1299 cells. In the LAD patients’ samples, GOLT1A was upregulated and involved in the poor prognosis and higher grade malignancy. Additionally, GOLT1A mediates the function of lidocaine on repressing proliferation by regulating the cell cycle in A549 cells.
Conclusions
Our findings suggest that lidocaine downregulates the GOLT1A expression to repress the proliferation of lung cancer cells.
1. INTRODUCTION
Retrospective studies have found that cancer patients can benefit from local anaesthesia to reduce cancer recurrence and improve survival rate1, 2, 3. Lidocaine is one of the most commonly used local anaesthetic in clinical and can inhibit proliferation, suppress invasion and migration, and induce apoptosis in many cancers4, 5, 6. In human thyroid cancer cells, lidocaine induces apoptosis by regulating the mitogen‐activated protein kinase pathway.5 Lidocaine also inhibited the growth of HepG2 cells in a dose‐ and time‐dependent manner with the increase of Bax protein and activated caspase‐3 and a corresponding decrease in Bcl‐2 protein.6 Lidocaine could block the TNFα‐induced increase of invasion in lung cancer cells.7, 8 However, whether lidocaine regulates the lung cancer cells viability remains largely unknown. The downstream molecular mechanism is also unclear.
Lung adenocarcinoma (LAD) is one of the most common malignant cancers and leads to most of deaths.9 LAD has become the most common subtype of lung cancers.10 Although there is rapid development of treatment methods including of surgical resection, chemotherapy and radiotherapy in recent decades, the survival rate of patients still have not been improved significantly.11 Rapid proliferation of lung cancer cells results of the malignant enlargement with compression on organs and subsequent metastasis and invasion. Proliferation is regulated by an array of genes. Recent studies showed that Golgi‐related genes significantly regulate the tumorigenesis and development.12, 13 Golgi phosphor protein 2 (GOLPH2) has been reported to be correlated with many diseases including of prostate cancer, and renal cell cancer.14, 15, 16 Overexpression of GOLPH3 correlates with poor response to new adjuvant therapy in locally advanced rectal cancer.17 Overexpression of GOLPH3 also is associated with poor survival and regulates the metastasis through MMP‐2 and MMP‐9 in non‐small‐cell lung cancer.18 Golgi transport 1A (GOLT1A) modulates tamoxifen sensitivity in breast cancer cells.19 However, less report showed the function of GOLT1A in lung cancer cells, and the related molecular mechanism remains largely unknown.
In this study, we found that GOLT1A expression was significantly elevated in LAD patients tissue samples analysed from TCGA database. High level of GOLT1A was related to the poor prognosis and adverse pathological T stage. Downregulation of GOLT1A repressed the proliferation and induced the cell cycle arrest of lung cancer cells. Lidocaine repressed the cell proliferation by downregulating the GOLT1A. In this study, we indicated the function of GOLT1A on LAD cells proliferation. Lidocaine repressed the cell proliferation by downregulating the GOLT1A. Our studies may lay the foundation for therapeutic treatment of lidocaine for lung cancer.
2. MATERIALS AND METHODS
2.1. Cell culture and lidocaine treatment
Human lung cancer cell lines A549, were purchased from ATCC (Manassas, VA, USA) and cultured in RPMI‐1640 medium (GIBCO, New York, NY, USA) supplemented with 10% foetal bovine serum (GIBCO), 100 mg/mL of streptomycin sulphate (Invitrogen, Life Technologies, Carlsbad, CA, USA), and 100 U/mL of penicillin sodium (Invitrogen) at 37°C, 5% CO2 atmosphere in air. The concentrations of lidocaine were based on previous study.6
2.2. mRNAs Quantitative PCR (qPCR)
Total RNA was extracted by RNAiso plus (Takara, Kusatsu, Japan) and used to synthesize cDNA by reverse transcription PCR kit (Takara). Primer sequences were as follows: Cyclin E1 (forward:5′‐GCCAGCCTTGGGACAATAATG‐3′; reverse:5′‐CTTGCACGTTGAGTTTGGGT‐3′), Cyclin D1 (forward: 5′‐CAATGACCCCGCACGATTTC‐3′; reverse: 5′‐CATGGAGGGCGGATTGGAA‐3′), Cdkn1a (forward: 5′‐TGTCCGTCAGAACCCATGC‐3′; reverse: 5′‐AAAGTCGAAGTTCCATCGCTC‐3′), Cdkn1b (forward: 5′‐TAATTGGGGCTCCGGCTAACT‐3′; reverse: 5′‐TGCAGGTCGCTTCCTTATTCC‐3′), GOLT1A (forward: 5′‐GGGCCTGTCCCTCATCATT‐3′; reverse: 5′‐TTTGTGCCGTTGGAAGAAGAA‐3′), GAPDH (forward: 5′‐GGTGGTCTCCTCTGACTTCAACA‐3′; reverse: 5′‐GTGGTCGTTGAGGGCAATG‐3′.)
2.3. GOLT1A siRNA
The sequence of siRNA was referenced from the previous study.19 The sequences are as followed:
siRNA1GOLT1A (5′‐GAUUCUUCAGCCUCUUUAAGG‐3′ and 5′‐UUAAAGAGGCUGAAGAAUCCG‐3′) and siGOLT1A‐2 (5′‐GAAACCUACGGAUUCUUCA‐3′ and 5′‐UGAAGAAUCCGUAGGUUUCCA‐3′).
2.4. Overexpression of GOLT1A
cDNA was synthesized by reverse transcription PCR kit (Takara) from total RNA isolated from A549 cells. The GOLT1A CDS fragment was inserted into the Fugw vector. The PCR primers are as follows: forward: 5′‐GGCGGATCCATGATCTCCATCACCGAATGGC‐3′ (BamH1 restriction enzyme), reverse: 5′‐GGCGAATTCTCAGACCATCGAGCTAGTGCCTT‐3′ (EcoR1 restriction enzyme).
2.5. Western blot
Protein was lysed from cells by SDS lysis buffer (Beyotime Biotechnology, Nantong, China) and used for electrophoretic analysis. The protein was then transferred onto PVDF membrane (Whatman, Pittsburgh, PA, USA). The membrane was then incubated with GOLT1A antibody (Abcam, Cambridge, MA, USA), GAPDH (Abcam). The protein level was visualized by enhanced chemiluminescence (ECL).
2.6. Bromodeoxyuridine (BrdU) incorporation analysis
Cells were seeded in 96 wells (3×10³ cells/well) in medium with BrdU solution (20 μmol/L). After 2‐hour incubation, cells were fixed by 4% paraformaldehyde (PFA) for 15 minutes. The cells were treated with DNase (TIANGEN) at room temperature for 20 minutes. Cells were incubated with BrdU antibody (Abcam) for 10 hours overnight and then incubated with secondary antibody (Abcam). Cell nucleus was dyed with Hoechst 33342. BrdU‐positive cells were counted in 100 cells for at least 10 section fields.
2.7. Proliferation assay
Cells (3×10³ cells per well) were seeded in 96‐well plate. Proliferation assay was used by Cell Titer 96® AQueous One Solution Cell Proliferation Assay kit (Promega, Fitchburg, WI, USA). The 490 nm absorbance was detected by using microplate reader (SpectraMax M5; Molecular Devices, Sunnyvale, CA, USA).
2.8. Analysis by the TCGA data set
2.8.1. Golt1A expression analysis in the TCGA data set
Whole genome mRNA expression data of 515 LAD samples were obtained from TCGA database (http://cancergenome.nih.gov/). We used RSEM value of genes for downstream analysis. t Test was used to test significant difference of Golt1A's expression between cancer samples and normal samples. We found that Golt1A expression was much higher in cancer samples than normal samples. P‐value is 8.9941e−6.
2.8.2. Survival analysis
Whole genome mRNA expression data and clinical data of 501 LAD cancer samples were obtained from TCGA database (http://cancergenome.nih.gov/). For survival analysis, patients were separated into two groups according to median expression level of Golt1A.
2.8.3. Clinic‐pathologic parameters comparative analysis
Whole genome mRNA expression data and clinical data of 515 LAD samples were obtained from TCGA database (http://cancergenome.nih.gov/). We used RSEM value for downstream analysis. We compared Golt1A's expression level in different pathologic T stage. We drew box plot of Golt1A's expression for different pathologic stage T.
2.9. Statistical analyses
In order to determine statistical significance, Student's t test or one‐way ANOVA was used. Values were presented as the mean±SD, *P<.05,**P<.01, ***P<.001 respectively.
3. RESULTS
3.1. Lidocaine suppressed the proliferation of LAD cells
Lidocaine suppressed the proliferation of LAD cell lines A549 in a dose‐dependent manner detected by MTT assay (Figure 1A) and BrdU assay (Figure 1B), and lidocaine could also repress the H1299 cells proliferation (Figure S1A). Cyclin D1 was expressed, Cyclin E1 was downregulated, and Cdkn1a and Cdkn1b were upregulated in A549 cells after lidocaine treatment (Figure 1C). Additionally, the proportion of G1 phase cells was increased in the A549 cells after lidocaine treatment, while proportion of S and G2/M phase cells was decreased (Figure 1D). Additionally, we used the flow cytometry assay (FACS) to detect the apoptosis and found lidocaine can induce the apoptosis of A549 cells (Figure S1B).
Figure 1.
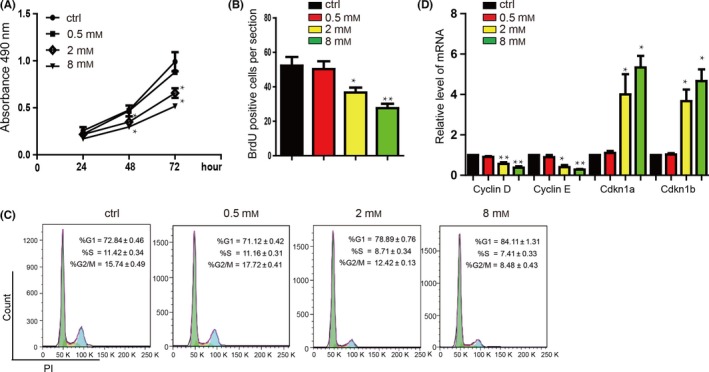
Lidocaine inhibits the proliferation of A549 cells in a dose‐dependent manner. (A) The results from the MTT assay after A549 cells were incubated in lidocaine (0‐8 mmol/L). Data shown are means±SD (n=6). *P<.05, **P<.01 vs the corresponding control. (B) Sum of BrdU‐positive cell numbers in lidocaine (0‐8 mmol/L) at 24 hours. Data shown are means±SD (n=6). *P<.05, **P<.01 vs the corresponding control. (C) Representative image showing the effect of lidocaine on cell cycle progression. G0/G1 phase arrest was observed in A549 cells treated with or without lidocaine. Data shown are means±SD (n=3). *P<.05, **P<.01 vs the corresponding control. (D) A549 cells were treated with lidocaine (0‐8 mmol/L) for 24 hours, and then subjected to qRT‐PCR to quantify the mRNA levels of the cell cycle‐related genes (Cyclin D1, Cyclin E1, Cdkn1a and Cdkn1b). Data shown are means±SD (n=6). *P<.05, **P<.01 vs the corresponding control
3.2. Higher expression of GOLT1A is critically involved in the poor prognosis and higher grade malignancy
Lidocaine suppressed the expression of GOLT1A in A549 cells in a dose‐dependent manner (Figure 2A). We therefore analysed the data from the TCGA database of lung cancer patients’ cancer and normal samples and found that GOLT1A was significantly upregulated in cancer samples compared with normal tissues (Figure 2B). We then analysed the survival rate of the high‐ and low‐GOLT1A expression level groups of LAD patient's samples and found that high level of GOLT1A groups was involved in the lower survival ratio (Figure 2C). The tumour, node, metastases (TNM) stage system is used to classify patients for participation in clinical treatment or trials.20 We found that the expression level of GOLT1A was associated with the T stage, especially the T3 and T4 stage, which suggested that upregulation of GOLT1A was related with the increase of tumour (Figure 2D).
Figure 2.
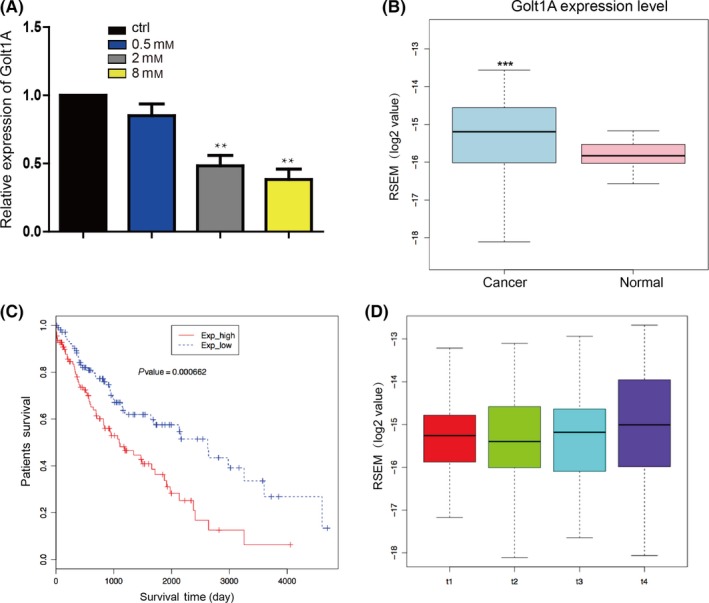
Overexpression of GOLT1A is closely related to poor prognosis and high aggressiveness. (A) A549 cells were treated with lidocaine (0‐8 mmol/L) for 24 hours, and then subjected to qRT‐PCR to quantify the mRNA levels of GOLT1A. Data shown are means±SD (n=6). *P<.05, **P<.01 vs the corresponding control. (B) Expression of GOLT1A was upregulated in lung cancer samples compared with normal tissues analysed by using RNA‐seq data form TCGA. ***P<.001 vs the corresponding control. (C) Lower GOLT1A expression level was related to the better survival rate than that of higher ones in lung cancer patients. The blue line is patients with lower expression level of GOLT1A. The red line is patients with higher expression level of GOLT1A. (D) RESM analysis showed that the upregulation of the expression level of GOLT1A was associated with the T stage of tumour. Data shown are means ±SD (n=3)
3.3. GOLT1A promotes the LAD cell proliferation by regulating the cell cycle
In order to detect the function of GOLT1A, we downregulated the GOLT1A expression (Figure 3A) and found that the proliferation was repressed significantly in A549 (Figure 3B,C) and H1299 cells (Figure S2A). We then found that there is significant increase of the proportion of G1 phase cells, and decreased proportion of S and G2/M phase cells in A549 cells with downregulation of GOLT1A (Figure 3D). We then detected that the G1 phase relative gene Cyclin D1, Cyclin E1 expression were downregulated. We also found that cell cycle inhibitors, Cdkn1a, Cdkn1b, were upregulated (Figure 3E). In the contrary, overexpression of GOLT1A (Figure 3F) promoted the proliferation of A549 (Figure 3G,H) and H1299 cells (Figure S2B). We also found that overexpression of GOLT1A significantly downregulated the proportion of G1 phase cells, and upregulated the S and G2/M phase cells of A549 cells (Figure 3I). We then detected that the overexpression of GOLT1A upregulated Cyclin D1 and Cyclin E1 and downregulated Cdkn1a and Cdkn1b (Figure 3J).
Figure 3.
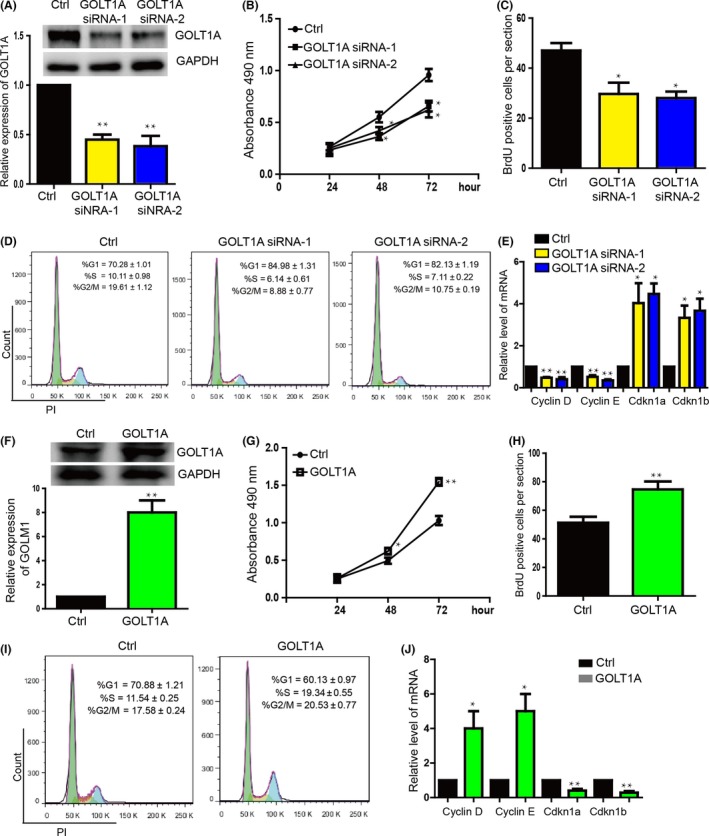
GOLT1A affects the proliferation of lung cancer cells by regulating the cell cycle. (A) The expression level of GOLT1A was significantly downregulated in GOLT1A knockdown group by transfect siRNA. The upper panel shows the protein level detected by Western blot. The bottom panel shows the mRNA level detected by qPCR. Data shown are means±SD (n=3). **P<.01 vs the corresponding control. (B) MTT proliferation assay showed that downregulation of GOLT1A repressed the A549 cell proliferation. ctrl means the control siRNA. Data shown are means±SD (n=6). *P<.05 vs the corresponding control. (C) A549 cell proliferation was repressed in GOLT1A knockdown group detected by BrdU incorporation assay. Data shown are means±SD (n=6). *P<.05 vs the corresponding control. (D) The flow cytometry assay (FACS) showed the increase proportion of G1 phase cells and the decrease proportion of in S, and G2/M phase cells in GOLT1A downregulation group. Data shown are means±SD (n=3). (E) Cyclin E1 and Cyclin D1 were downregulated. Cdkn1a and Cdkn1b were upregulated in the GOLT1A knockdown group detected by qRT‐PCR. Data shown are means±SD (n=6). *P<.05, **P<.01 vs the corresponding control. (F) The GOLT1A was overexpressed in A549 cells. The upper panel shows the protein level detected by Western blot. The bottom panel shows the mRNA level detected by qPCR. Data shown are means±SD (n=6). **P<.01 vs the corresponding control. (G) GOLT1A promoted the A549 cell proliferation detected by MTS assay. Data shown are means±SD (n=6). *P<.05, **P<.01 vs the corresponding control. (H) A549 cell proliferation was promoted by GOLT1A detected by BrdU incorporation assay. Data shown are means±SD (n=6). **P<.01 vs the corresponding control. (I) FACS showed the decrease proportion of G1 phase cells and increase proportion of S and G2/M phase cells in A549 cell overexpressed with GOLT1A. Data shown are means±SD (n=3). *P<.05, **P<.01 vs the corresponding control. (J) Expression of Cyclin E1 and Cyclin D1 was downregulated. Cdkn1a and Cdkn1b were upregulated in the GOLT1A overexpression group detected by qPCR. Data shown are means±SD (n=6). *P<.05, **P<.01 vs the corresponding control
3.4. GOLT1A mediates the function of lidocaine on repressing proliferation
We performed the rescue experiment to detect whether lidocaine represses the proliferation through GOLT1A. After overexpressing the GOLT1A in the A549 cells, we treated cells with lidocaine (Figure 4A) and found that GOLT1A blocked the proliferation repression caused by lidocaine (Figure 4B,C). The GOLT1A restored the expression level of Cyclin D1, Cyclin E1, Cdkn1a and Cdkn1b influenced by lidocaine (Figure 4D). Additionally, overexpression of GOLT1A also restored the cell cycle arrest caused by lidocaine treatment (Figure 4E).
Figure 4.
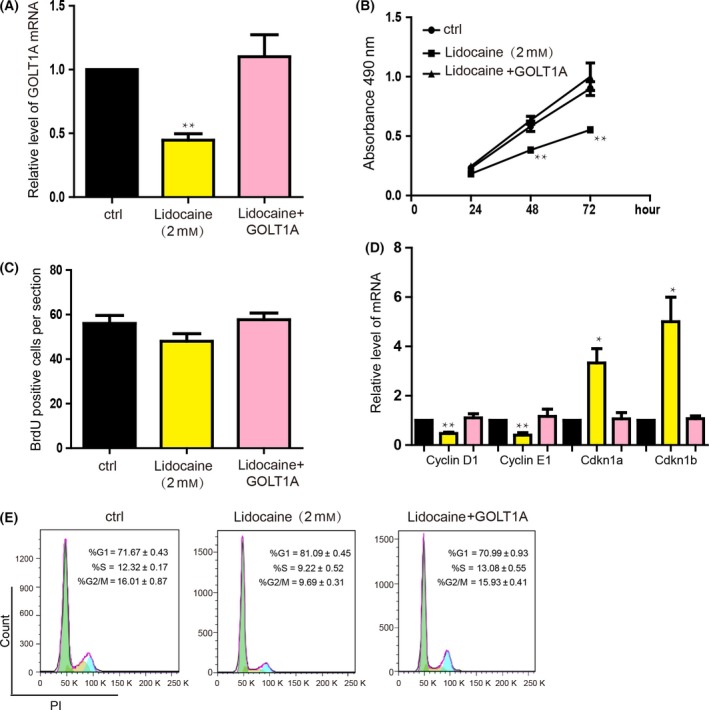
The inhibitory effect of lidocaine on lung cancer proliferation was mediated by GOLT1A. (A) A549 cells infected with adenovirus‐mediated overexpression of GOLT1A for 24h and then treated with lidocaine (2mM) for 24 hours. The mRNA and protein levels of GOLT1A were detected. Data shown are means±SD (n=6). *P<.05, **P<.01 vs the corresponding control. (B) MTT assay was analysed after GOLT1A‐overexpressed A549 cells had been treated with lidocaine (2 mmol/L) for 24 hours. Data shown are means ± SD (n=6). *P<.05, **P<.01 vs the corresponding control. (C) The total number of BrdU‐positive cells was estimated after 24‐hour treatment of lidocaine (2 mmol/L). Data shown are means ±SD (n=6). *P<.05, **P<.01 vs the corresponding control. (D) The mRNA levels of the cell cycle‐related genes (Cyclin D1, Cyclin E1, Cdkn1a and Cdkn1b) were quantified in GOLT1A‐overexpressed A549 cells treated by lidocaine (2 mmol/L) for 24 hours. Data shown are means±SD (n=6). *P<.05, **P<.01 vs the corresponding control. (E) Representative image showing the effect of lidocaine on cell cycle progression. G0/G1 phase acceleration was observed in GOLT1A‐overexpressed A549 cells treated with lidocaine (2 mmol/L). Data shown are means±SD (n=3). *P<.05, **P<.01 vs the corresponding control
4. DISCUSSION
As a major cause of global cancer‐related deaths, lung cancer has greater annual burden than any other cancers, of which more than 85% of cases are currently classified as NSCLC.21, 22 More than half of the NSCLC cases were adenocarcinoma.23 Despite recent advances in diagnosis and treatment, the predicted 5‐year survival rate is only 15.9% in the last few decades with only a minor improvement.24
A retrospective study of patients undergoing cancer surgery showed that the use of regional anaesthesia reduced the risk of tumour metastasis and recurrence, but the mechanism remains unclear.1, 2, 3 One of the most important advantages of regional anaesthetics is that they can reduce tumour cells viability, but do not in normal tissues.25 Lidocaine, the most commonly used local anaesthetic in the clinic, inhibits proliferation, invasion and migration and also induces apoptosis in different cancers.5, 6, 26 Recent studies have found that lidocaine can reduce viability of human lung cancer cells, but its specific downstream molecular mechanism has been poorly studied.7, 8 In our study, we proved that the lidocaine repressed the proliferation of LAD cells in a dose‐dependent manner.
Many gene expression microarray and bioinformatics analysis of the patients sample showed much new insight into the detection and treatment of cancer cells. Golgi‐related genes were also reported to be the critical potential biomarkers of many kinds of cancers.12, 13 Golgi phosphoprotein‐3 (GOLPH3) has been reported to be common in early‐stage NSCC and be associated with tumour progression, increased tumour angiogenesis and poor survival.27 Golgi protein‐73 might be the potential biomarkers for diagnosis of hepatocellular carcinoma.28
In this study, we found that GOLT1A was upregulated in the LAD patients’ samples, which showed that abnormal expression of GOLT1A was related to the tumorigenesis. Low expression of GOLT1A was related to the better survival. Poor prognosis was related to the higher expression of GOLT1A. We further found that GOLT1A was upregulated in terminal‐cancer stage and related to the adverse pathological T stage. These results suggested that the GOLT1A might be the potential biomarker of LAD diagnosis and treatment. Golgi‐related genes have been reported to be critically involved in the cancer cell proliferation. Overexpression of GOLPH3 activated the Wnt signalling pathway and increased β‐catenin expression to promote proliferation of human colon cancer cells.29 Downregulation of Golgi phosphoprotein 2 repressed the hepatocellular carcinoma cell proliferation.30 In this study, we found that knockdown of GOLT1A significantly inhibited the proliferation of LAD cell line. In the contrary, overexpression of GOLT1A promoted the proliferation. We also found that the cell cycle was influenced by GOLT1A. Cyclin D1 and Cyclin E1 are critical checkpoint proteins that regulate cells from G1 to S phase.31, 32 The overexpression of Cyclin D1 and Cyclin E1 is associated with poor prognosis and can significantly reduce post‐operative long‐term survival.33 Our study showed that the expression of Cyclin D1 and Cyclin E1 is downregulated, which prevents cells from moving from G1 to S phase, thereby inhibiting cell growth. Cell cycle inhibitors, Cdkn1a and Cdkn1b, were upregulated. These results showed the critical role of GOLT1A on regulating the LAD cell growth and suggested the downstream molecular signalling pathway related to the cell cycle regulation. GOLT1A also may be the novel therapeutic target for future lung cancer treatment.
Recent studies showed that oestrogen receptors play an important role in tumorigenesis. In lung cancer cells, oestrogen stimulates tumour progression and metastasis.34 ZEB1 induces oestrogen receptor‐α (ER‐α) promoter hypermethylation and confers anti‐oestrogen resistance in breast cancer.35 Positive ERα was also associated with poor prognosis of Chinese gastric cancer patients.36 Recent study showed that GOLT1A was selected as one of the miR‐378a‐3p candidate target genes by in silico analysis and miR‐378a‐3p‐dependent GOLT1A expression may be one mechanism underlying breast cancer endocrine resistance.19 These studies suggested the critical roles of oestrogen receptor on regulating tumorigenesis. In this study, GOLT1A blocked the inhibition of lidocaine‐induced proliferation. GOLT1A restored the expression levels of Cyclin D1, Cyclin E1, Cdkn1a and Cdkn1b affected by lidocaine. In addition, GOLT1A also restored lidocaine‐induced cell cycle arrest. These effects of GOLT1A may be achieved through the modulation of oestrogen receptor. Taken together, GOLT1A is a mediator of lidocaine for inhibiting the proliferation of lung cancer cells.
In summary, our results suggest that GOLT1A affects lung cancer cell proliferation by regulating cell cycle. Lidocaine may downregulate GOLT1A to inhibit the proliferation of lung cancer cells.
CONFLICT OF INTEREST
None declared.
Supporting information
ACKNOWLEDGEMENTS
This research was supported by the National Natural Science Foundation of China (81571028). Research funds were from the Shanghai Municipal Science and Technology Commission (16XD1401800), Natural Science Foundation of Shanghai (17ZR1416400, 17DZ1205403).
Zhang L, Hu R, Cheng Y, et al. Lidocaine inhibits the proliferation of lung cancer by regulating the expression of GOLT1A. Cell Prolif. 2017;50:e12364 10.1111/cpr.12364
Lei Zhang and Rong Hu contributed equally to this work.
REFERENCES
- 1. Xuan W, Hankin J, Zhao H, Yao S, Ma D. The potential benefits of the use of regional anesthesia in cancer patients. Int J Cancer. 2014;137:2774‐2784. [DOI] [PubMed] [Google Scholar]
- 2. Byrne K, Levins KJ, Buggy DJ. Can anesthetic‐analgesic technique during primary cancer surgery affect recurrence or metastasis? Can J Anaesth. 2015;63:1‐9. [DOI] [PubMed] [Google Scholar]
- 3. Tedore T. Regional anaesthesia and analgesia: relationship to cancer recurrence and survival. Br J Anaesth. 2015;115:ii34‐ii45. [DOI] [PubMed] [Google Scholar]
- 4. Lirk P, Berger R, Hollmann MW, Fiegl H. Lidocaine time‐ and dose‐dependently demethylates deoxyribonucleic acid in breast cancer cell lines in vitro. Br J Anaesth. 2012;109:200‐207. [DOI] [PubMed] [Google Scholar]
- 5. Xing W, Chen DT, Pan JH, et al. Lidocaine induces apoptosis and suppresses tumor growth in human hepatocellular carcinoma cells in vitro and in a xenograft model in vivo. Anesthesiology. 2017;126:868‐881. [DOI] [PubMed] [Google Scholar]
- 6. Chang YC, Hsu YC, Liu CL, Huang SY, Hu MC, Cheng SP. Local anesthetics induce apoptosis in human thyroid cancer cells through the mitogen‐activated protein kinase pathway. PLoS ONE. 2014;9:e89563. [DOI] [PMC free article] [PubMed] [Google Scholar]
- 7. Piegeler T, Schläpfer M, Dull RO, et al. Clinically relevant concentrations of lidocaine and ropivacaine inhibit TNFα‐induced invasion of lung adenocarcinoma cells in vitro by blocking the activation of Akt and focal adhesion kinase. Br J Anaesth. 2015;115:784. [DOI] [PMC free article] [PubMed] [Google Scholar]
- 8. Piegeler T, Vottavelis EG, Liu G, et al. Anti‐metastatic potential of amide‐linked local anesthetics: inhibition of lung adenocarcinoma cell migration and inflammatory Src signaling independent of sodium channel blockade. Anesthesiology. 2012;117:548‐559. [DOI] [PMC free article] [PubMed] [Google Scholar]
- 9. Tang W, Han M, Ruan B, et al. Overexpression of GOLPH3 is associated with poor survival in non‐small‐cell lung cancer. Am J Transl Res. 2015;8:1756. [PMC free article] [PubMed] [Google Scholar]
- 10. Saito M, Shiraishi K, Kunitoh H, Takenoshita S, Yokota J, Kohno T. Gene aberrations for precision medicine against lung adenocarcinoma. Cancer Sci. 2016;107:713‐720. [DOI] [PMC free article] [PubMed] [Google Scholar]
- 11. Li CG, Pu MF, Li CZ, et al. MicroRNA‐1304 suppresses human non‐small cell lung cancer cell growth in vitro by targeting heme oxygenase‐1. Acta Pharmacol Sin. 2016;38:110‐119. [DOI] [PMC free article] [PubMed] [Google Scholar]
- 12. Ye QH, Zhu WW, Zhang JB, et al. GOLM1 modulates EGFR/RTK cell‐surface recycling to drive hepatocellular carcinoma metastasis. Cancer Cell. 2016;30:444‐458. [DOI] [PMC free article] [PubMed] [Google Scholar]
- 13. Varambally S, Laxman B, Mehra R, et al. Golgi protein GOLM1 is a tissue and urine biomarker of prostate cancer. Neoplasia. 2008;10:1285‐1294. [DOI] [PMC free article] [PubMed] [Google Scholar]
- 14. Klaus J, Holger M, Manfred D, Mark‐Oliver R, Florian F, Glen K. GOLPH2 expression in renal cell cancer. BMC Urol. 2008;8:15. [DOI] [PMC free article] [PubMed] [Google Scholar]
- 15. Iftikhar R, Kladney RD, Havlioglu N, et al. Disease‐ and cell‐specific expression of GP73 in human liver disease. Am J Gastroenterol. 2004;99:1087. [DOI] [PubMed] [Google Scholar]
- 16. Wei S, Dunn TA, Isaacs WB, Marzo AMD, Luo J. GOLPH2 and MYO6: putative prostate cancer markers localized to the Golgi apparatus. Prostate. 2011;68:1387‐1395. [DOI] [PMC free article] [PubMed] [Google Scholar]
- 17. Zhu K, Zhao Q, Yue J, et al. GOLPH3 overexpression correlates with poor response to neoadjuvant therapy and prognosis in locally advanced rectal cancer. Oncotarget. 2016;7:68328‐68338. [DOI] [PMC free article] [PubMed] [Google Scholar]
- 18. Wang R, Ke ZF, Wang F, et al. GOLPH3 overexpression is closely correlated with poor prognosis in human non‐small cell lung cancer and mediates its metastasis through upregulating MMP‐2 and MMP‐9. Cell Physiol Biochem. 2015;35:969‐982. [DOI] [PubMed] [Google Scholar]
- 19. Ikeda K, Horie‐Inoue K, Ueno T, et al. miR‐378a‐3p modulates tamoxifen sensitivity in breast cancer MCF‐7 cells through targeting GOLT1A. Sci Rep. 2015;5:13170. [DOI] [PMC free article] [PubMed] [Google Scholar]
- 20. Li J, Yi CH, Hu YT, et al. TNM staging of colorectal cancer should be reconsidered according to weighting of the T stage: verification based on a 25‐year follow‐up. Medicine. 2016;95:e2711. [DOI] [PMC free article] [PubMed] [Google Scholar]
- 21. Chen Z, Fillmore CM, Hammerman PS, Kim CF, Wong KK. Non‐small‐cell lung cancers: a heterogeneous set of diseases. Nat Rev Cancer. 2014;14:535‐546. [DOI] [PMC free article] [PubMed] [Google Scholar]
- 22. Shtivelman E, Hensing T, Simon GR, et al. Molecular pathways and therapeutic targets in lung cancer. Oncotarget. 2014;5:1392‐1433. [DOI] [PMC free article] [PubMed] [Google Scholar]
- 23. Wang G, Wang H, Zhang C, et al. Rac3 regulates cell proliferation through cell cycle pathway and predicts prognosis in lung adenocarcinoma. Tumour Biol. 2016;1‐11. [DOI] [PubMed] [Google Scholar]
- 24. Reck M, Heigener DF, Mok T, Soria JC, Rabe KF. Management of non‐small‐cell lung cancer: recent developments. Lancet. 2013;382:709‐719. [DOI] [PubMed] [Google Scholar]
- 25. Durieux ME. Anesthesia and cancer recurrence: improved understanding, but no reason for change. Anest Analg. 2014;118:8‐9. [DOI] [PubMed] [Google Scholar]
- 26. Sakaguchi M, Kuroda Y, Hirose M. The antiproliferative effect of lidocaine on human tongue cancer cells with inhibition of the activity of epidermal growth factor receptor. Anest Analg. 2006;102:1103‐1107. [DOI] [PubMed] [Google Scholar]
- 27. Lu M, Tian Y, Yue WM, et al. GOLPH3, a good prognostic indicator in early‐stage NSCLC related to tumor angiogenesis. Asian Pac J Cancer Prev. 2014;15:5793‐5798. [DOI] [PubMed] [Google Scholar]
- 28. Nobuhiro T, Yu S, Itaru E, Keigo S, Yasushi U, Tetsuya N. Biomarkers for the early diagnosis of hepatocellular carcinoma. World J Gastroenterol. 2015;21:10573‐10583. [DOI] [PMC free article] [PubMed] [Google Scholar]
- 29. Qiu CZ, Wang MZ, Yu WS, Guo YT, Wang CX, Yang XF. Correlation of GOLPH3 gene with Wnt signaling pathway in human colon cancer cells. J Cancer. 2016;7:928‐934. [DOI] [PMC free article] [PubMed] [Google Scholar]
- 30. Liu Y, Zhang X, Sun T, et al. Knockdown of Golgi phosphoprotein 2 inhibits hepatocellular carcinoma cell proliferation and motility. Oncotarget. 2016;7:21404‐21415. [DOI] [PMC free article] [PubMed] [Google Scholar]
- 31. Lin DI, Lessie MD, Gladden AB, Bassing CH, Wagner KU, Diehl JA. Disruption of cyclin D1 nuclear export and proteolysis accelerates mammary carcinogenesis. Oncogene. 2008;27:1231‐1242. [DOI] [PMC free article] [PubMed] [Google Scholar]
- 32. Lu A, Pfeffer SR. Golgi‐associated RhoBTB3 targets Cyclin E for ubiquitylation and promotes cell cycle progression. J Cell Biol. 2013;203:233. [DOI] [PMC free article] [PubMed] [Google Scholar]
- 33. Rosenberg E, Demopoulos RI, Zeleniuch‐Jacquotte A, et al. Expression of cell cycle regulators p57(KIP2), cyclin D1, and cyclin E in epithelial ovarian tumors and survival. Hum Pathol. 2001;32:808. [DOI] [PubMed] [Google Scholar]
- 34. Tang W, Liu R, Yan Y, et al. Expression of estrogen receptors and androgen receptor and their clinical significance in gastric cancer. Oncotarget. 2017;28:89‐98. [DOI] [PMC free article] [PubMed] [Google Scholar]
- 35. Rodriguez‐Lara V, Ignacio GS, Cerbón Cervantes MA. Estrogen induces CXCR4 overexpression and CXCR4/CXL12 pathway activation in lung adenocarcinoma cells in vitro. Endocr Res. 2017;20:1‐13. [DOI] [PubMed] [Google Scholar]
- 36. Zhang J, Zhou C, Jiang H, et al. ZEB1 induces ER‐α promoter hypermethylation and confers antiestrogen resistance in breast cancer. Cell Death Dis. 2017;8:e2732. [DOI] [PMC free article] [PubMed] [Google Scholar]
Associated Data
This section collects any data citations, data availability statements, or supplementary materials included in this article.
Supplementary Materials