

Abstract
Objectives
Schwann cells (SCs) are the principal glial cells in peripheral nerve system, involved in neuropathies with great regenerative potential. Dental pulp cells have been reported to maintain neurogenic potential. In contrast, the regulatory role of SCs on human dental pulp cells (hDPCs) development remains undefined.
Materials and methods
SC secretion and SC‐derived extracellular vesicles (EVs) were collected and used to treat hDPCs; and proliferation and multiple differentiation of hDPCs were detected after EVs treatments. Finally, we analysed the proteomes of SC‐EVs and SCs through mass spectrum.
Results
In this study, we found SC secretion showed a predominantly regulatory role on the development of hDPCs. Further, we identified EVs from SC secretion with similar function as SC secretion in regulating hDPCs proliferation and multipotency. And expression of transcription factor Oct4 was upregulated after treatment of both SC secretion and EVs, as well as Sox2 and Nanog. We detected abundant enrichment of Oct4 in EVs, which might be responsible for the upregulation of stem cell‐related genes in hDPCs. Through proteome and western blot analysis, we found enriched TGFβs in EVs, indicating that accelerated hDPCs proliferation may be mediated by activated TGFβ‐Samd and TGFβ‐MAPK signalling.
Conclusions
In summary, our study sheds light on critical regulatory ability of SC‐derived EVs on hDPCs proliferation and multipotency, suggesting great implications for seeding cells used in tissue engineering.
1. INTRODUCTION
Schwann cells (SCs) are major glial cells in peripheral nervous system (PNS), with great abilities in nerve repair and regeneration. SCs can secrete various neurotrophins (NTs), including nerve growth factor (NGF), brain‐derived neurotrophic factor (BDNF), neurotrophin 3 (NT3), neurotrophin 4/5 (NT4/5) and glial cell line‐derived neurotrophic factor (GDNF), which function as nutrition support preventing injured neurons from dying and promoting regeneration of axons.1, 2 SCs also provide molecules involved in cell adhesion, as well as other components in extracellular matrix, which can guide regenerated axons to grow and function in specific organ.3 In nerve grafting or regeneration, SCs develop gap junctions and tight junctions to ensure matter exchange with regenerating axons.4, 5 Moreover, various researches indicated that NTs which were abundantly secreted by neural cells, regulated tooth innervation, and this showed a potential role on promoting dental pulp cell differentiation and calcification.6, 7 On the contrary, transplanted dental pulp stem cells provide trophic supports for SCs by secreting NGF, BDNF and GDNF in rat in peripheral nerve regeneration.8 These evidences suggest a potentially reciprocal interaction between dental mesenchyme and neural cells.
For decades, it was admitted that dental papilla/pulp cells (DPCs) and dental follicle cells were originated from cranial neural crest cells.9 Recently, Nina Kaukua and colleagues identified a population of dental mesenchyme stem cells by lineage tracing, and it turned out these cells were derived from peripheral nerve‐associated glial cells. As the major population of nervous glial cells, the precursors of SCs generated dental mesenchymal stem cells (MSCs), which differentiated into dental pulp cells, and eventually into odontoblasts.10 These researches suggest SCs and dental mesenchymal cells have strong connection during tooth generation.
Extracellular vesicles (EVs) are a type of mixed vesicles, including endosome‐derived exosomes (with a diameter of 50‐100 nm) and cell membrane‐derived ectosomes (with a larger diameter of 100‐1000 nm).11 These bilipid‐membrane vesicles are produced by cells stimulated by pathology, apoptosis, hypoxia stress or experiencing quiescent state.12 They contain various types of cargoes, such as proteins, liposomes, miRNAs and mRNAs. After fused with the membrane of target cells, inner cargoes are released into target cells. Due to the special structure of EVs, luminal molecules are prevented from degradation,13 thus providing a crucial approach for cell to cell communication.14 SCs from peripheral nervous system have been thought to have favourable potential for nerve regeneration, and EVs secreted by SCs exhibit similar function to increase axonal regeneration.15, 16Recent researches showed that human dental pulp cells (hDPCs) could be induced to differentiate into neural cells, with implications for neural diseases therapy.17, 18, 19, 20 Peripheral SCs were recognized as an important therapeutic cell resource for neurological diseases, and they consisted of the main glial cells in the PNS, with great regenerated potential for myelination.21 Meanwhile, exosomes from MSC were recognized as significant contributors in MSC clinical therapy.22, 23 However, whether SCs modulate dental MSCs development is still unknown. In this study, we investigated the regulatory potentials of SCs on hDPCs, and found that SC conditioned culture medium (SCmd) showed significant regulating ability on hDPCs proliferation and multipotency. We further identified EVs from SCmd as the principal factors modulating hDPCs development. Finally, the proteomes of EVs and SCs were analysed by mass spectrometry, and 937 common proteins (appeared in both EVs and SCs) were identified between EVs and its maternal cell SCs, as well as 211 distinct proteins from EVs and 1371 from SCs. Then, KEGG (Kyoto Encyclopedia of Genes and Genomes) pathways and GO (Gene Ontology) terms were used to analyse biological enrichment of these proteins. Through the consistent proteins distribution in biological pathways and functions, our work indicated EVs secreted by SCs (SC‐EVs) have the potential to act as an alternative of SCs in the application of tooth regenerative engineering.
2. METHODS
2.1. Primary cell isolation and cell culture
hDPCs were isolated and derived from extracted tooth of patients as previously described.24 For all the experiments involving human subject were in accordance with guidelines of the Ethics Committee of West China College of Stomatology (Sichuan University) as well as informed consent had been obtained from the participants. And all experimental protocols were approved by the Committee of Ethics of Sichuan University. Tissues were cut into patches, transferred into centrifuge tubes and washed twice with PBS. And then Pipetted out PBS, added 1 mL trypsin, incubated the tissue at 37°C for 20 minutes and shook gently to mix well, terminated the digestion with 1 mL α minimum essential medium (α‐MEM)/10% foetal bovine serum (FBS) (10% α‐MEM) medium, consisted of α‐MEM (Gibco, Gaithersburg, Md, USA) supplemented with 10% FBS (Biowest, Riverside, MO, USA) and 1% penicillin/streptomycin (Sigma, St. Louis, MO, USA). After that, the tube was centrifuged at 200g for 5 minutes; the supernatant was removed and the cell pellet was re‐suspended with 10% α‐MEM. Then, tissues were plated into the dishes pre‐coated with poly‐l‐lysine and shook gently to distribute the tissues evenly. Cells were incubated in normal culture environment (37°C, 5% CO2).
Rat cell lines of SCs (RSC96) were commercially purchased from CAS (Chinese Academy of Sciences, China) and cultured in α‐MEM/2% FBS (2% α‐MEM). Culture medium of SCs was collected every 24 hours followed by 600g centrifuge and filter using 0.22 μm filter unit. Then, collected media were equally mixed with 2% α‐MEM to be prepared as SCmd for the following experiments. hDPCs were cultured with SCmd while 2% α‐MEM serves as control.
2.2. Immunofluorescence
Cells were immobilized with 4% paraformaldehyde and 0.5% tritonX‐100 treated for 15 minutes, blocked with goat serum for 30 minutes, incubated with primary antibody overnight in 4°C. Then, incubated with secondary antibody away from light for no more than 1 hour and DAPI for 5 minutes. The following antibodies were used: GFAP (1:500; Abcam ab7260), S100 (1:1000, Abcam ab868), Nestin (1:200, ab6142, Abcam, Cambridge, MA, USA), Vimentin (1:200, OMA1‐06001, Thermo Scientific, Waltham, MA, USA), CK14 (1:200, MAB3232, Millipore, Billerica, MA, USA).
2.3. Flow cytometry
Cells were digested with trypsin and harvested into 1.5 mL tube, fixed with 70% cold methanol for 4 hours. RNase A treated for 30 minutes in 37°C and then added propidium iodide (PI) to stain for 30 minutes in 4°C. Finally, assayed with flow cytometry system (C6; BD Biosciences, Franklin Lakes, NJ, USA).
hDPC surface antigens were analysed by flow cytometry. In total, 1 × 10⁶ cells were collected and re‐suspended in PBS containing 2% FBS and divided into aliquots. The following conjugated antibodies (BD Biosciences) were used at the concentrations recommended by the manufacturer: CD3‐FITC, CD29‐PE, CD44‐FITC, CD45‐FITC, CD90‐FITC, CD105‐PE, CD166‐PE. After two washes in 1% BSA, the cells were re‐suspended in 200 μL of 1% BSA and analysed by the C6 system. Black histograms represent controls, and the red solid peaks represent indicated markers.
2.4. Cell proliferation assay
Cells were seeded on 96‐well plates (1500 cells/well) and cultured with SCmd and 2%α‐MEM (control) for indicated time lengths. To measure cell proliferation, the Cell Counting Kit‐8 (Sigma) was applied and absorbance of form azan dye produced by living cells was measured with Microplate Reader (Thermo scientific).
Colony‐forming unit (CFU) assay was conducted to measure the self‐renewal ability of hDPCs. hDPCs were seeded at concentration of 100 cells in 60 mm plate. And cultured for 10 days and stained with Wright‐Giemsa. Colonies containing over 20 cells were counted under microscope. Cells cultured with 2% α‐MEM were recognized as control in all the experiments. All experiments were conducted in triplicate.
2.5. RNA preparation and real time qPCR
RNA extraction was performed using RNAiso (Takara, Biotechnology, Tokyo, Japan). RNAs were reversely transcribed into cDNAs using RT first strand cDNA synthesis kit (Thermo). Real time qPCRs were performed using SYBR Green I kit (Thermo) and specific primers which are listed in Tables S1 and Table S2, and all Ct values were normalized by GAPDH level.
2.6. Protein and western blot
Protein extraction was conducted using total Protein extraction kit (KEYGEN). Protein samples were treated with 4X loading buffer and incubated 8 minutes at 100°C for denaturation. The antibodies used for western blot are the following, Sox2 (1:1000; Abcam ab97959), Oct4 (1:1000; BBI D121072), Nanog (1:500; Santa Cruz sc‐33760), TGFβ2 (1:1000; Abcam ab66045), Smad4 (1:1000; Abcam ab40759), p‐Smad2/3 (1:500; Abcam ab63399), JNK (1:1000; CST 9258), p‐JNK (1:1000; CST 4668), Erk1/2 (1:1000; CST 4695), p‐Erk1/2 (1:2000; CST 4370), P38 (1:1000; CST 9212), p‐P38 (1:1000; CST 9211), CD9 (1:1000; Zen 220642), TSG101 (1:500; Zen 341000), Hsp70 (1:1000; Zen 200304), GFAP (1:2000; Abcam ab7260), GAPDH (1:5000; Zen 200306‐7E4), and anti‐mouse, anti‐rabbit and anti‐goat secondary antibodies (1:10 000) were used.
2.7. EVs isolation and morphology and size identification
EVs were isolated from rat SC supernatant as previously described.25 Briefly, 70‐80% confluent cells were cultured for 48 hours in DMEM/F12 (Gibco) without FBS. The culture medium was collected and centrifuged at 2000 g for 15 minutes and the cell supernatant was filtered by 0.45 and 0.22 μm filter sterilize Steritop™ (Millipore) to remove cells and debris. Afterwards, the supernatant was transferred to the Amicon Ultra‐15 Centrifugal Filter Units (Millipore) for concentration. The concentrated medium was transferred into 1.5 ml tube and total exosome isolation agent was added (4478359; Invitrogen), mixed well, incubated at 4°C overnight And centrifuged at 10 000 g for 1 hour at 4°C. The precipitates were washed immediately with PBS. The precipitates at the bottom of the tube containing EVs were diluted in PBS or 2% α‐MEM. EVs were stored at −80°C or used for downstream experiments.
Transmission electron microscopy (TEM) was used to identify the morphology and size of EVs. Firstly, EVs sample was suspended in PBS and added one drop onto carbon‐support film grid and visualized with 2% ammonium molybdate. EVs were observed on a Hitachi H‐7650 transmission electron microscope (Hitachi, Tokyo, Japan).
2.8. hDPC multilineage differentiation
hDPC was treated with SCmd or EVs for 7 days before refreshed with differentiation induction medium and continued to culture for 7‐10 days. Osteogenic induction medium was commercially purchased from Cyagen Biosciences and adipogenic and neurogenic induction medium were prepared as previously described.26 And then cells were collected for stain or RNA isolation. Cells for staining were immobilized with 4% paraformaldehyde and then stained with alizarin red for further observation.
2.9. Mass spectrometry
2.9.1. Protein sample preparation
Cell pellets and EV pellets were respectively suspended in SDT lysis buffer27 containing 4% SDS, 100 mmol/L Tris‐HCl and 1 mmol/L DTT (PH 7.6). The lysates were denatured at 100°C for 10 minutes and centrifuged to remove the debris. The sample was quantified by BCA Protein Assay Kit (Bio‐Rad, Hercules, CA, USA) and stored at −80°C.
2.9.2. Filter‐aided sample preparation
The filter‐assisted sample preparation (FASP Digestion) method was based on procedures described previously.27 Each sample containing 200 μg of proteins was incorporated into 300 μL SDT buffer (4% SDS, 100 mmol/L DTT, 150 mmol/L Tris‐HCl pH 8.0). The detergent, DTT and other low molecular weight components were removed using UA buffer (8 mol/L urea, 150 mmol/L Tris‐HCl pH 8.0) by repeated ultrafiltration (Microcon units, 10 kDa). Then, proteins were alkylated with 100 μL iodoacetamide (100 mmol/L IAA in UA buffer, 30 minutes, in the dark). The samples were washed three times with 100 μL UA buffer and subsequently twice with 100 μL 25 mmol/L NH4HCO3 buffer. Finally, the protein suspensions were digested with 4 μg trypsin (Promega, Madison, WI, USA) in 40 μL 25 mmol/L NH4HCO3 buffer (overnight, 37°C) and the resulting peptides were collected as a filtrate. The peptides of each sample were desalted on C18 Cartridges (Empore™ SPE Cartridges C18 [standard density], bed I.D. 7 mm, volume 3 mL; Sigma), concentrated by vacuum centrifugation and reconstituted in 40 μL of 0.1% (v/v) formic acid. The peptide content was estimated by UV light spectral density at 280 nm using an extinctions coefficient of 1.1 of 0.1% (g/L) solution that was calculated on the basis of the frequency of tryptophan and tyrosine in vertebrate proteins.
2.9.3. Liquid chromatography and tandem mass spectrometry (LC‐MS/MS)
Each fraction was injected for nano LC‐MS/MS analysis. The peptide mixture was loaded onto a reverse phase trap column (Thermo Scientific Acclaim PepMap100, 100 μm*2 cm, nanoViper C18) connected to the C18‐reversed phase analytical column (Thermo Scientific Easy Column, 10 cm long, 75 μm inner diameter, 3 μm resin) in buffer A (0.1% Formic acid) and separated with a linear gradient of buffer B (84% acetonitrile and 0.1% Formic acid) at a flow rate of 300 nL/min controlled by IntelliFlow technology.
LC‐MS/MS analysis was performed on a Q Exactive mass spectrometer (Thermo Scientific) that was coupled to Easy nLC (Proxeon Biosystems, now Thermo Fisher Scientific) for 120 minutes. MS data were acquired using a data‐dependent top 10 method dynamically choosing the most abundant precursor ions from the survey scan (300‐1800 m/z) for HCD fragmentation. The instrument was run with peptide recognition mode enabled. Each sample pool contained three biological replicates and was measured in two technical replicates.
2.9.4. Data analysis
The raw data were analysed using MaxQuant software version 1.3.0.5 (Max Planck Institute of Biochemistry in Martinsried, Germany).28 All the peptides were referred to the UniProt database.29 Unique proteins identified on the basis of two or more peptides were included in the analysis. The following parameters were used for the search: trypsin with maximum two missed cleavages, mass tolerance were ±20 ppm; fixed modification by carbamidomethyl (C), oxidation (M) and acetyl (protein N‐term) as variable modifications. Proteins below the 1% false discovery rate were considered. Gene ontology (GO) analysis was performed using FatiGO.30 We use intensity‐based absolute‐protein‐quantification method (iBAQ) to calculate the abundance of each protein/peptide.31, 32
2.10. Statistics analysis
Independent two‐tailed Student's t test was performed for all the statistical analyses.33 Experiments were performed in triplicate. *P<.05 were considered as statistically significant.
3. RESULTS
3.1. Cell isolation and characterization
SCs appeared fusiform morphology and showed two neurites and small cell body, positively expressing S100 (Figure 1A). hDPCs were obtained from extracted teeth of patients, which positively expressed GFAP and strongly expressed Nestin (Figure 1B). Flow cytometry results indicated hDPCs significantly expressed canonical MSC surface markers CD29, CD44, CD90, CD105, CD166, but negatively expressed CD3 (T‐cells antigen), CD34 and CD45 (haematopoietic cell surface antigens)34, 35 (Figure 1C). Meanwhile, hDPCs displayed predominant potential differentiating into osteoblasts after osteogenic induction for 10 days (Figure 2E).
Figure 1.
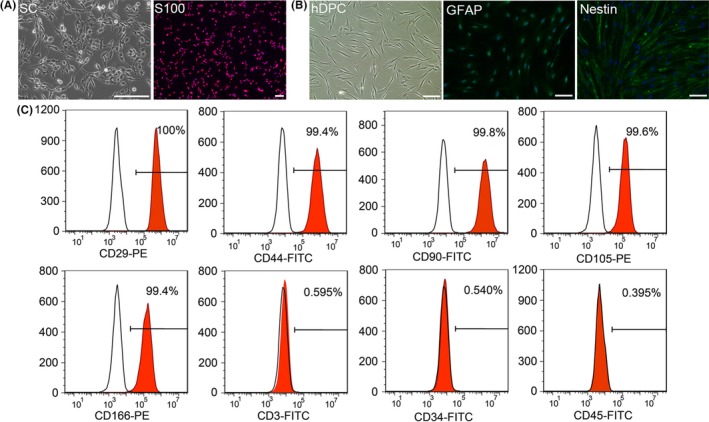
Characterization of human dental pulp cells (hDPCs). A, Morphology of Schwann cells (SCs). SCs were positively stained with Schwann cells marker S100. B, Morphology of hDPCs. hDPCs are fusiform, similar to fibroblasts. And hDPCs positively expressed GFAP, partially expressed Nestin. C, FACS analysis of hDPCs indicated they strongly expressed mesenchyme surface markers CD29, CD44, CD90, CD105, CD166 and were negative for CD3, CD34, and CD45. Scale bars: A, 100 μm; B, 100 μm
Figure 2.
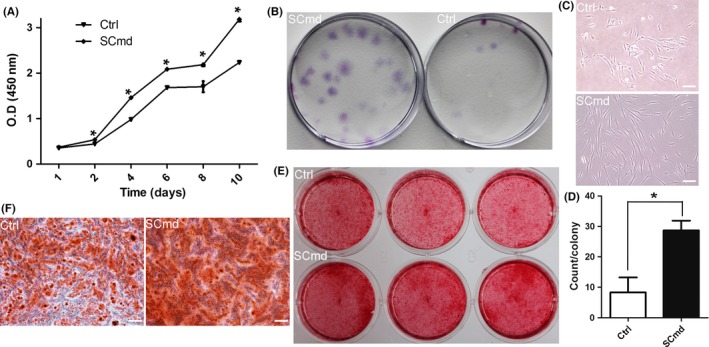
Cell proliferation of human dental pulp cells (hDPCs) by SCmd treatment. (A) Proliferation of hDPCs after treated with Schwann cells (SC)md by CCK8. (B) CFU assay was conducted to compare the colony formation rate between SCmd treatment and control hDPCs. Purple dots refer to cell colonies. (C) Morphology of colony. (D) Counting of cell colonies formed in SCmd‐treated and control groups, and only the colonies with more than 20 cells were counted. General diagram (E) and partial enlargement (F) of alizarin red stained hDPCs. hDPCs were treated with SCmd for 7 d and followed by 10 d osteogenic stimuli. Ctrl, control, hDPC cultured with α‐MEM/2% FBS; SCmd, hDPC cultured with Schwann cell conditioned medium. Error bar, ±SD (n≥3), *P<.05. Scale bars: 100 μm
3.2. SC secretion significantly promoted the proliferation and enhanced multipotency of hDPC
Here, we analysed the regulation of SCs on hDPCs. And we found that SCmd promoted hDPCs proliferation, and elevated their multipotency. Cell proliferation curve showed that cells treated with SCmd significantly proliferated, compared with control (Figure 2A). And CFU assay (Figure 2B), as well as osteogenic differentiation induction assay (Figure 2E,F), indicated that hDPCs cultured with SCmd showed more predominant self‐renewal and osteogenic differentiation abilities. In CFU assay, more cell colonies formed in SCmd group (Figure 2D). Moreover, cells showed no morphogenic differences from normal cultured primary cells in SCmd group; however, in control group, colonies were much smaller than SCmd group, and cells appeared abnormal morphology, rough edges and flat body shape (Figure 2C). We detected stem cell‐related genes and proteins expression at distinct time points (day 3, day 7, day 14). Results showed that transcription factors Nanog, Oct4 and Sox2 upregulated after induced by SCmd, especially Oct4 (Figure 3). At the mRNA level, upregulation effect was more significant when treated with SCmd for a long period (Figure 3C). And at the protein level, Sox2 showed obvious upregulation at day 14 (Figure 3D).
Figure 3.
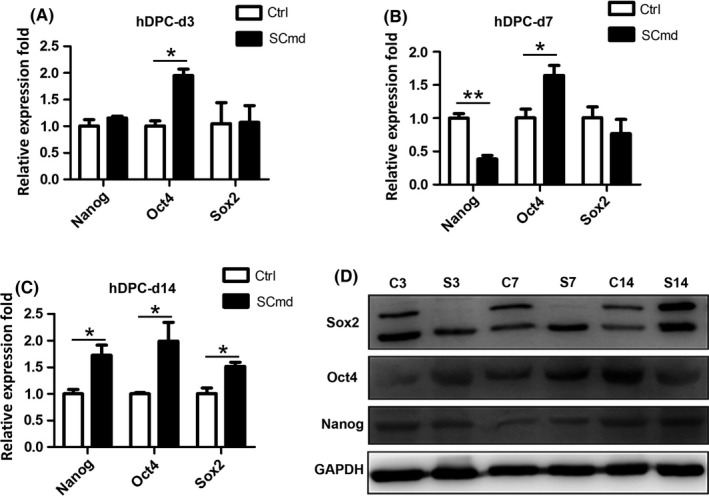
Stem cell‐related genes and proteins expression. Stem cell‐related genes (A‐C) and proteins (D) expression in human dental pulp cells (hDPCs) after SCmd treated for 3, 7 and 14 d. Ctrl, control, hDPC cultured with α‐MEM/2% FBS; SCmd, hDPC cultured with Schwann cell conditioned medium. C3, control group cultured for 3 d; S3, SCmd group cultured for 3 d. Error bar, ±SD (n=3), *P<.05, **P<.005
3.3. Schwann cell EVs promoted hDPCs proliferation and self‐renewal
To investigate the specific components in SC secretion, which functioned in promoting cell proliferation, we isolated and collected EVs from SC culture medium without FBS. TEM data showed EVs mostly exhibited 50‐120 nm in diameter (Figure 4A) which were widely defined as exosomes; while, a small population were 120‐500 nm in diameter which were defined as ectosomes.11 And EV lysates were positive for exosome markers, CD9, Hsp70, and low expression level of TSG101, and negative for GAPDH (Figure 4B). EVs were used to treat hDPCs to detect regulatory roles on cell proliferation and we found SC‐EVs enhanced cell proliferation which was consistent with SCmd treatment at a concentration‐dependent manner (Figure 4D).
Figure 4.
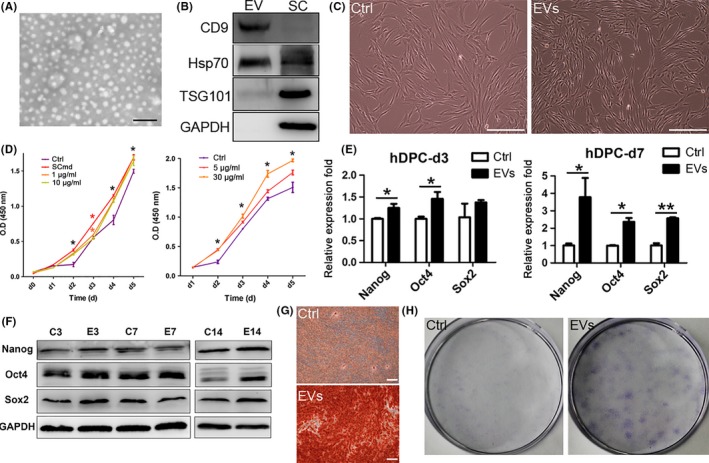
Schwann cell extracellular vesicles (SC‐EVs) treatment on human dental pulp cells (hDPCs). A, Morphology and size of EVs. White spots represent EVs. B, Specific proteins expressed in EVs and SC lysates. C, hDPCs morphology with EVs treated for 3 d. D, Proliferation of hDPCs after treated with SCmd (left) and different concentration of EVs. Black asterisk presents statistic for all the groups and colourful asterisk presents statistic for respective groups. E, Stem cell‐related genes expression in hDPCs after EVs treated for 3 and 7 d. F, Stem cell‐related proteins expression in hDPCs after EVs treated for 3, 7 and 14 d. G, Alizarin red staining of 7 d EV‐treated hDPCs followed by osteogenic induction for 10 d. H, CFU assay was conducted to compare the colony formation rate between EVs treatment and control hDPCs. Purple dots refer to cell colonies. SC, Schwann cell; Ctrl, control, hDPC cultured with α‐MEM/2% FBS; SCmd, hDPC cultured with Schwann cell conditioned medium; EVs, hDPC cultured with α‐MEM/2% FBS containing Schwann cell derived extracellular vesicles. Error bar, ±SD (n≥3), *P<.05, **P<.005. Scale bars: A, 500 nm; C and G, 200 μm
To verify whether EVs were the functional components in SCmd that maintained hDPCs' precursor characteristics, we treated hDPCs with SC‐EVs at a concentration of 15 μg/mL. The expression of stem cell‐related genes, Nanog, Oct4 and Sox2, were significantly upregulated, especially for 7‐day treatment (Figure 4E). In the result of western blot, Nanog, Oct4 and Sox2 upregulated after a 14‐day‐EV treatment (Figure 4F). And CFU assay revealed that EVs enhanced hDPCs self‐renewal capacity (Figure 4H). Interestingly, hDPCs became more stereoscopic and homogeneous when treated with SC‐EVs for 3 days. But in control, substantial cells appeared flat and irregular in morphology (Figure 4C).
3.4. SCmd and SC‐EVs enhanced hDPCs multipotency
Further, we detected whether EVs mediated differentiation competence of hDPCs and the result also came out consistently as SCmd treatment did (Figure 2E,F). Alizarin red positive cells predominantly increased in SC‐EVs‐treated hDPCs compared with control (Figure 4G). Both in the SCmd and SC‐EVs‐treated groups, the expression of osteogenic differentiation‐related genes, Alp, Sp7 and Runx2, as well as matrix protein genes, Bsp and Dmp1, increased (Figure 5A). And adipogenic differentiation‐related genes C/EBPα, Adiponectin, LPL, FABP4 and PPARγ upregulated (Figure 5B) and neurogenic genes Gfap, Nestin and tubb3 statistically upregulated (Figure 5C). Thus, SCmd and SC‐EVs increased the multiple differentiation competences of hDPCs, including osteogenesis, adipogenesis and neurogenesis.
Figure 5.
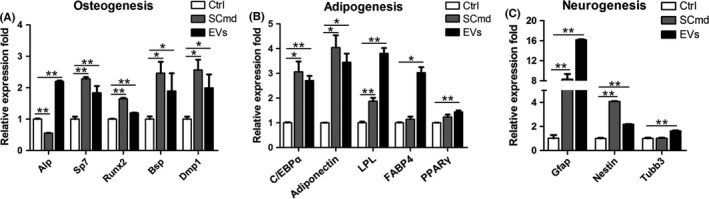
Multilineage differentiation of human dental pulp cells (hDPCs) by SCmd and EVs treatments. A, Osteogenesis‐related genes expression in 7 d osteogenic differentiation induction of hDPCs. B, Adipogenesis‐related genes expression in 7 d adipogenic differentiation induction of hDPCs. C, Neurogenesis‐related genes expression in 1 d neurogenic differentiation induction of hDPCs. All the groups were treated with Ctrl, SCmd and EVs for 7 d before differentiation induction. Ctrl, control, hDPC cultured with α‐MEM/2% FBS; SCmd, hDPC cultured with Schwann cell conditioned medium; EVs, hDPC cultured with α‐MEM/2% FBS containing Schwann cell‐derived extracellular vesicles. Error bar, ±SD (n=3), *P<.05, **P<.005
3.5. Comparison of SC proteome and SC‐EV proteome
Both SC proteome and SC‐EV proteome were analysed by LC‐MS/MS. Totally, we detected 1148 proteins/peptides in the EV sample, among which 937 were common proteins shared with SC sample, while there were 1371 differential proteins appeared only in the SC proteome (Figure 6A). GO terms analysis result exhibited highly similar distribution between SC and EV proteome in cellular component (Figure 6B), molecular function (Figure 6C) and biological process (Figure 6D). Their cellular component mainly concentrated on certain terms including cell and organelle, molecular function mainly concentrated on binding and catalytic activity, and biological process mainly included cellular process, single‐organism process, metabolic process and biological regulation.
Figure 6.
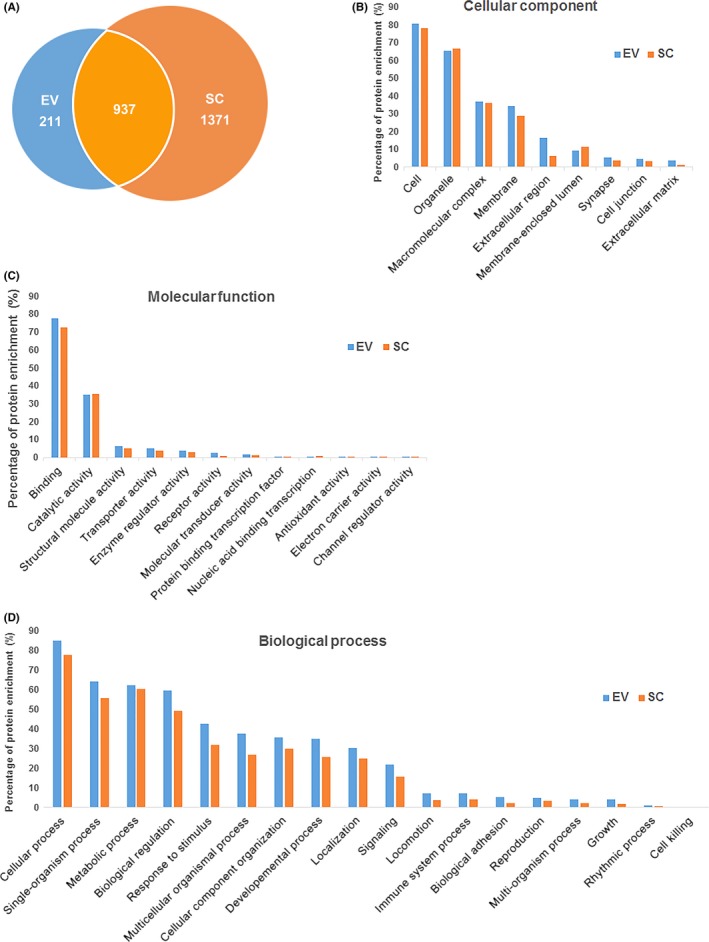
Proteome analysis of extracellular vesicles (EVs) and Schwann cells (SCs) by mass spectrometry. (A) Total numbers of common and unique proteins identified in EV and SC samples. Gene ontology (GO) terms characterized by the most enriched for cellular component (B), molecular function (C) and biological process (D) for proteins in the samples. EV, extracellular vesicle; SC, Schwann cell
As indicated by consistent regulation role of SCmd and EVs, we focused on the common proteins that EV vs SC enrichment folds above 10, and conducted KEGG pathway and GO terms analysis with them. All the relatively enriched proteins covered in the pathways including ECM‐receptor interaction, lysosome, PI3K‐Akt pathway and focal adhesion (Figure 7A). Molecular function mainly lied in binding (Figure 7B), biological process mainly contained cellular process, single‐organism process, biological regulation etc. (Figure 7C), and cellular component mainly distributed in cell, extracellular region and organelle (Figure 7D).
Figure 7.
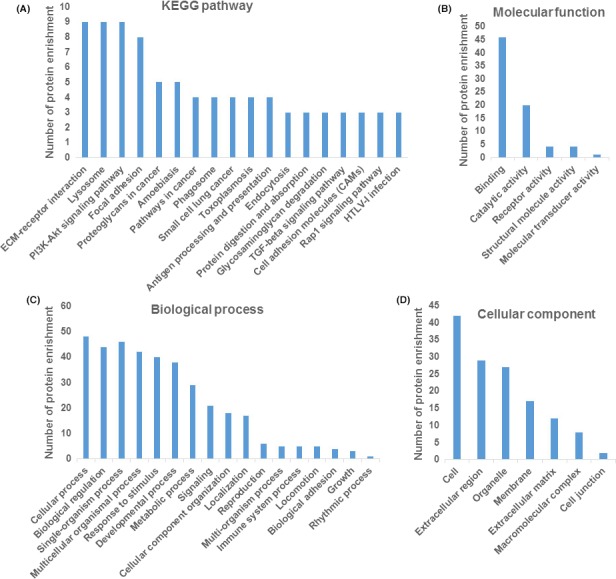
Bioinformatics analysis of co‐expression proteins with enrichment fold above 10 in extracellular vesicles (EV) vs Schwann cells (SC). (A) KEGG pathway analysis of co‐expression proteins enrichment (protein number above 3). GO terms (level 2) characterized by the most enriched for molecular function (B), biological process (C) and cellular component (D) for co‐expression proteins with 10‐fold change in EV vs SC which fulfilled P value <.05 are shown
3.6. TGFβ‐Smad and TGFβ‐MAPK signalling were activated in SCmd and EVs treatments
hDPC was treated with SCmd and SC‐EVs for 7 days, and the results indicated both TGFβ‐Smads signalling and MAPKs were predominantly upregulated after SCmd treatment. TGFβ2 was detected in the SC‐EVs (Figure 8C). Smad2, Smad4, P38, Erk1/2 and JNK, as well as their corresponding phosphorylated proteins p‐Smad2/3, p‐P38, p‐Erk1/2 and p‐JNK, were prominently upregulated by SCmd treatment (Figure 8A,B). And P38 and Erk1/2 showed no apparent changes in EVs treatment; instead, JNK significantly increased by EVs treatment, and p‐JNK and p‐Erk1/2 were somewhat activated (Figure 8B). At mRNA level, it revealed a consistent upregulation trend in Smad2, Smad4 and Mapk1 (Figure 8A).
Figure 8.
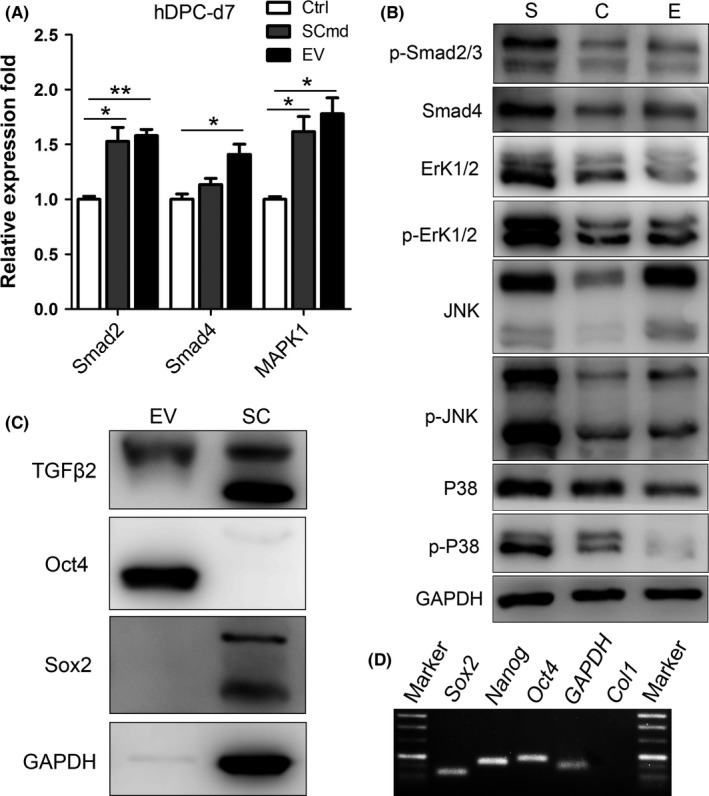
TGFβ/Smad signalling and MAPK signalling. A, Smads and Mapk1 expression in hDPCs with SCmd and EVs treatments. B, TGFβ/Smad signalling and MAPK signalling expression in hDPCs with SCmd and EVs treatments. C, TGFβ2 and stem cell‐related proteins Oct4 and Sox2 expression in EV and SC. D, Agarose gel electrophoresis to detect PCR result of stem cell‐related genes in SC‐EVs mRNA, the white lanes indicated genes. C, Ctrl‐ control, hDPC cultured with α‐MEM/2% FBS; S, SCmd‐ hDPC cultured with Schwann cell conditioned medium; E, EV‐ hDPC cultured with α‐MEM/2% FBS containing Schwann cell‐derived extracellular vesicles; SC, Schwann cell. Error bar, ±SD (n=3), *P<.05, **P<.005
Particularly, we checked the stem cell‐related genes and proteins expression in SC‐EVs, and found Oct4 was predominantly expressed and no obvious Sox2 was detected (Figure 8C). And in SC‐EVs mRNA, we detected expression of Sox2, Nanog and Oct4, while GAPDH, Col1 served as a negative control was not detected (Figure 8D), suggesting there is stem cell‐related genes and proteins expression in SC‐EVs.
4. DISCUSSION
Schwann cell originates from neural crest cell along with MSC.10 Although SC morphology is different from MSC, there are similarities between them. They both provide great potential for injury therapy and tissue regeneration. On gene expression level, GFAP and Nestin, which are markers of neural precursor cells or SCs,36, 37 predominantly expressed in hDPCs (Figure 1). On the other hand, SC‐EVs regulated target cell in a similar manner as MSC exosomes, promoting cell growth and survival.38, 39 MSC‐derived EVs or exosomes (MSC‐EVs) were extensively studied for the great clinical therapy potential of MSCs. SC‐EVs significantly promoted hDPCs proliferation which was indicated by our results, and MSC‐EVs promote axonal growth.40 SC‐EVs elevated the expression of Sox2, Oct4 and Nanog in hDPCs. Similarly, placenta MSC‐derived exosomes increased the expression of stem cell‐related genes Oct4 and Nanog in target cells.41 All these together may suggest the homology between SCs and dental mesenchymal cells.
In this study, we demonstrated that SCmd, as well as SC‐EVs, predominantly promoted hDPC proliferation. Accumulated data indicated EVs were significant mediators for intercellular communication, transporting various molecules, including trophic factors, transcription factors, cytokines and chemokine.42, 43 Earlier investigation revealed exosomes could be ingested by target cells through membrane fusion or endocytosis.44 And all cargo released into the target cells, and then modified corresponding regulatory signalling. Further, we found that hDPCs treated with both SCmd and EVs increased the TGFβ/Smad signalling and MAPK signalling. TGFβs and MAPKs were extensively studied cytokines that modulated cell survival, proliferation, inflammation and apoptosis.45, 46, 47, 48 Non‐myelinating SC exclusively produced active TGFβ to sustain dormant haematopoietic stem cells in bone marrow niche.49 Schwann cell highly expressed TGFβ2 (Figure 8C). In parallel, TGFβ2 was detected in SC‐EVs, and TGFβ1 and TGFβ2 showed high iBAQ level in SC‐EVs mass spectrometry results (data not listed) which might implicate that SCmd and EVs activated the TGFβ signalling in hDPC to regulate cell growth. TGFβ‐Smad signalling was well‐documented to arrest cell proliferation, and it potentially indicated that TGFβ regulated hDPCs proliferation mainly through Smad‐independent pathway in our study.50 Meanwhile, we found three classic MAPKs—Erk1/2, P38, JNK and their respective activate forms—p‐Erk1/2, p‐P38, p‐JNK—were upregulated, especially in SCmd treatment. MAPKs were recognized to be tightly connected to cell survival and growth pathways.47 These might suggest TGFβ from SCmd and EVs participate in both Smad‐dependent and ‐independent signallings to mediate hDPC proliferation. In addition, the slight differential expression in TGFβ signalling between the SCmd and EVs treatments may be caused by other growth factors or NTs secreted by SCs.
Here, we demonstrated that hDPCs maintained strong self‐renewal ability and elevated the multidifferentiation capability in the case of osteogenic/adipogenic/neurogenic differentiation stimuli when treated with SCmd and SC‐EVs. Three canonical stem cell‐related genes or proteins Sox2, Nanog and Oct4 which were proved to contribute to cell multipotency and self‐renewal were significantly upregulated.51, 52, 53
Earlier data conclude two possible mechanisms that EVs regulate recipient cells. One is that EVs membrane proteins directly or indirectly interact with target cells and activate intracellular signalling. The other way is that EVs fuse with target cell membrane or are endocytosed by target cells and release their component into target cells in a non‐selective way.54 Subsequently, we detected a relatively high level of Sox2, Nanog and Oct4 expression in SC‐EVs mRNA and abundant Oct4 enrichment in SC‐EVs proteins (Figure 8). In consistent with this, Oct4 expression in hDPCs was upregulated throughout EVs treatment (Figure 3). Based on these results, we hypothesized that EVs regulated hDPCs multipotency and self‐renewal by membrane fusion or endocytosis and directly transferred Sox2, Nanog and Oct4. EVs‐originated Sox2, Nanog and Oct4 enhanced endogenous transcription in target cells. These three transcription factors were widely expressed in embryonic stem cells (ESCs), and recognized as the core transcription factors in regulating and maintaining ESCs self‐renewal and multipotency.55 It has been clearly clarified that Oct4 served as one crucial inducer in generating induced pluripotent stem cell, and showed a master regulating role in stem cell maintaining.56, 57, 58, 59 In this study, we proved that all the SCmd‐ and EV‐treated groups (d3, d7, d14) showed upregulated and abundant Oct4 expression in EVs. It suggested that horizontal transfer of Oct4 was responsible for the enhanced self‐renewal and multipotency of hDPCs.
From SC proteome and SC‐EV proteome analysis, various proteins involved in cell survival were identified. Through KEGG pathways and GO terms, proteins localized in extracellular region and participated in endocytosis showed high rates in EVs (Figures 6 and 7), which was in accordance with the biogenesis of EVs.14 Among the relatively enriched proteins in SC‐EVs, three TGFβ signalling molecules (TGFβ1, TGFβ2 and TGFβ3) highly expressed, contributing to our conclusion that TGFβ ligands from EV activated growth‐related signalling in hDPCs, and modulated cell proliferation and differentiation.
Our study implicated a novel function for SC‐EVs that regulated dental MSCs proliferation and maintained the multipotency and self‐renewal capacities, especially hDPCs, which are widely used seeding cells in tooth regeneration. In terms of the high accordance in GO terms analysis between SC‐EVs and SCs proteomes, as well as the similar regulating roles on hDPCs, we hypothesize that SC‐EVs are promising materials to be used for tooth regenerative engineering and clinical therapy. Compared to cell therapy, EVs eliminate appropriate immune reaction, carcinogenic risk, stem cell differentiation in vivo, and can be easily delivered to injured tissues in vivo for their characterization of small nanometre size, thus providing great application potential for tissue regeneration.
COMPETING FINANCIAL INTERESTS
The authors declare no competing financial interests.
Supporting information
ACKNOWLEDGEMENTS
This study was supported by National Natural Science Foundation of China (81271119, 31470947) and Basic Research Program of Sichuan Province (2013JY0019).
Li Z, Liang Y, Pan K, et al. Schwann cells secrete extracellular vesicles to promote and maintain the proliferation and multipotency of hDPCs. Cell Prolif. 2017;50:e12353 10.1111/cpr.12353
Contributor Information
Guoqing Chen, Email: chen21gq@163.com.
Weidong Tian, Email: drtwd@sina.com.
REFERENCES
- 1. Kuffler DP. Promoting and directing axon outgrowth. Mol Neurobiol. 1994;9:233‐243. [DOI] [PubMed] [Google Scholar]
- 2. Lewin GR, Barde YA. Physiology of the neurotrophins. Annu Rev Neurosci. 1996;19:289‐317. [DOI] [PubMed] [Google Scholar]
- 3. Chernousov MA, Carey DJ. Schwann cell extracellular matrix molecules and their receptors. Histol Histopathol. 2000;15:593‐601. [DOI] [PubMed] [Google Scholar]
- 4. Dezawa M, Nagano T. Contacts between regenerating axons and the Schwann cells of sciatic nerve segments grafted to the optic nerve of adult rats. J Neurocytol. 1993;22:1103‐1112. [DOI] [PubMed] [Google Scholar]
- 5. Haninec P, Dubový P, Houšt'ava L, Stejskal L. Acellular nerve graft re‐seeded by Schwann cells migrating from the nerve stump can stimulate spinal motoneurons for functional reinnervation of the rat muscle. Ann Anat. 2000;182:123‐131. [DOI] [PubMed] [Google Scholar]
- 6. Mizuno N, Shiba H, Xu WP, et al. Effect of neurotrophins on differentiation, calcification and proliferation in cultures of human pulp cells. Cell Biol Int. 2007;31:1462‐1469. [DOI] [PubMed] [Google Scholar]
- 7. Nosrat CA, Fried K, Lindskog S, Olson L. Cellular expression of neurotrophin mRNAs during tooth development. Cell Tissue Res. 1997;290:569‐580. [DOI] [PubMed] [Google Scholar]
- 8. Yamamoto T, Osako Y, Ito M, et al. Trophic effects of dental pulp stem cells on Schwann cells in peripheral nerve regeneration. Cell Transplant. 2015;25:1‐30. [DOI] [PubMed] [Google Scholar]
- 9. Chai Y, Jiang X, Ito Y, et al. Fate of the mammalian cranial neural crest during tooth and mandibular morphogenesis. Development. 2000;127:1671‐1679. [DOI] [PubMed] [Google Scholar]
- 10. Kaukua N, Shahidi MK, Konstantinidou C, et al. Glial origin of mesenchymal stem cells in a tooth model system. Nature. 2014;513:551‐554. [DOI] [PubMed] [Google Scholar]
- 11. Choi D‐S, Kim D‐K, Kim Y‐K, Gho YS. Proteomics, transcriptomics and lipidomics of exosomes and ectosomes. Proteomics. 2013;13:1554‐1571. [DOI] [PubMed] [Google Scholar]
- 12. Ratajczak J, Wysoczynski M, Hayek F, Janowska‐Wieczorek A, Ratajczak MZ. Membrane‐derived microvesicles: important and underappreciated mediators of cell‐to‐cell communication. Leukemia. 2006;20:1487‐1495. [DOI] [PubMed] [Google Scholar]
- 13. Lai RC, Arslan F, Lee MM, et al. Exosome secreted by MSC reduces myocardial ischemia/reperfusion injury. Stem Cell Res. 2010;4:214‐222. [DOI] [PubMed] [Google Scholar]
- 14. Cocucci E, Meldolesi J. Ectosomes and exosomes: shedding the confusion between extracellular vesicles. Trends Cell Biol. 2015;25:364‐372. [DOI] [PubMed] [Google Scholar]
- 15. Mosahebi A, Fuller P, Wiberg M, Terenghi G. Effect of allogeneic Schwann cell transplantation on peripheral nerve regeneration. Exp Neurol. 2002;173:213‐223. [DOI] [PubMed] [Google Scholar]
- 16. Lopez‐Verrilli MA, Picou F, Court FA. Schwann cell‐derived exosomes enhance axonal regeneration in the peripheral nervous system. Glia. 2013;61:1795‐1806. [DOI] [PubMed] [Google Scholar]
- 17. Arthur A, Rychkov G, Shi S, Koblar SA, Gronthos S. Adult human dental pulp stem cells differentiate toward functionally active neurons under appropriate environmental cues. Stem Cells. 2008;26:1787‐1795. [DOI] [PubMed] [Google Scholar]
- 18. Ellis KM, O'Carroll DC, Lewis MD, Rychkov GY, Koblar SA. Neurogenic potential of dental pulp stem cells isolated from murine incisors. Stem Cell Res Ther. 2014;5:30. [DOI] [PMC free article] [PubMed] [Google Scholar]
- 19. Martens W, Sanen K, Georgiou M, et al. Human dental pulp stem cells can differentiate into Schwann cells and promote and guide neurite outgrowth in an aligned tissue‐engineered collagen construct in vitro . FASEB J. 2014;28:1634‐1643. [DOI] [PMC free article] [PubMed] [Google Scholar]
- 20. Yang C, Sun L, Li X, et al. The potential of dental stem cells differentiating into neurogenic cell lineage after cultivation in different modes in vitro . Cell Reprogram. 2014;16:1‐13. [DOI] [PubMed] [Google Scholar]
- 21. Tuszynski MH, Weidner N, Mccormack M, Miller I, Powell H, Conner J. Grafts of genetically modified Schwann cells to the spinal cord: survival, axon growth, and myelination. Cell Transplant 1998;7:187‐196. [DOI] [PubMed] [Google Scholar]
- 22. Lai RC, Tan SS, Teh BJ, et al. Proteolytic potential of the MSC exosome proteome: implications for an exosome‐mediated delivery of therapeutic proteasome. Int J Proteomics. 2012;2012:971907. [DOI] [PMC free article] [PubMed] [Google Scholar]
- 23. Lai RC, Chen TS, Lim SK. Mesenchymal stem cell exosome: a novel stem cell‐based therapy for cardiovascular disease. Regen Med. 2011;6:481‐492. [DOI] [PubMed] [Google Scholar]
- 24. Guo L, Li J, Qiao X, et al. Comparison of odontogenic differentiation of human dental follicle cells and human dental papilla cells. PLoS ONE. 2013;8:e62332. [DOI] [PMC free article] [PubMed] [Google Scholar]
- 25. Thery C, Amigorena S, Raposo G, Clayton A. Isolation and characterization of exosomes from cell culture supernatants and biological fluids. Curr Protoc Cell Biol. 2006;Chapter 3:Unit 3 22. [DOI] [PubMed] [Google Scholar]
- 26. Hedrick MH, Zuk PA, Zhu M, et al. Human adipose tissue is a source of multipotent stem cells. Mol Biol Cell. 2002;13:4279‐4295. [DOI] [PMC free article] [PubMed] [Google Scholar]
- 27. Wiśniewski JR, Zougman A, Nagaraj N, Mann M. Universal sample preparation method for proteome analysis. Nat Methods. 2009;6:359‐362. [DOI] [PubMed] [Google Scholar]
- 28. Cox J, Mann M. MaxQuant enables high peptide identification rates, individualized p.p.b.‐range mass accuracies and proteome‐wide protein quantification. Nat Biotechnol. 2008;26:1367‐1372. [DOI] [PubMed] [Google Scholar]
- 29. The UniProt Consortium . Update on activities at the universal protein resource (UniProt) in 2013. Nucleic Acids Res. 2013;41:D43‐D47. [DOI] [PMC free article] [PubMed] [Google Scholar]
- 30. Al‐Shahrour F, Minguez P, Tárraga J, et al. BABELOMICS: a systems biology perspective in the functional annotation of genome‐scale experiments. Nucleic Acids Res. 2006;34:W472‐W476. [DOI] [PMC free article] [PubMed] [Google Scholar]
- 31. Schwanhäusser B, Busse D, Li N. Global quantification of mammalian gene expression control. Nature. 2011;473:337‐342. [DOI] [PubMed] [Google Scholar]
- 32. Wilhelm M, Schlegl J, Hahne H, et al. Mass‐spectrometry‐based draft of the human proteome. Nature. 2014;509:582‐587. [DOI] [PubMed] [Google Scholar]
- 33. Zhang J, Wang JH‐C. Kartogenin induces cartilage‐like tissue formation in tendon‐bone junction. Bone Res. 2014;2:12‐17. [DOI] [PMC free article] [PubMed] [Google Scholar]
- 34. Zhao H, Feng J, Seidel K, et al. Secretion of shh by a neurovascular bundle niche supports mesenchymal stem cell homeostasis in the adult mouse incisor. Cell Stem Cell. 2014;14:160‐173. [DOI] [PMC free article] [PubMed] [Google Scholar]
- 35. Bridenbaugh S, Kenins L, Bouliong‐Pillai E, et al. Clinical stem‐cell sources contain CD8+CD3+ T‐cell receptor‐negative cells that facilitate bone marrow repopulation with hematopoietic stem cells. Blood. 2008;111:1735‐1738. [DOI] [PubMed] [Google Scholar]
- 36. Mii S, Amoh Y, Katsuoka K, Hoffman RM. Comparison of nestin‐expressing multipotent stem cells in the tongue fungiform papilla and vibrissa hair follicle. J Cell Biochem. 2014;115:1070‐1076. [DOI] [PubMed] [Google Scholar]
- 37. Vukojevic K, Petrovic D, Saraga‐Babic M. Nestin expression in glial and neuronal progenitors of the developing human spinal ganglia. Gene Expr Patterns. 2010;10:144‐151. [DOI] [PubMed] [Google Scholar]
- 38. Zhu W, Huang L, Li Y, et al. Exosomes derived from human bone marrow mesenchymal stem cells promote tumor growth in vivo . Cancer Lett. 2012;315:28‐37. [DOI] [PubMed] [Google Scholar]
- 39. Lai RC, Yeo RWY, Lim SK. Mesenchymal stem cell exosomes. Semin Cell Dev Biol. 2015;40:82‐88. [DOI] [PubMed] [Google Scholar]
- 40. Zhang Y, Chopp M, Liu XS, et al. Exosomes derived from mesenchymal stromal cells promote axonal growth of cortical neurons. Mol Neurobiol. 2017;54:2659‐2673. [DOI] [PMC free article] [PubMed] [Google Scholar]
- 41. Tooi M, Komaki M, Morioka C, et al. Placenta mesenchymal stem cell derived exosomes confer plasticity on fibroblasts. J Cell Biochem. 2015;13:1‐13. [DOI] [PubMed] [Google Scholar]
- 42. Haynesworth SE, Baber MA, Caplan AI. Cytokine expression by human marrow‐derived mesenchymal progenitor cells in vitro: effects of dexamethasone and IL‐1 alpha J Cell Physiol. 1996;166:585‐592. [DOI] [PubMed] [Google Scholar]
- 43. Caplan AI, Dennis JE. Mesenchymal stem cells as trophic mediators. J Cell Biochem 2006;98:1076‐1084. [DOI] [PubMed] [Google Scholar]
- 44. Aga M, Bentz GL, Raffa S, et al. Exosomal HIF1α supports invasive potential of nasopharyngeal carcinoma‐associated LMP1‐positive exosomes. Oncogene. 2014;33:4613‐4622. [DOI] [PMC free article] [PubMed] [Google Scholar]
- 45. Massagué J. TGFβ in cancer. Cell. 2008;134:215‐230. [DOI] [PMC free article] [PubMed] [Google Scholar]
- 46. Siegel PM, Massagué J. Cytostatic and apoptotic actions of TGF‐beta in homeostasis and cancer. Nat Rev Cancer. 2003;3:807‐821. [DOI] [PubMed] [Google Scholar]
- 47. Zhang W, Liu HT, Tu LIUH. MAPK signal pathways in the regulation of cell proliferation in mammalian cells. Cell Res. 2002;12:9‐18. [DOI] [PubMed] [Google Scholar]
- 48. Armstrong L, Hughes O, Yung S, et al. The role of PI3K/AKT, MAPK/ERK and NFκβ signalling in the maintenance of human embryonic stem cell pluripotency and viability highlighted by transcriptional profiling and functional analysis. Hum Mol Genet. 2006;15:1894‐1913. [DOI] [PubMed] [Google Scholar]
- 49. Yamazaki S, Ema H, Karlsson G, et al. Nonmyelinating schwann cells maintain hematopoietic stem cell hibernation in the bone marrow niche. Cell. 2011;147:1146‐1158. [DOI] [PubMed] [Google Scholar]
- 50. Karlsson G, Blank U, Moody JL, et al. Smad4 is critical for self‐renewal of hematopoietic stem cells. J Exp Med. 2007;204:467‐474. [DOI] [PMC free article] [PubMed] [Google Scholar]
- 51. Tsai CC, Su PF, Huang YF, Yew TL, Hung SC. Oct4 and Nanog directly regulate Dnmt1 to maintain self‐renewal and undifferentiated state in mesenchymal stem cells. Mol Cell. 2012;47:169‐182. [DOI] [PubMed] [Google Scholar]
- 52. Chambers I, Colby D, Robertson M, et al. Functional expression cloning of Nanog, a pluripotency sustaining factor in embryonic stem cells. Cell. 2003;113:643‐655. [DOI] [PubMed] [Google Scholar]
- 53. Marthaler AG, Adachi K, Tiemann U, et al. Enhanced OCT4 transcriptional activity substitutes for exogenous SOX2 in cellular reprogramming. Sci Rep. 2016;6:19415. [DOI] [PMC free article] [PubMed] [Google Scholar]
- 54. Mathivanan S, Ji H, Simpson RJ. Exosomes: extracellular organelles important in intercellular communication. J Proteomics 2010;73:1907‐1920; Elsevier B.V. [DOI] [PubMed] [Google Scholar]
- 55. Rodda DJ, Chew JL, Lim LH, et al. Transcriptional regulation of Nanog by OCT4 and SOX2. J Biol Chem. 2005;280:24731‐24737. [DOI] [PubMed] [Google Scholar]
- 56. Takahashi K, Yamanaka S. Induction of pluripotent stem cells from mouse embryonic and adult fibroblast cultures by defined factors. Cell. 2006;126:663‐676. [DOI] [PubMed] [Google Scholar]
- 57. Yu J, Vodyanik MA, Smuga‐Otto K, et al. Induced pluripotent stem cell lines derived from human somatic cells. Science. 2007;318:1917‐1920. [DOI] [PubMed] [Google Scholar]
- 58. Masui S, Nakatake Y, Toyooka Y, et al. Pluripotency governed by Sox2 via regulation of Oct3/4 expression in mouse embryonic stem cells. Nat Cell Biol. 2007;9:625‐U26. [DOI] [PubMed] [Google Scholar]
- 59. Radzisheuskaya A, Chia GB, dos Santos RL, et al. A defined Oct4 level governs cell state transitions of pluripotency entry and differentiation into all embryonic lineages. Nat Cell Biol 2013;15:579‐590. [DOI] [PMC free article] [PubMed] [Google Scholar]
Associated Data
This section collects any data citations, data availability statements, or supplementary materials included in this article.
Supplementary Materials