

Abstract
Objectives
The crosstalk between chondrocytes and adipose‐derived stem cells (ADSCs) could regulate the secretion of multiple growth factors. However, it is not clear how the paracrine action in co‐culture systems affect cell migration. This study focused on the changes of cell migration of ADSCs and chondrocytes in co‐culture conditions.
Materials and methods
Primary ADSCs and chondrocytes were isolated from Sprague‐Dawley rat. Transwell co‐culture systems, inoculated with ADSCs and chondrocytes, were established in vitro. The morphology of the cells was observed 7 days post‐seeding by inverted phase‐contrast microscope. Additionally, the cytoskeleton changes were investigated by immunofluorescence staining. To detect the abundance of Vinculin, we used immunofluorescence and Western blotting. Additionally, the expression level of MMP‐2, Hey1 and Hes1 was examined to determine the mechanisms of co‐culture‐induced cell migration changes.
Results
The migration of ADSCs and chondrocytes in co‐culture conditions significantly decreased compared with that in mono‐culture groups, accompanied by the decrease of filopodia and the expression level of MMP‐2.
Conclusions
The overall study showed that the migration of ADSCs and chondrocytes differs significantly depending on culture conditions. Moreover, the Notch signalling pathway may be involved in this process. Accordingly, by studying changes in migration caused by co‐culture, we obtained new insight into the crosstalk between ADSCs and chondrocytes.
1. INTRODUCTION
Over the past few decades, great improvements in tissue engineering have resulted from the use of co‐culture systems.1 The co‐culture system was first established to explore intercellular communication in 1978.2 Today, it is widely used for many purposes, such as to induce cell differentiation,3 maintain cell function and viability, regulate cell proliferation,4 promote early embryonic development5 and increase metabolic yield.6 Cell co‐culture could simulate cell communication and the formation of tissue structure, and therefore has great potential in tissue engineering and regenerative medicine.7
In the field of cartilage tissue engineering, the treatment of cartilage defects has always been a problem.8 Cartilage tissue is composed of collagen tissue, a small number of cells, and 60%‐80% of water and other ingredients.9, 10 Adult cartilage tissue has no blood vessels or nerves, resulting in limited self‐healing ability.11 Nowadays, a number of methods have been developed for cartilage regeneration.12 Co‐culture of other cell types (such as stem cells) with chondrocytes is considered a significant alternative because of the limited number of cells obtained from autologous cartilage.13, 14 Our previous studies have shown that crosstalk between ADSCs and CH causes changes in the expression of BMP family genes and angiogenesis‐related factors.11 In co‐cultured ADSCs, the mRNA level of transforming growth factor‐beta1 (TGF‐β1), hypoxia‐inducible factor‐1a (HIF‐1a) and vascular endothelial growth factor B (VEGFB) was significantly increased. In chondrocytes co‐cultured with ADSCs, the expression of Aggrecan and HIF‐1a gene was up‐regulated.11, 14 Transforming growth factor‐beta1 is a crucial requirement for the chondrogenesis of stem cells, which could increase the expression of extracellular cartilage matrix such as collagen II and Aggrecan.15, 16, 17 Additionally, VEGF is considered as a survival and maturation factor in the process of cartilaginous template formation.18 In addition, we proved that the implantation of ADSCs and chondrocytes into TGF‐β1/scaffolds showed promising potential in vivo cartilage healing.
Cell migration is a basic cellular behaviour and plays key roles in embryonic development, angiogenesis, wound healing, immune responses, atherosclerosis and cancer metastasis.19, 20 It is a multi‐step process involving the extension of pseudopodia, new adhesion establishment and cell contraction.21, 22, 23 However, few studies have focused on cell migration in co‐culture conditions, despite its importance as a cellular behaviour.
The Notch signalling pathway is a highly conserved network that is essential for regulating cellular proliferation and differentiation during developmental process.24, 25, 26 It has been shown that Notch signalling also plays a role in cell migration.27 However, the role of the Notch signalling pathway in cell migration in co‐culture systems has not been fully understood. In mammals, there are five Notch ligands (Delta‐like [Dll] 1, 3, 4, and Jagged 1, 2) and four Notch receptors (Notch 1‐4). Interaction of Notch ligand and receptor of the adjacent cells facilitates the production and release of Notch signal proteins into the cytoplasm. The transcriptional activator complex of the Notch signalling pathway thus activates HES, HEY, HERP and other target genes.28
To improve our understanding of cell migration in co‐culture systems, we examined the migration of adipose‐derived stem cells (ADSCs) and chondrocytes (CHs) in mono‐culture and co‐culture conditions. We used the xCELLigence DP RTCA instrument (Roche Diagnostics, Basel, Switzerland) as a non‐invasive and label‐free method to detect cell migration. The xCELLigence system conducts real‐time monitoring of cell proliferation, migration and invasion via a culture plate with interdigitated gold microelectrodes. The activity of the cells on the plate causes a change in electrical impedance and is detected by the RTCA station.29, 30 Moreover, to explore the mechanisms underlying changes in cell migration, we also examined the abundance of filopodia, the secretion of MMP‐2, the expression of Vinculin and the involvement of the Notch signalling pathway.
2. MATERIALS AND METHODS
2.1. Cell isolation and culture
Adipose‐derived stem cells were isolated from subcutaneous adipose tissue of 7‐day female SD rats. Minced fat was digested with collagenase I for 60 minutes. Then it was neutralized with 10% foetal bovine serum (FBS)‐supplemented low‐glucose DMEM. The suspension was centrifuged at 200 g for 5 minutes. Subsequently, removed supernatant and ADSCs were resuspended by adding 10% FBS low‐glucose DMEM. Following, ADSCs were inoculated in T25 flasks and cultured at 37°C in a 5% CO2 incubator and passed through to passage 3 to obtain purified ADSCs.
Chondrocytes were isolated from the knee cartilage of 3‐ to 5‐day SD rats. Briefly, the cartilage was cut into small pieces. They were pre‐treated with 0.25% trypsin for 30 minutes and then washed three times with phosphate‐buffered saline (PBS) to remove trypsin. Subsequently, the cartilage tablets were digested with collagenase type II (0.1%) for 2‐3 hours in a 37° water bath. After 5‐minute centrifugation at 200 g, the mixed cartilage and chondrocytes were suspended in low‐glucose DMEM with 10% FBS. Chondrocytes were then inoculated in T25 flasks and cultured at 37°C in a 5% CO2 incubator and passed through passage 3 to obtain purified CHs.
2.2. Co‐culture of ADSCs and chondrocytes
In order to detect the migration of ADSCS and chondrocytes under different culture conditions, we co‐cultured ADSCS and chondrocytes with transwell (0.4 mm). The ADSCs were seeded on a six‐well plate (85%‐95% concentration) and chondrocytes in the transwell chamber similarly, chondrocytes in six‐wel plate and ADSCs in transwell chamber were also used for detection After 24 hours of equilibration, the medium was exchanged with 2% FBS low‐glucose DMEM. After 12 hours of starvation, the medium was replaced with fresh 1% FBS low‐glucose DMEM and transwell chamber and plates were placed together.
2.3. Immunofluorescent staining
We investigated the cytoskeleton morphology and Vinculin protein expression of ADSCs and chondrocytes by immunofluorescent staining. Briefly, the cells were washed three times with PBS and then fixed with 4% paraformaldehyde. The samples were permeabilized with Triton X‐100. After blocking for 1 hour with goat serum at 37°C, the samples were incubated with primary antibody solution (against Vinculin, ab73412; Abcam, Cambridge, UK) overnight. Subsequently, the cells were treated with anti‐rabbit secondary antibody at 37°C for 1 hour. Next, the samples were treated with rhodamine phalloidin and 2‐(4‐Amidinophenyl)‐6‐indolecarbamidine dihydrochloride (DAPI) to observe the F‐actin and nucleus of the cells. Immunofluorescence micrographs were obtained using a microscope.
2.4. Wound healing assay
We detected horizontal migration of cultured ADSCs and chondrocytes using wound healing assay. In brief, ADSCs and chondrocytes were seeded at 1 × 10⁴ cells per cm2 (six‐well plates, Corning, NY, USA) at 37°C under 5% CO2. After 24 hours of equilibration, the medium was exchanged with 2% FBS low‐glucose DMEM. After 12 hours of starvation, the medium was replaced with fresh 1% FBS low‐glucose DMEM. A sterile pipette tip was used to scratch the adherent cells to form a wound. The cell debris was washed with PBS. Finally, cells were exposed to 1% FBS low‐glucose DMEM and photographed at 0 and 24 hours after incubation. The wound areas were measured using Image J. (NIH, Bethesda, MD, USA).
2.5. Real‐time cell analysis of cell migration (RTCA)
Real‐time cell analysis (RTCA) of cell migration was investigated using xCELLigence DP RTCA instrument. Firstly, fresh low‐glucose DMEM containing 1% FBS was added to the lower chamber and upper chamber. Then the solution was equilibrated in the incubator for 1 hour to establish a background reading. Subsequently, 6 × 10⁵ cells/well were inoculated on the chamber with porous membrane. The migrating cells migrate to the lower side of the membrane, where they will be detected by the electrode. The cell migration plate was placed on the RTCA station and the cell index was measured every 15 minutes with RTCA software.
2.6. Gelatin zymography
The activity of MMP‐2 from the supernatant was determined by gelatin zymography. Briefly, the samples were electrophoresed by sodium dodecyl sulfate‐polyacrylamide gel electrophoresis (SDS‐PAGE, containing 0.05% gelatin). Followed by incubation in 2.5% Triton X‐100 for 0.5 hour for three times, the samples were incubated in proteolytic buffer (50 mmol/L CaCl2, 0.5 mol/L NaCl, 50 mmol/L Tris, pH 7.8) at 37°C for 12‐16 hours. Finally, the gel was stained with coomassie brilliant blue for 1 hour. After decolorization, the strength of the bands is proportional to the activity of MMP‐2. The optical density of the bands was analysed by gel image analysis system Image‐Pro Plus (Media Cybernetics, Silver Spring, USA) and the statistical analysis of the data was performed.
2.7. Quantitative real‐time PCR (qPCR)
Briefly, MMP‐2, Hey1 and Hes1 mRNA level was detected using qPCR. Total mRNA was extracted from ADSCS and chondrocytes using TRIzol (Sigma, St. Louis, MO, USA). After treatment with DNase I, the samples were reverse transcribed using the first‐strand cDNA synthesis kit (Fermentas, Burlington, Canada) to generate cDNA. The selected primers are listed in Table 1. The efficiency of PCR experiments was normalized by the amplification of GAPDH and amplified the target mRNA with SYBR Green I PCR Master Mix. The reaction was carried out using a ABI 7300 thermal cycler (Applied Biosystems, Foster, CA, USA) and the procedure was as follows: denaturation at 95°C for 30 seconds, followed by denaturation at 95°C for 5 seconds and 40°C at for 40 cycles.
Table 1.
Sequences of forward and reverse primers of selected genes designed for qPCR
| mRNA | Gene ID | Primer pairs | |
|---|---|---|---|
| GAPDH | 24383 | Forward | ACAGCAACAGGGTGGTGGAC |
| Reverse | TTTGAGGGTGCAGCGAACTT | ||
| MMP‐2 | 81686 | Forward | TGGTGTGGCACCACCGAGGA |
| Reverse | CCTTGCCATCGCTTCGGCCA | ||
| Hey1 | 155437 | Forward | ACATCACCCACACATCGCAC |
| Reverse | GAGAGGTGGAAGGCGAGAGTA | ||
| Hes1 | 29577 | Forward | GCTGGAGAGGCTGCCAAGGT |
| Reverse | GGTCCCGCTGTTGCTGGTGT |
2.8. Western blot analysis
The expression level of Vinculin, Hey1 and Hes1 protein in ADSCs and chondrocytes was detected by Western blot analysis. Proteins samples were extracted at 1, 2, 3 and 5 days using a Total Protein Extraction Kit (KeyGen, Nanjing, China). Then, the lysate was shaken at 4°C for 1 minute for three times. Subsequently, protein samples and protein loading buffer (5X) were mixed and boiled in boiling water bath for 3‐5 minutes to fully denature the protein. The samples were then separated by SDS‐PAGE on a polyacrylamide gel at 300 V for 30 minutes. Subsequently, the isolated protein was transferred to a polyvinylidene fluoride film and blocked in skim milk at room temperature for 1 hour. The primary antibody to GAPDH, Vinculin‐specific antibody (Abcam), Hey1 (Abcam) or Hes1 (Abcam) were added and incubated at 4°C overnight. The samples were then incubated at room temperature with a secondary antibody for 1 hour. The film was washed three times with TBST (Tris buffered saline +Tween). The film was soaked in the luminescent solution and then exposed.
2.9. Statistical analysis
All experiments were performed in triplicate and repeated at least three times. Statistical analysis was conducted using SPSS 16.0 (IBM, Armonk, NY, USA). Comparisons between the samples were performed with independent sample t test analysis. Differences were considered significant if the two‐tailed P‐value was less than 0.05.
3. RESULTS
3.1. Morphological features of ADSCs and chondrocytes in mono‐ and co‐culturing conditions
The cell morphology of ADSCs and chondrocytes was observed with phase‐contrast microscopy (Figure 1A). It showed that low concentrations of serum in the culture medium maintained normal cell viability and cell integrity. Phalloidin staining was used to investigate the distribution of F‐actin. The immunofluorescence images show that cells in mono‐culture groups employed more filopodia than that in co‐culture groups, suggesting a more significant cell migration in mono‐culture groups (Figure 1B).
Figure 1.
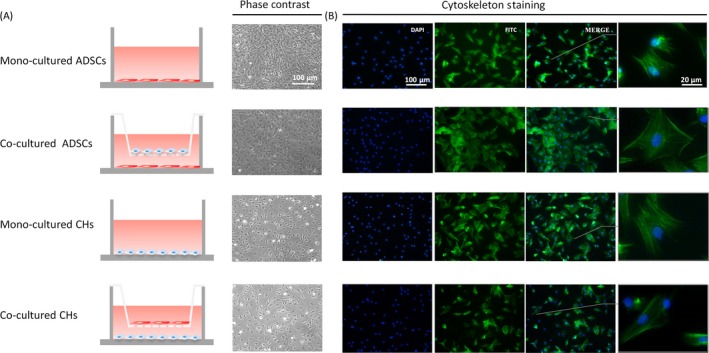
Cell morphologies and cell behaviours of adipose‐derived stem cells (ADSCs) and chondrocytes. A, Schematic illustration of the transwell co‐culture systems. Cell morphologies of ADSCs and chondrocytes after 7 days of mono‐ and co‐culture are shown in phase‐contrast. B, Fluorescent images of nucleus (blue) and cytoskeleton (green) at day 5 post‐seeding.
3.2. The migration of ADSCs and chondrocytes in bidirectional wound healing assay
In order to explore the changes in horizontal migration of ADSCs and chondrocytes in mono‐culture and co‐culture systems, in vitro wound healing assays were employed. As shown in Figure 2A, ADSCs and chondrocytes migrated to the wound area in 24 hours. Statistical analysis was performed by calculating the wound area of each group with Image J (NIH, Bethesda, MD, USA) and the results showed that the wound area of ADSCs and chondrocytes under mono‐culture conditions was significantly smaller than co‐culture (Figure 2B).
Figure 2.
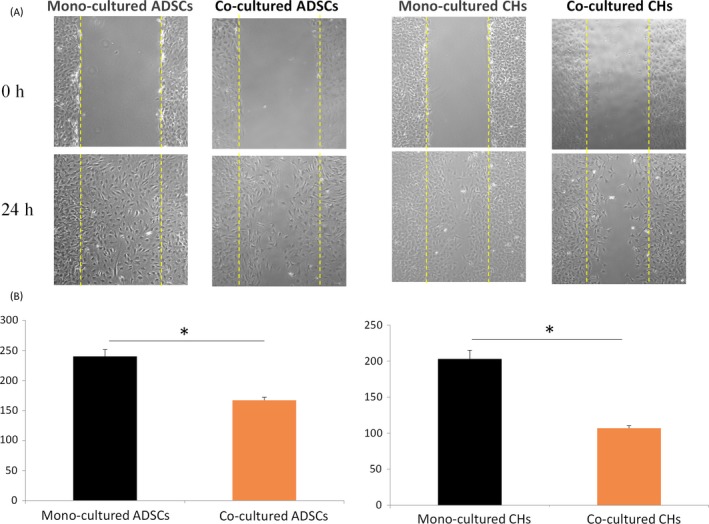
The migration of adipose‐derived stem cells (ADSCs) and chondrocytes by wound healing assay. A, The effects of culture conditions on migration of ADSCs and chondrocytes detected by wound healing assay. B, Histogram representation of cell number in the wound area at 0 and 24 h in mono‐ and co‐culture conditions. Data are presented as mean ± SD (n = 3). Statistical analysis: *P < .05
3.3. Real‐time cell analysis (RTCA) of motility of ADSCs and chondrocytes in mono‐ and co‐culturing conditions
To further confirm vertical migration of the two cell types in mono‐ and co‐culture systems, we used RTCA, an instrument that employed real‐time cell monitoring, to accurately determine the kinetics of migration activity in a given population of cells. Figure 3A,B showed differences in migration index of ADSCs and chondrocytes during the 36‐hour test period. The reactions of chondrocytes migration to co‐culture condition were more intense than that of ADSCs. Statistical analysis of RTCA results revealed that cell migration was significantly stronger than co‐culture conditions in chondrocytes and ADSCS in mono‐culture in 12, 24 and 36 hours (Figure 3C,D). The results of RTCA are consistent with previous results in the wound healing assays. Therefore, it could be summarized that migration of ADSCs and chondrocytes in a mono‐culture condition is significantly stronger than that in co‐culture systems.
Figure 3.
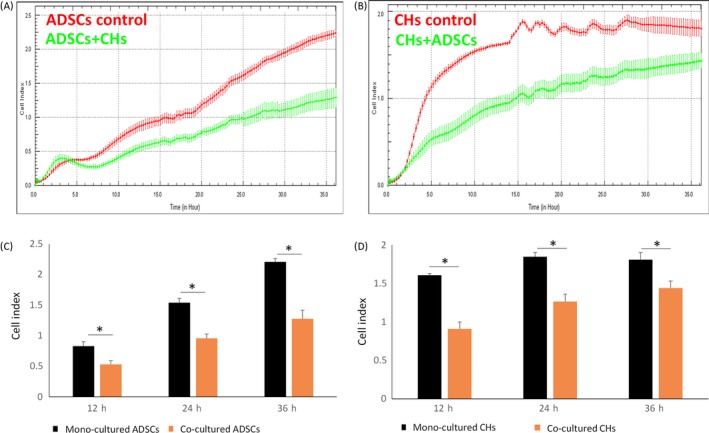
The migration of adipose‐derived stem cells (ADSCs) and chondrocytes by real‐time cell analysis migration (RTCA). A, Cell migration index was detected by RTCA system. B, Histogram representation of the migration index of migration of ADSCs and chondrocytes at 12, 24 and 36 h in mono‐ and co‐culture conditions. Data are presented as mean ± SD (n = 3). Statistical analysis: *P < .05, **P < .01, ***P < .001
3.4. Focal adhesion differs in mono‐ and co‐culturing conditions
Vinculin, an adhesion protein of 117 kDa, is thought to transmit forces between the extracellular matrix (ECM) and the actin cytoskeleton.31 Studies have shown that Vinculin could restrain the cellular migration velocity.32, 33 Thus, to detect the variation of Vinculin expression in ADSCs and chondrocytes, we used immunofluorescence staining and Western blotting. Fluorescence microscopy imaging of the nucleus (blue) and Vinculin (red) was employed at day 3 post‐seeding (Figure 4A). Compared with the mono‐culture group, the Vinculin expression in the co‐culture group showed a significant increase in Vinculin expression in co‐culture groups. To further validate these results, Vinculin was detected by Western blot at 1, 2, 3 and days post‐seeding. Similarly, the results of Western blotting showed that Vinculin expression increased gradually over time. The expression level in co‐culture group was higher than that of mono‐culture group (Figure 4B).
Figure 4.
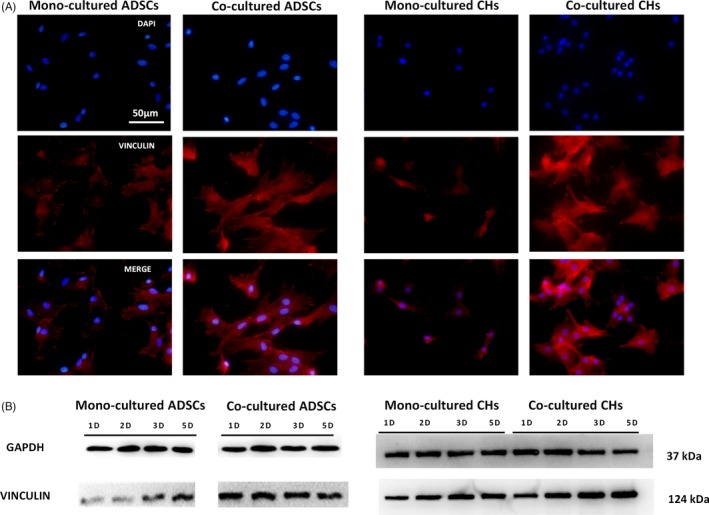
The abundance of Vinculin in ADSCs and chondrocytes. A, Immunostaining images of cell nuclei (blue) and Vinculin (red) at day 3 post‐seeding. Scale bars are 50 μm. B, Protein expression of Vinculin measured by Western blotting in ADSCs and chondrocytes
3.5. Secretion of MMP‐2 in ADSCs and chondrocytes was influenced by co‐culturing conditions
To examine the activity of MMP‐2, we used gelatin zymography. Gelatin zymography was used to determine the activity of degrading denatured collagen I of gelatinase. It is a useful tool to detect and analyse the gelatinases expressed in different cell types qualitatively.34 The samples were electrophoresed in SDS polyacrylamide gel impregnation with gelatin and subjected to a series of treatments to renature the enzymes and degrade the gelatin. Finally, the gel was stained with coomassie brilliant blue. After decolorization, the strength of the bands is proportional to the activity of MMP‐2. It can be summarized from the Figure 5A that in the two cell types, MMP‐2 activity was gradually increased in the 1, 2, 3, 5 and 7 days. Moreover, statistical analysis of the results in Figure 5A showed that MMP‐2 in mono‐culture groups was gradually higher than that in co‐culture groups (Figure 5B). The expression of MMP‐2 gene was examined by qPCR. For ADSCs, relative fold changes of the MMP‐2 gene expression in mono‐culture group and co‐culture group were 1 and 0.97 on the second day respectively. On the fifth day, the relative mRNA level fold changes of MMP‐2 were 1.08 times and 0.71 times in mono‐culture and co‐culture groups respectively. For chondrocytes, the mRNA level of MMP‐2 employed the same trend with ADSCs. MMP‐2 gene expression was attenuated to 0.713 and 0.34 times in the co‐culture group in day 2 and day 5, compared with the single culture group (Figure 5C). Taken together, for the two cell types, the expression of MMP‐2 gene in co‐culture group was down‐regulated, and the differences was statistically significant.
Figure 5.
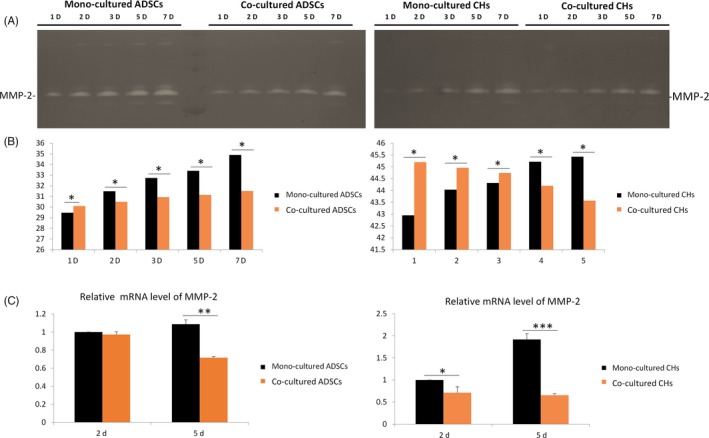
Adipose‐derived stem cells (ADSCs) and chondrocytes secrete more MMP‐2 in mono‐culture conditions. A, Zymography showed MMP‐2 secreted in ADSCs and chondrocytes. B, Quantification of MMP‐2 secreted in ADSCs and chondrocytes was performed using the OD method. C, Real‐time qPCR analyses of the gene expressions of MMP‐2 in day 5 post‐seeding. Results were normalized in respect to expression levels of the endogen reference gene GAPDH. Data are presented as mean ± SD (n = 3). Statistical analysis: *P < .05, **P < .01, ***P < .001
3.6. Role of the Notch pathway in cell migration in mono‐ and co‐culture systems
To evaluate the role of the Notch pathway in cell migration in mono‐ and co‐culture systems, the expression level of Hey1 and Hes1 was examined by Western blot and qPCR. Hey1 and Hes1 mRNA exhibited greater expression in co‐culture groups (Figure 6A,B). The expression of Hey1 and Hes1 in Western blot was remarkably higher in co‐culture systems in the 1, 2, 3 and 5 days and this result further established the association between the Notch signalling pathway and culture systems (Figure 6C).
Figure 6.
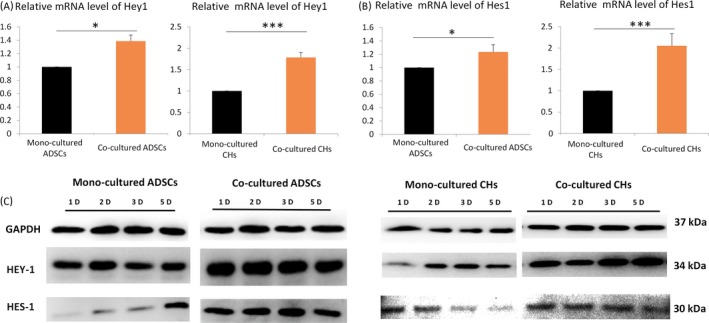
Role of the Notch pathway in cell migration in mono‐ and co‐culture systems. A, Hey1 and Hes1 gene expression level in adipose‐derived stem cells (ADSCs) and chondrocytes. GAPDH levels set as internal normalized control. The samples were collected on day 5. The results shown are representative of three different experiments (n = 3). Data are presented as means ± SD, *P < .05, **P < .01, ***P < .001. B, Protein expression of Hey1 and Hes1 measured by Western blotting in ADSCs and chondrocytes
4. DISCUSSION
The structural scaffolds of cells consist of three different filamentous components, ie actin filaments, microtubules and intermediate filaments. They are combined into a complex network and regulate a variety of cell behaviours.35 The assembly and depolymerization of actin filaments and microtubules are highly dynamic and allow cell movement. The elongation of microfilaments produced by the polymerization of actin and the contraction of myosin‐mediated microfilaments at the tail of the cell are considered the main drivers of animal cell migration.36 The finger‐like extensions that composed of parallel actin bundles in migrating cells is called filopodia.37, 38, 39 The filopodia could help cells in sensing their external environment and follow chemical clues.39, 40, 41 Moreover, it could also promote cell adhesion and therefore it is important for traction forces.39, 42 Studies have shown that cell migration was reduced because of the inhibition of filopodia formation.39, 43 In our study, the immunofluorescence analysis of F‐actin showed more filopodia on the surfaces of migrating cells in the mono‐culture group than the co‐culture groups. This observation showed that the migration of cells in the single culture groups is more obvious. Thus, we used wound healing experiments and RTCA to detect horizontal and vertical migration. The results confirmed our conjecture that the migration of cells differs significantly under different culture systems.
Vinculin, an adhesion protein of 117 kDa, is present in cell–cell junctions and in focal adhesion complexes.44 The amino‐terminal and carboxy‐terminal of Vinculin bind to talin45 and filamentous F‐actin46 respectively. Therefore, Vinculin is thought to transmit forces between the ECM and the actin cytoskeleton.31 Vinculin restrains the cellular migration velocity.32, 33 Studies of mouse embryonic fibroblasts isolated from vinculin‐inactivated mutant embryos have shown that migration rates over these substrata are 2‐fold higher and the level of focal adhesion kinase (FAK) activity is 3‐fold higher.44 In our transwell co‐culture system, rat ADSCs and CHs exhibit indirect contact. The expression level of Vinculin was significantly up‐regulated in co‐culture systems than in mono‐cultures which restrained the cellular migration velocity.
ECM remodelling is essential to cell migration. It coordinates haptic and mechanical guidance cues, two crucial factors in the process of cell migration.47, 48 Cells secrete proteolytic enzymes to cleave matrix proteins during the process of migration.49 Matrix metalloproteinases are an enzyme family with similar structures. They are named after the need for Ca2+ and Zn2+ as a cofactor. The members of the gelatinase subgroup of matrix metalloproteinases are MMP‐2 and MMP‐9. MMP‐2 is widely expressed in most tissues and cells.50, 51 However, the expression of MMP‐9 is usually limited to monocytes, macrophages, polymorphonuclear cells and keratinocytes.50, 52 MMP‐2 degrade components of the extracellular matrix,53 and confers an important role in ECM remodelling and cell migration processes. In our study, MMP‐2 activity was detected by gelatin zymography. As the culture time increased, MMP‐2 activity was enhanced. However, this activity was significantly lower than that observed in mono‐culture conditions. On the basis of previous studies, we have proposed that the down‐regulation of MMP‐2 in co‐cultured groups may cause reduced migration.
The Notch signalling pathway is a highly conserved network involved in many developmental processes.24, 25 Previous studies have examined the mechanisms of cell migration,20 but the role of Notch signalling has not been fully defined. It has been reported that Notch1 is specifically reduced during the healing of the corneal epithelium. Additionally, corneal epithelial cell migration is enhanced by the exogenous inhibition of Notch.54 This is consistent with our observation that in co‐culture systems, cell migration is accompanied by the up‐regulation of Hey1 and Hes1. However, studies have shown that the overexpression of Notch1 in transgenic mice enhances wound healing. These contradictory results may be explained by the more rapid proliferation of the transgenic epithelium.55 In addition, Notch inhibition induced changes in the cytoskeleton of actin, consistent with the increased migration phenotype. In particular, Notch inhibition in cells resulted in enhanced lamellipodia, accompanied by the loss of marginal actin bundles.55 In our research, we showed the up‐regulation of two effectors, Hes‐1 and Hey‐1, of the Notch signalling pathway. To assess whether the Notch signalling pathway regulates co‐culture‐dependent changes in migration, it will be important to employ additional in‐depth analyses of other effectors of the Notch signalling pathway in future studies.
In conclusion, the overall study showed that the migration of ADSCs and chondrocytes differs significantly depending on culture conditions. Adipose‐derived stem cells and chondrocytes exhibited less migration in the co‐culture group than in mono‐culture groups. The mechanisms underlying these differences in migration include a decrease in the secretion of MMP‐2 and an increase in the expression of Vinculin under co‐culture conditions. In addition, the expression levels of Hey1 and Hes1 in the Notch signalling pathway were also detected. By studying the migration changes caused by co‐culture, we have a new understanding of the crosstalk between ADSCs and chondrocytes.
5. CONCLUSION
In conclusion, our study focused on migration of ADSCs and chondrocytes in mono‐ and co‐culture systems. Our results illustrated that ADSCs and chondrocytes exhibited less migration in the co‐culture group. The mechanisms underlying the differences could be explained in following three aspects: (i) Attenuated filopodia restrained migration in co‐culture groups; (ii) The down‐regulated MMP‐2 decreased ECM remoulding in co‐culture groups; and (iii) The up‐regulated Vinculin restrain cellular migration in co‐culture group. Moreover, the Notch signalling pathway may be involved in this process. Accordingly, by studying changes in migration caused by co‐culture, we obtained new insight into the crosstalk between ADSCs and chondrocytes.
CONFLICTS OF INTERESTS
The authors declare no conflict of interests.
Zhang Q, Deng S, Sun K, et al. MMP‐2 and Notch signal pathway regulate migration of adipose‐derived stem cells and chondrocytes in co‐culture systems. Cell Prolif. 2017;50:e12385 10.1111/cpr.12385
Funding information
This study was supported by the National Natural Science Foundation of China (81771125, 81471803) and Sichuan Province Youth Science and Technology Innovation Team (2014TD0001)
Qi Zhang and Shuwen Deng contribute equally to this work.
REFERENCES
- 1. Paschos NK, Brown WE, Eswaramoorthy R, Hu JC, Athanasiou KA. Advances in tissue engineering through stem cell‐based co‐culture. J Tissue Eng Regen Med. 2015;9:488‐503. [DOI] [PubMed] [Google Scholar]
- 2. Lawrence TS, Beers WH, Gilula NB. Transmission of hormonal stimulation by cell‐to‐cell communication. Nature. 1978;272:501‐506. [DOI] [PubMed] [Google Scholar]
- 3. Bigdeli N, Karlsson CR. Coculture of human embryonic stem cells and human articular chondrocytes results in significantly altered phenotype and improved chondrogenic differentiation. Stem Cells. 2009;27:1812‐1821. [DOI] [PubMed] [Google Scholar]
- 4. Eyestone WH, First NL. Co‐culture of early cattle embryos to the blastocyst stage with oviducal tissue or in conditioned medium. J Reprod Fertil. 1989;85:715‐720. [DOI] [PubMed] [Google Scholar]
- 5. Gong T, Xie J, Liao J, Zhang T, Lin S, Lin Y. Nanomaterials and regenrative medicine. Bone Research. 2015;3:15029. [DOI] [PMC free article] [PubMed] [Google Scholar]
- 6. Davies PF, Truskey GA, Warren HB, O'Connor SE, Eisenhaure BH. Metabolic cooperation between vascular endothelial cells and smooth muscle cells in co‐culture: changes in low density lipoprotein metabolism. J Cell Biol. 1985;101:871‐879. [DOI] [PMC free article] [PubMed] [Google Scholar]
- 7. Zhao D, Xue C, Lin S, et al. Notch signaling pathway regulates angiogenesis via endothelial cell in 3D co‐culture model. J Cell Physiol. 2017;232:1548‐1558. [DOI] [PubMed] [Google Scholar]
- 8. Shao X, Lin S, Peng Q, et al. DNA nanostructures: tetrahedral DNA nanostructure: a potential promoter for cartilage tissue regeneration via regulating chondrocyte phenotype and proliferation. Small. 2017;13:1602770‐1602781. [DOI] [PubMed] [Google Scholar]
- 9. Sanjurjo‐Rodríguez C, Sánchez AHM, Hermida‐Gómez T, et al. Cartilage tissue engineering: adult human mesenchymal stromal cells and collagen biomaterials. Osteoarthr Cartil. 2014;22:S154‐S154. [Google Scholar]
- 10. Cen L, Liu W, Cui L, Zhang W, Cao Y. Collagen tissue engineering: development of novel biomaterials and applications. Pediatr Res. 2008;63:492‐496. [DOI] [PubMed] [Google Scholar]
- 11. Zhong Juan, Guo Bin, Xi Jing, et al. Crosstalk between adipose‐derived stem cells and chondrocytes:when growth factors matter. Bone Research. 2015;4:15036‐15045. [DOI] [PMC free article] [PubMed] [Google Scholar]
- 12. Fu N, Liao J, Lin S, et al. PCL‐PEG‐PCL film promotes cartilage regeneration in vivo. Cell Prolif. 2016;49:729‐739. [DOI] [PMC free article] [PubMed] [Google Scholar]
- 13. Zhang T, Gong T, Xie J, et al. Softening substrates promote chondrocytes phenotype via RhoA/ROCK pathway. ACS Appl Mater Interfaces. 2016;8:22884‐22891. [DOI] [PubMed] [Google Scholar]
- 14. Shi S, Xie J, Zhong J, et al. Effects of low oxygen tension on gene profile of soluble growth factors in co‐cultured adipose‐derived stromal cells and chondrocytes. Cell Prolif. 2016;49:341‐351. [DOI] [PMC free article] [PubMed] [Google Scholar]
- 15. Levi B, Longaker MT. Concise review: adipose‐derived stromal cells for skeletal regenerative medicine. Stem Cells. 2011;29:576‐582. [DOI] [PMC free article] [PubMed] [Google Scholar]
- 16. Mizuno H, Tobita M, Orbay H, Uysal AC, Feng L. Adipose‐derived stem cells as a novel tool for future regenerative medicine. Stem Cells. 2012;30:804‐810. [DOI] [PubMed] [Google Scholar]
- 17. Li G, Zhou T, Lin S, Shi S, Lin Y. Nanomaterials for craniofacial and dental tissue engineering. J Dent Res. 2017;96:725‐732. [DOI] [PubMed] [Google Scholar]
- 18. Pawitan JA, Suryani D, Lilianty J, Purwoko RY, Liem IK. The use of VEGF supplemented media for chondrogenic differentiation of adipose derived mesenchymal stem cells. Indian J Biotechnol. 2013;7:169‐173. [Google Scholar]
- 19. Ridley AJ, Horwitz AR. Cell migration: integrating signals from front to back. Science. 2003;302:1704‐1709. [DOI] [PubMed] [Google Scholar]
- 20. Shi S, Qiang P, Shao X, et al. Self‐assembled tetrahedral dna nanostructures promote adipose‐derived stem cell migration via lncRNA XLOC 010623 and RHOA/ROCK2 signal pathway. ACS Appl Mater Interfaces. 2016;8:19353‐19363. [DOI] [PubMed] [Google Scholar]
- 21. Liao J, Cai X, Tian T, et al. The fabrication of biomimetic biphasic CAN‐PAC hydrogel with a seamless interfacial layer applied in osteochondral defect repair. Bone Research. 2017;5:17018. [DOI] [PMC free article] [PubMed] [Google Scholar]
- 22. Iwadate Y, Yumura S. Actin‐based propulsive forces and myosin‐II‐based contractile forces in migrating Dictyostelium cells. J Cell Sci. 2008;121:1314‐1324. [DOI] [PubMed] [Google Scholar]
- 23. Buenemann M, Levine H, Rappel WJ, Sander LM. The role of cell contraction and adhesion in dictyostelium motility. Biophys J. 2010;99:50‐58. [DOI] [PMC free article] [PubMed] [Google Scholar]
- 24. Xue C, Xie J, Zhao D, et al. The JAK/STAT3 signalling pathway regulated angiogenesis in an endothelial cell/adipose‐derived stromal cell co‐culture, 3D gel model. Cell Prolif. 2017;50:e12307. [DOI] [PMC free article] [PubMed] [Google Scholar]
- 25. Mumm JS, Kopan R. Notch signaling: from the outside in. Dev Biol. 2000;228:151. [DOI] [PubMed] [Google Scholar]
- 26. Lin W, Wang YC, Hu XB, et al. Notch‐RBP‐J signaling regulates the mobilization and function of endothelial progenitor cells by dynamic modulation of CXCR4 expression in mice. PLoS ONE. 2009;4:e7572. [DOI] [PMC free article] [PubMed] [Google Scholar]
- 27. Hashimototorii K, Torii M, Sarkisian MR, et al. Interaction between Reelin and Notch signaling regulates neuronal migration in the cerebral cortex. Neuron. 2008;60:273‐284. [DOI] [PMC free article] [PubMed] [Google Scholar]
- 28. Xie J, Wang W, Si JW, et al. Notch signaling regulates CXCR4 expression and the migration of mesenchymal stem cells. Cell Immunol. 2013;281:68‐75. [DOI] [PubMed] [Google Scholar]
- 29. Ke N, Wang X, Xu X, Abassi YA. The xCELLigence system for real‐time and label‐free monitoring of cell viability. Methods Mol Biol. 2011;740:33. [DOI] [PubMed] [Google Scholar]
- 30. Ono T, Iwai S, Egawa S, et al. Investigation of cell migration and invasion using real‐time cell analysis, as well as the association with matrix metalloproteinase‐9 in oral squamous cell carcinomas. J Food Sci. 2014;25:203‐212. [Google Scholar]
- 31. Thievessen I, Fakhri N, Steinwachs J, et al. Vinculin is required for cell polarization, migration, and extracellular matrix remodeling in 3D collagen. FASEB J. 2015;29:4555. [DOI] [PMC free article] [PubMed] [Google Scholar]
- 32. Thievessen I, Thompson PM, Berlemont S, et al. Vinculin–actin interaction couples actin retrograde flow to focal adhesions, but is dispensable for focal adhesion growth. J Cell Biol. 2013;202:163. [DOI] [PMC free article] [PubMed] [Google Scholar]
- 33. Mierke CT, Kollmannsberger P, Zitterbart DP, et al. Vinculin facilitates cell invasion into three‐dimensional collagen matrices. J Biol Chem. 2010;285:13121‐13130. [DOI] [PMC free article] [PubMed] [Google Scholar]
- 34. Toth M, Fridman R. Assessment of gelatinases (MMP‐2 and MMP‐9 by gelatin zymography. Methods Mol Biol. 2012;878:121. [DOI] [PubMed] [Google Scholar]
- 35. Plastino J, Sykes C. The actin slingshot. Curr Opin Cell Biol. 2005;17:62‐66. [DOI] [PubMed] [Google Scholar]
- 36. Zhang T, Xie J, Sun K, et al. Physiological oxygen tension modulates the soluble growth factor profile after crosstalk between chondrocytes and osteoblasts. Cell Prolif. 2016;49:122‐133. [DOI] [PMC free article] [PubMed] [Google Scholar]
- 37. Mallavarapu A, Mitchison T. Regulated actin cytoskeleton assembly at filopodium tips controls their extension and retraction. J Cell Biol. 1999;146:1097‐1106. [DOI] [PMC free article] [PubMed] [Google Scholar]
- 38. Arjonen A, Kaukonen R, Ivaska J. Filopodia and adhesion in cancer cell motility. Cell Adh Migr. 2011;5:421. [DOI] [PMC free article] [PubMed] [Google Scholar]
- 39. Meyen D, Tarbashevich K, Banisch TU, et al. Dynamic filopodia are required for chemokine‐dependent intracellular polarization during guided cell migration in vivo. Elife Sciences. 2015;4:1392‐1215. [DOI] [PMC free article] [PubMed] [Google Scholar]
- 40. Sanders TA, Llagostera E, Barna M. Specialized filopodia direct long‐range transport of SHH during vertebrate tissue patterning. Nature. 2013;497:628. [DOI] [PMC free article] [PubMed] [Google Scholar]
- 41. Roy S, Huang H, Liu S, Kornberg TB. Cytoneme‐mediated contact‐dependent transport of the Drosophila decapentaplegic signaling protein. Science. 2014;343:1244624. [DOI] [PMC free article] [PubMed] [Google Scholar]
- 42. Albuschies J, Vogel V. The role of filopodia in the recognition of nanotopographies. Sci Rep. 2013;3:1658. [DOI] [PMC free article] [PubMed] [Google Scholar]
- 43. Phng LK, Stanchi F, Gerhardt H. Filopodia are dispensable for endothelial tip cell guidance. Development. 2013;140:4031‐4040. [DOI] [PubMed] [Google Scholar]
- 44. Xu W, Baribault H, Adamson ED. Vinculin knockout results in heart and brain defects during embryonic development. Development. 1998;125:327‐337. [DOI] [PubMed] [Google Scholar]
- 45. Jones P, Jackson P, Price GJ, et al. Identification of a talin binding site in the cytoskeletal protein vinculin. J Cell Biol. 1989;109:2917‐2927. [DOI] [PMC free article] [PubMed] [Google Scholar]
- 46. Johnson RP, Craig SW. F‐actin binding site masked by the intramolecular association of vinculin head and tail domains. Nature. 1995;373:261‐264. [DOI] [PubMed] [Google Scholar]
- 47. Dzamba BJ, Jakab KR, Marsden M, Schwartz MA, Desimone DW. Cadherin adhesion, tissue tension and non‐canonical wnt signaling regulate fibronectin matrix organization. Dev Cell. 2009;16:421‐432. [DOI] [PMC free article] [PubMed] [Google Scholar]
- 48. Haigo SL, Bilder D. Global tissue revolutions in a morphogenetic movement controlling elongation. Science. 2011;331:1071‐1074. [DOI] [PMC free article] [PubMed] [Google Scholar]
- 49. Li H, Richard D, Reine B, Chantal B, Joëlle A. uPA and MMP‐2 were involved in self‐assembled network formation in a two dimensional co‐culture model of bone marrow stromal cells and endothelial cells. J Cell Biochem. 2013;114:650‐657. [DOI] [PubMed] [Google Scholar]
- 50. Solli AI, Fadnes B, Winberg JO, Uhlinhansen L, Hadlerolsen E. Tissue‐ and cell‐specific co‐localization of intracellular gelatinolytic activity and matrix metalloproteinase 2. J Histochem Cytochem. 2013;61:444. [DOI] [PMC free article] [PubMed] [Google Scholar]
- 51. Sariahmetoglu MCB, Leon H, Sawicka J, et al. Regulation of matrix metalloproteinase‐2 (MMP‐2) activity by phosphorylation. FASEB J. 2007;21:2486. [DOI] [PubMed] [Google Scholar]
- 52. Vandooren J, Pe VDS, Opdenakker G. Biochemistry and molecular biology of gelatinase B or matrix metalloproteinase‐9 (MMP‐9): the next decade. Crit Rev Biochem Mol Biol. 2013;48:222. [DOI] [PubMed] [Google Scholar]
- 53. Butler GS, Overall CM. Updated biological roles for matrix metalloproteinases and new “intracellular” substrates revealed by degradomics. Biochemistry. 2009;48:10830‐10845. [DOI] [PubMed] [Google Scholar]
- 54. Movahedan A, Majdi M, Afsharkhamseh N, et al. Notch inhibition during corneal epithelial wound healing promotes migration. Invest Ophthalmol Vis Sci. 2012;53:7476. [DOI] [PMC free article] [PubMed] [Google Scholar]
- 55. Lu H, Lu Q, Zheng Y, Li Q. Notch signaling promotes the corneal epithelium wound healing. Mol Vis. 2012;18:403. [PMC free article] [PubMed] [Google Scholar]