Abstract
Objectives
Poor cell survival severely limits the beneficial effect of adipose‐derived stem cell (ADSC)‐based therapy for disease treatment and tissue regeneration, which might be caused by the attenuated level of hypoxia‐inducible factor‐1 (HIF‐1) in these cells after having been cultured in 21% ambient oxygen in vitro for weeks. In this study, we explored the role of pre‐incubation in dimethyloxalylglycine (DMOG, HIF‐1 activator) in the survivability of human ADSCs in a simulated ischaemic microenvironment in vitro and in vivo. The underlying mechanism and angiogenesis were also studied.
Materials and methods
Survivability of ADSCs was determined in a simulated ischaemic model in vitro and a nude mouse model in vivo. Cell metabolism and angiogenesis were investigated by tube formation assay, flow cytometry, fluorescence staining and real‐time polymerase chain reaction (RT‐PCR) after DMOG treatment.
Results
The results of the experimental groups showed significant enhancement of ADSC survivability in a simulated ischaemic microenvironment in vitro and transplanted model in vivo. Study of the underlying mechanisms suggested that the improved cell survival was regulated by HIF‐1‐induced metabolic reprogramming including decreased reactive oxygen species, increased intracellular pH, enhanced glucose uptake and increased glycogen synthesis. Tube formation assay revealed higher angiogenic ability in the DMOG‐treated group than that in control group.
Conclusions
The promotion of HIF‐1 level in ADSCs induced by DMOG preconditioning suggests a potential strategy for improving the outcome of cell therapy due to increased survival and angiogenic ability.
1. INTRODUCTION
As a type of regenerative medicine, stem cell therapy can be applied to substitute or restore injured tissue and cells to treat diseases.1 Fat tissue has been proven as an abundant autologous source of adipose‐derived stem cells (ADSCs) as defined by the International Society of Cellular Therapy (ISCT) and International Federation for Adipose Therapeutics and Science (IFATS).2 These cells can be safely harvested through minimally invasive liposuction and have a similar therapeutic potential to other types of mesenchymal stem cells.3 As a result, ADSC‐based therapy is currently undergoing clinical trial in a number of diseases including diabetes, ischaemia and Parkinson's disease, among others, according to the database of clinicaltrials.gov and is also being used in preclinical studies of urethral structure4 and adipose regeneration.5
However, there are still critical challenges to overcome. Low survival rate of cells after transplantation have attracted substantial attention,6 and enhancing the survivability of transplanted ADSCs is critical for improving the prognosis of ADSC‐based therapy. During the initial periods of cell therapy, transplanted ADSCs must survive in an ischaemic microenvironment characterized by low oxygen, glucose and pH, which is the dominating cause of cell death.7
The expression of hypoxia‐inducible factor 1 (HIF‐1) by cells in an ischaemic environment provides a potential strategy to improve cell therapeutic outcomes. HIF‐1 is a heterodimer composed by O2‐antagonistic HIF‐1α and constitutively expressed HIF‐1β subunits.8 HIF‐1α is subjected to prolyl hydroxylation (PHD) in the presence of O2, which results in its ubiquitination and proteasomal degradation. This hydroxylation is inhibited under hypoxia and gives rise to the accumulation of HIF‐1α.9 Prolyl hydroxylase inhibitors, such as dimethyloxalylglycine (DMOG), can simulate this suppression leading to HIF‐1 activation under normoxia.1
HIF‐1 activates the transcription of diverse genes encoding angiogenic cytokines, including vascular endothelial growth factor (VEGF), stromal‐derived factor 1 (SDF‐1), placental growth factor (PLGF), angiopoietin 1 and 2, and platelet‐derived growth factor B,10, 11, 12, 13, 14 which can improve vascularization for cell therapy.
Metabolic reprogramming, a suite of metabolic alterations as a result of HIF‐1 that maintain homeostasis of energy, glucose and pH, may be an effective way of increasing cell survival in the ischaemic microenvironment after ADSC transplantation. First, HIF‐1 activates glutaminase‐regulated glutathione synthesis, retaining redox homeostasis at baseline when faced with oxidative or nutrient stress.15 Second, HIF‐1 signalling increases the glycogen reserve in preparation for an energy deficit during nutrient or oxygen depletion.16 Third, HIF‐1 reduces the production of reactive oxygen species (ROS) under hypoxia by increasing the efficiency of respiration, inactivating pyruvate dehydrogenase and triggering selective mitophagy.17, 18, 19, 20 Fourth, HIF‐1 augments glucose uptake and flux from glucose to lactate.21, 22, 23 Fifth, HIF‐1 maintains the intracellular pH by exporting H+ as well as lactate.24, 25
DMOG has the capacity of activating HIF‐1 signalling and has the potential to promote cell survival and angiogenesis in cell therapy. Some researchers have already employed HIF‐1 to improve cells of the brain,26, 27 heart28, 29 and kidney30 in preclinical ischaemic‐disease models and bone regeneration31 in mouse models. These beneficial results provide a sound foundation for ADSC‐based therapy.
The aim of this study was to investigate whether and how DMOG‐induced metabolic reprogramming increases ADSC survival and angiogenesis using an ischaemic cell culture model and subcutaneously implanted ADSCs into nude mice after being combined with fibrin gel. We demonstrate that stabilization of HIF‐1 in ADSCs prior to implantation results in metabolic reprogramming and improves cell survival and angiogenesis.
2. MATERIALS AND METHODS
2.1. Cell isolation and DMOG preconditioning
Cells were isolated from subcutaneous adipose tissues harvested from the abdomen of females who underwent liposuction, and informed consent was obtained. The adipose tissues were digested with 0.2% collagenase (Sigma‐Aldrich, St. Louis, MO, USA)/phosphate‐buffered saline (PBS), and then the mixture was transferred into a 37°C water bath for 40 minutes. After centrifugation at 1,000 rpm for 5 minutes, the supernatant was removed. The remaining cellular pellet was resuspended in PBS and centrifuged at 1,000 rpm for 5 minutes. After discarding the supernatant, the remaining cells were cultured with α‐modified Eagle's medium (α‐MEM) (HyClone, Logan, UT, USA), 10% foetal bovine serum (FBS; Gibco, Thermo Fisher Scientific, Rockville, MD, USA), 100 IU penicillin, and 100 mg/mL streptomycin (Solarbio, Beijing, China). ADSCs at passage 3 were used in subsequent experiments after treating with DMOG (D3695; Sigma) or vehicle (0.01% dimethyl sulfoxide [DMSO]) as control.
2.2. Cell identification
2.2.1. Adipogenesis
ADSCs were seeded in six‐well plates at a density of 1×10⁵ cells/well and then incubated in adipogenic medium (α‐MEM supplemented with 10% FBS, 1 mmol/L dexamethasone, 10 mmol/L insulin, 200 mmol/L indomethacin and 0.5 mmol/L 3‐isobutyl‐1‐methylxanthine). Adipogenic differentiation was determined by Oil red O (Sigma‐Aldrich) staining after 7 days.
2.2.2. Flow cytometry
Approximately 1 × 10⁵ cells were immunolabeled at 4°C for 30 minutes with antibodies against CD31, CD34, CD73, CD90, CD105 and HLA‐DR. The stained cells were washed twice before analysis, and a BD Accuri™ C6 flow cytometer (BD Biosciences, San Jose, CA, USA) was used to perform the analysis.
2.3. Western blotting
Western blot was conducted as previously described.32 In brief, cell pellets were dissolved in radio immunoprecipitation assay (RIPA) buffer (KeyGEN, Nanjing, China) immediately after discarding the DMOG or vehicle‐added medium and 30 μg cell protein was separated by sodium dodecyl sulphate polyacrylamide gel electrophoresis (SDS‐PAGE). The proteins were blotted onto polyvinylidene fluoride (PVDF) membranes and then blocked with 5% skim milk. Following incubation overnight at 4°C with primary antibodies against HIF‐1 (1:1,000, 14179; Cell Signaling Technology, Danvers, MA, USA) and β‐actin (1:1,000, ab3280; Abcam, Cambridge, MA, USA), the membranes were incubated with horseradish peroxidase (HRP)‐conjugated secondary antibodies at room temperature for 1 hour. The bands were detected with an Amersham ECL Select Western blotting detection reagent (GE, Logan, UT, USA) according to the manufacturer's protocol. Images were visualized with ImageQuant LAS 4000 mini machine (GE).
2.4. Cell survival
2.4.1. Ischaemic model
When ADSCs are surrounded by ischaemic tissue, they usually experience a hypoxic, acidic and nutrient‐lacking environment. We mimicked these conditions in vitro by incubating ADSCs with N‐2‐hydroxyethylpiperazine‐N’‐2‐ethanesulphonic acid‐buffered Tyrode solutions under hypoxia (1% O2/5% CO2/94% N2) using a modular chamber (Sanyo, Japan) or normoxia (20% O2) at pH 6.4 or 7.4 and 0.56 μmol/L or 5.6 μmol/L of glucose.
2.4.2. Live/dead assay
A live/dead cell staining kit from KeyGEN (Nanjing, China) was applied for survivability analysis. After washing with PBS, 1×10⁴ cells seeded in 96‐well culture plates were stained by incubation in 50 μL of staining solution (8 μmol/L propidium iodide [PI], 2 μmol/L calcein acetoxymethylester [Calcein‐AM], PBS) for 30 minutes. Cells were washed with PBS and analysed under a fluorescence microscope (Olympus, Tokyo, Japan). The resulting images were overlaid by cellSens imaging software (Olympus).
2.4.3. Cell counting kit‐8 (CCK‐8)
CCK‐8 (Dojindo, Japan) dye solution (90 μL of α‐MEM with 10 μL CCK‐8) was added in each well (1×10⁴ cells, 96‐well plates). Wells containing α‐MEM without cells were used as blanks. After incubation at 37°C for 2 hours, the samples were taken out, and absorbance was detected at 450 nm using a spectrophotometer (Multiskan GO; Thermo Scientific). The results were calculated according to the formula ODt/OD0×100% (OD [optical density]).
2.5. Real‐time polymerase chain reaction (RT‐PCR)
Total RNA was isolated using RNAiso Plus (TaKaRa Biotechnology, Shiga, Japan) according to the manufacturer's instructions. The isolated RNA was subsequently transcribed to cDNA with First Strand cDNA Synthesis Kit (Thermo Scientific). RT‐PCR was performed with the Eco Real‐Time PCR System (Illumina, San Diego, CA, USA) and SYBR Premix Ex Taq (TaKaRa Biotechnology). QPCR was performed by primary incubation at 95°C for 2 minutes followed by 40 cycles of 95°C for 5 seconds and 60°C for 30 seconds. The ΔΔct method was used to determine relative mRNA expression in samples by normalizing with hypoxanthine‐guanine phosphoribosyltransferase (HPRT) housekeeping gene expression, and fold change was determined using 2−ΔΔct. The primer sequences are listed in Supporting Information Table S1.
2.6. Measurement of mitochondrial mass, ROS and glucose uptake
Mitochondrial mass, mitochondrial or cytosolic ROS levels and glucose uptake were determined by staining cells with 10 nmol/L nonyl acridine orange (NAO; Sigma‐Aldrich), 5 μmol/L MitoSOX™ RED (Life Technologies, Waltham, MA, USA), 1 μmol/L dihydrodichlorofluorescein diacetate (H2DCFDA; Sigma‐Aldrich), or 150 μmol/L 2‐[N‐(7‐nitrobenz‐2‐oxa‐1,3‐diazol‐4‐yl)amino]‐2‐deoxy‐D‐glucose (2‐NBDG; Life Technologies), respectively, at 37°C for 30 minutes. Cells were analysed immediately with a fluorescence microscope (Olympus) and BD Accuri™ C6 (BD Biosciences) with a minimum of 5,000 events acquired per sample.
2.7. Glycogen staining
Periodic acid‐Schiff (PAS) staining was used to visualize glycogen in cells. ADSCs on coverslips were fixed in 4% paraformaldehyde and incubated in 0.5% periodic acid (Solarbio) for 5 minutes. Then, cells were washed in distilled water for 5 minutes and treated with Schiff's reagent (Solarbio) for 15 minutes. After washing with distilled water for 5 minutes, the cells were dehydrated and mounted.
2.8. Intracellular pH measurements
Intracellular pH was measured using Multimode Reader (Thermo Scientific). Briefly, cells were stained with 5 μmol/L 2′,7′‐Bis‐(2‐Carboxyethyl)‐5‐(and‐6)‐Carboxyfluorescein, acetoxymethyl ester (BCECF‐AM; Millipore, San Diego, CA, USA) for 30 minutes at 37°C, and excitation at 500 nm and emission at 530 nm were used to measure pH. A calibration curve was produced by staining cells with 5 μmol/L BCECF‐AM for 30 minutes followed by treatment in buffers included in the Intracellular pH Calibration Buffer Kit (Thermo Scientific) with pH adjusted to different values (4.5, 5.5, 6.5 and 7.5). A 4‐point calibration curve was generated in the presence of K+/H+ ionophore nigericin (10 μmol/L) (Thermo Scientific, US).
2.9. Extracellular lactate measurements
Lactate content of the ADSC culture media was assayed using a lactate assay kit (KeyGEN) according to the manufacturer's instructions.
2.10. Tube formation assay
Fifty microlitres of Matrigel (Corning, NY, USA) was added to each well of a 96‐well plate and incubated at 37°C for 30 minutes. ADSCs (2×10⁴ cells) were seeded into the coated wells. After incubation at 37°C for 6 hours, tube formation was visualized under a microscope (Olympus). Images were analysed using Wimasis Image Analysis software (Ibidi, Martinsried, Germany).
2.11. In vivo study
Preparation of fibrin gel: Fibrin gel was prepared as previously described33 with 25 mg/mL fibrinogen, 20 mmol/L CaCl2 and 2.5 U/mL thrombin. Forty microlitres of bovine fibrinogen (50 mg/mL; Sigma‐Aldrich) dissolved in aprotinin (Solarbio) solution (10 000 kallikrein inhibitory units [KIU]/mL) was combined with 40 μL thrombin (5 U/mL, Solarbio) and allowed to gel for 45 minutes at 37°C.
Subcutaneous implantation of ADSC‐seeded fibrin gel into a nude mouse model: Approximately 1×10⁶ ADSCs were suspended in the thrombin solution. Forty microlitres of thrombin‐ADSC solution was mixed with 40 μL of fibrinogen solution and put in a sterile silicone tube (4.75 mm [inner diameter]) for gel formation. The gels were immediately implanted into the dorsum of immunodeficient mice. The surgery was performed under deep anaesthesia, and each mouse received two gels. At various time points (24, 48 and 72 hours), the fibrin gels were extracted and tested using survival assays. Animal procedures were conducted according to a protocol approved by the Ethical Committee of the State Key Laboratory of Oral Diseases, West China School of Stomatology, Sichuan University, China.
TdT‐mediated dUTP‐biotin nick end labelling (TUNEL) assay: The implants were immediately fixed in 4% paraformaldehyde solution for paraffin embedding. Sections of 5 μm thickness were cut and subjected to TUNEL assay followed by staining with the In Situ Cell Death Detection Kit (KeyGEN, China) to determine the survivability of ADSCs. The results were analysed using Image‐Pro Plus software.
5‐Bromo‐2‐deoxyuridine (BrdU) enzyme‐linked immunosorbent (ELISA) assay: The procedure was conducted as previously described.34 ADSCs in a 100 mm culture dish were treated with 10 μmol/L BrdU (Sigma‐Aldrich, USA)/basal medium for 48 hours before they were seeded. After subcutaneous implantation into mice for 24, 48 and 72 hours, the fibrin gels were extracted. The cells were isolated with 0.25% trypsin/EDTA solution. The cells were fixed for 30 minutes with 4% paraformaldehyde and treated with mouse anti‐BrdU monoclonal antibody (Millipore) for 1 hour and then with peroxidase‐conjugated goat anti‐mouse IgG antibody (Millipore) for 1 hour. After washing three times with PBST (PBS+Tween‐20), the cells were incubated with 3,3′,5,5′‐tetramethyl benzidine substrate solution. H2SO4 (1 N) was added to stop the reaction. Absorbance was measured at 450 nm using a spectrophotometer (Multiskan GO; Thermo Scientific). To generate a calibration curve of ELISA absorbance and cell numbers, the cells were diluted twofold from 0.125×10⁵ to 4×10⁵.
2.12. Statistical analysis
Each experiment was repeated at least three times. The data were collected and expressed as the mean±standard deviation. Statistical analysis using GraphPad Prism 5.02 (GraphPad Software, San Diego, CA, USA) was performed with unpaired Student's t tests. Two‐sided P<0.05 was considered statistically significant.
3. RESULTS
3.1. Characterization of ADSCs
Cell surface marker characterization using flow cytometry indicated that ADSCs expressed CD73, CD90 and CD105 and were negative for CD31, CD34 or HLA‐DR (Figure 1A). ADSCs displayed the presence of Oil red O‐stained lipid clusters (Figure 1B) after adipogenesis for 7 days. Cells showed typical spindle‐shaped morphology (Figure 1C) after DMOG (100 μmol/L DMOG for 4 days) or vehicle treatment.
Figure 1.
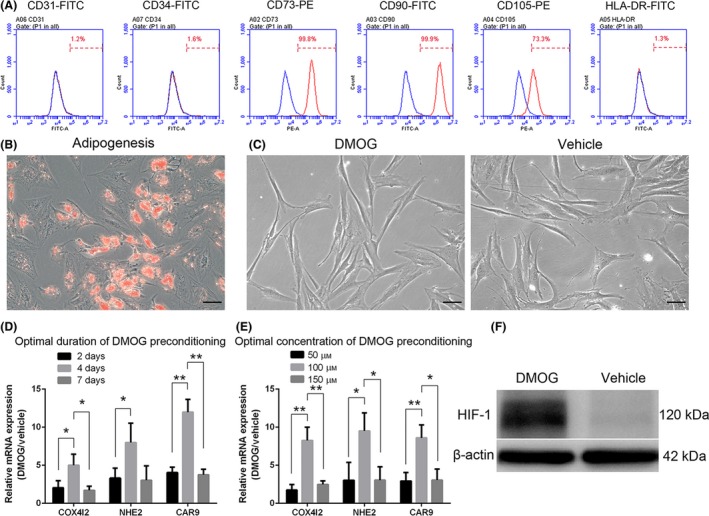
Identification of adipose‐derived stem cells (ADSCs) and determination of optimal dimethyloxalylglycine (DMOG) preconditioning concentration and duration. Flow cytometry analysis (A) revealed immunophenotypic characteristics of human ADSCs. Human ADSCs express cell surface antigens CD73, CD90 and CD105 and are negative for CD31, CD34 or HLA‐DR. ADSCs were cultured under adipogenic conditions for 7 days, and lipid clusters were displayed by Oil red O staining (B). Cells show typical spindle‐shape morphology (long and thin) after DMOG (D‐ADSCs, 100 μmol/L DMOG for 4 days), a prolyl hydroxylase inhibitor, or vehicle (0.01% dimethyl sulfoxide [DMSO], V‐ADSCs, as control) treatment (C). ADSCs were treated with DMOG or vehicle for different durations (2, 4 and 7 days) (D) and concentrations (50, 100 and 150 μmol/L) (E) to determine an optimal condition. Western blotting showed higher HIF‐1 protein expression (F) in ADSCs treated with 100 μmol/L DMOG for 4 days, which exhibited the best stimulation effect in D and E. *P<.05, **P <.01, scale bar=50 μm
3.2. Optimal concentration and duration of DMOG preconditioning
After treating ADSCs with DMOG at several concentrations (50, 100 and 150 μmol/L) (Figure 1D) and for various time periods (2, 4 and 7 days) (Figure 1E), the mRNA expression levels of three HIF‐1 target genes (COX4I2, NHE2 and CAR9) were detected by RT‐PCR using cultured ADSCs in the presence of vehicle as the control group. Compared to the other conditions, the group with 100 μmol/L of DMOG for 4 days showed an optimal effect of HIF‐1 signalling, and under this condition, the protein level of HIF‐1 displayed an apparent increase from the results of Western blotting (Figure 1F).
3.3. Increased survival of DMOG‐preconditioned ADSCs in the ischaemic model
When ADSCs are transplanted in vivo, they encounter an ischaemic environment which is acidic, hypoxic and nutrient‐depleted. Using an ischaemic model that mimicked above‐mentioned features, we found that compared with vehicle‐preconditioned ADSCs, DMOG‐preconditioned ADSCs (100 μmol/L DMOG for 4 days, hereafter referred to as V‐ADSCs and D‐ADSCs, respectively) exhibited elevated survival rate (Figure 2F, CCK‐8) and reduced death rate (Figure 2G, H, live/dead assay) in the presence of 1% O2, pH 6.4 and 0.56 μmol/L glucose (Figure 2B, ischaemic model). Meanwhile, D‐ADSCs achieved similar results in the presence of 1% O2 (Figure 2C, hypoxia), pH 6.4 (Figure 2D, acidity) and 0.56 μmol/L glucose (Figure 2E, denutrition). Statistical analysis of live/dead assay results was performed using ImageJ and is shown in Figure 2H (*P<.05, **P<.01).
Figure 2.
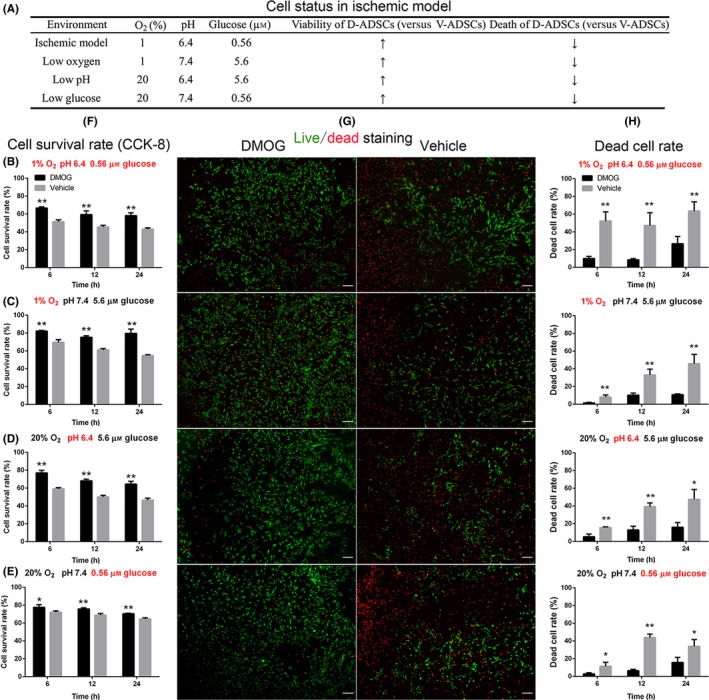
Increased survival of D‐ADSCs in the ischaemic model. After being seeded in 96‐well plates, 1×10⁴ D‐ADSCs (100 μmol/L dimethyloxalylglycine for 4 days) or V‐ADSCs were placed in four different environments (A), at 6, 12 and 24 hours, and CCK‐8 (F) and Live (green)/dead (red) assay (fluorescence (G), cell death rate (H)) were performed. The results display increased survivability of D‐ADSCs not only in the ischaemic model (B) characterized by low oxygen (1% O2), low glucose concentration (0.56 μmol/L) and low pH value (6.4) but also in each of these unfavourable environments individually (C, D, and E). **P<.05, **P<.01, scale bar=200 μm. ADSC, adipose‐derived stem cell
3.4. Alteration of energy and pH metabolism in D‐ADSCs
Next, we explored the metabolic alterations caused by DMOG preconditioning, and an approximately 50% decrease of mitochondrial mass was measured by staining with nonyl acridine orange, which binds to cardiolipin in mitochondrial membranes, in D‐ADSCs (Figure 3 NAO). The decline in mitochondrial mass was accompanied by 61% (cytosolic ROS, Figure 3 H2DCFDA) and 57% (mitochondrial ROS, Figure 3 MitoSOX™ RED) reduction in ROS levels as detected by dihydrodichlorofluorescein diacetate (H2DCFDA) or MitoSOX™ RED. Underlying these metabolic transformations was an obvious up‐regulation of mRNAs encoding BCL2/adenovirus E1B 19 kDa protein‐interacting protein 3, cytochrome c oxidase subunit 4 isoform 2 and pyruvate dehydrogenase kinase 1 (BNIP3, COX4I2 and PDK1, respectively), as evidenced by quantitative RT‐PCR (Figure 3E).
Figure 3.
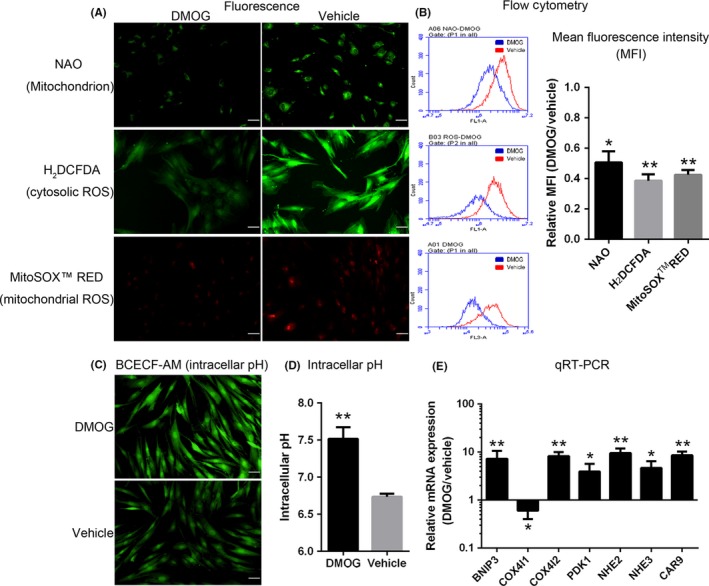
Alteration of energy and pH metabolism in D‐ADSCs. ADSCs were preconditioned with vehicle or dimethyloxalylglycine (DMOG) (100 μmol/L DMOG for 4 days), after which mitochondrial mass, mitochondrial reactive oxygen species (ROS) and cytosolic ROS (stained with fluorescent dyes nonyl acridine orange [NAO], MitoSOX™ RED and 2,7‐dichlorodihydrofluorescein diacetate [H2 DCFDA] respectively) were determined by fluorescence imaging (A) and flow cytometry (B). (C, D) Intracellular pH of ADSCs in acidic condition (pH 6.4) was detected by staining with BCECF‐AM after 24 hours. (E) Quantitative RT‐PCR analysis of HIF‐1 target genes encoding metabolic regulators in ADSCs. *P<.05, **P<.01, scale bar=50 μm. ADSC, adipose‐derived stem cell
The improved survival rate of D‐ADSCs in the acidic environment (Figure 2D) illustrated that DMOG preconditioning regulated pH homeostasis. Compared with V‐ADSCs, a distinct alkalinization of D‐ADSCs was discovered by the measurement of intracellular pH (7.52±0.09 vs 6.74±0.02; P<.01; Figure 3C,D). The expression of mRNA encoding sodium‐hydrogen exchangers, carbonic anhydrase 9 (NHE2, NHE3 and CAR9 respectively) was significantly increased in D‐ADSCs (Figure 3E).
3.5. Alteration of glycolytic metabolism in D‐ADSCs
Furthermore, the D‐ADSCs displayed significantly augmented glucose uptake, detected by staining with 2‐[N‐(7‐nitrobenz‐2‐oxa‐1,3‐diazol‐4‐yl) amino]‐2‐deoxy‐D‐glucose (Figure 4 2‐NBDG), along with increased lactate secretion (Figure 4E). Underlying these metabolic alterations was an obvious up‐regulation of mRNAs encoding glucose transporters, lactate dehydrogenase A and monocarboxylate transporter 4 (GLUT1, GLUT3, LDHA and MCT4 respectively) as measured by quantitative RT‐PCR (Figure 4F). In addition, another explanation for D‐ADSCs being more resistant to glucose deficiency (Figure 2E) could be the presence of an augmented reserve of glucose in the form of intracellular glycogen that can be mobilized promptly during nutrient deficiency. Indeed, D‐ADSCs displayed a substantial increase in intracellular glycogen as determined by periodic acid‐Schiff (PAS) staining (Figure 4C,D). Furthermore, D‐ADSCs expressed significantly higher levels of genes committed in glycogen synthesis (phosphoglucomutase [PGM] and glycogen synthase 1 [GYS1]) along with gene regulating glycogen breakdown (liver isoform of glycogen phosphorylase [PYGL]) (Figure 4F).
Figure 4.
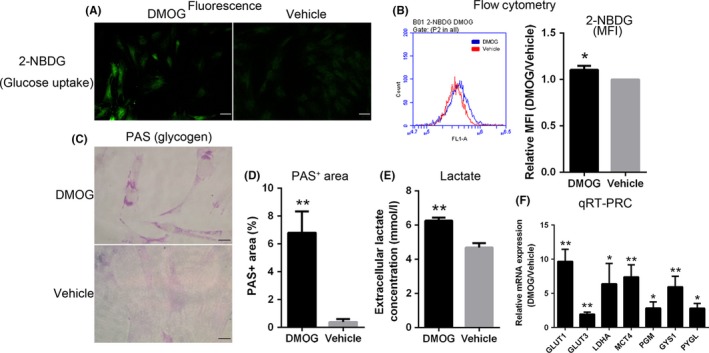
Alteration of glycolytic metabolism in D‐ADSCs. Using fluorescence imaging (A) and flow cytometry (B), glucose uptake was measured by staining ADSCs with 2‐[N‐(7‐nitrobenz‐2‐oxa‐1,3‐diazol‐4‐yl) amino]‐2‐deoxy‐D‐glucose (2‐NBDG) after dimethyloxalylglycine (DMOG) (100 μmol/L DMOG for 4 days) or vehicle preconditioning. (C, D) Intracellular glycogen of D‐ADSCs or V‐ADSCs was quantified by periodic acid‐Schiff (PAS) staining. (E) Extracellular lactate concentration in ADSC cultures. (F) Quantitative RT‐PCR analysis of HIF‐1 target genes encoding glycolytic regulators in ADSCs. *P<.05, **P<.01, scale bar=50 μm. ADSC, adipose‐derived stem cell
3.6. Enhanced angiogenic activities of D‐ADSCs in vitro
The consequence of DMOG preconditioning on angiogenesis of ADSCs was detected by tube formation assay. In spite of the ability of V‐ADSCs to form vessels in Matrigel, D‐ADSCs formed more tubes (Figure 5A), and total tube length (Figure 5B), total branching points (Figure 5C) and total tubes (Figure 5D) were significantly more by D‐ADSCs (1.4‐, 1.5‐ and 1.6‐fold respectively) than those formed by V‐ADSCs. Significantly higher expression of HIF‐1 downstream factors VEGF, VEGF‐R2 (vascular endothelial growth factor receptor 2) and von Willebrand factor (vWF) (Figure 5E) was seen in D‐ADSCs.
Figure 5.
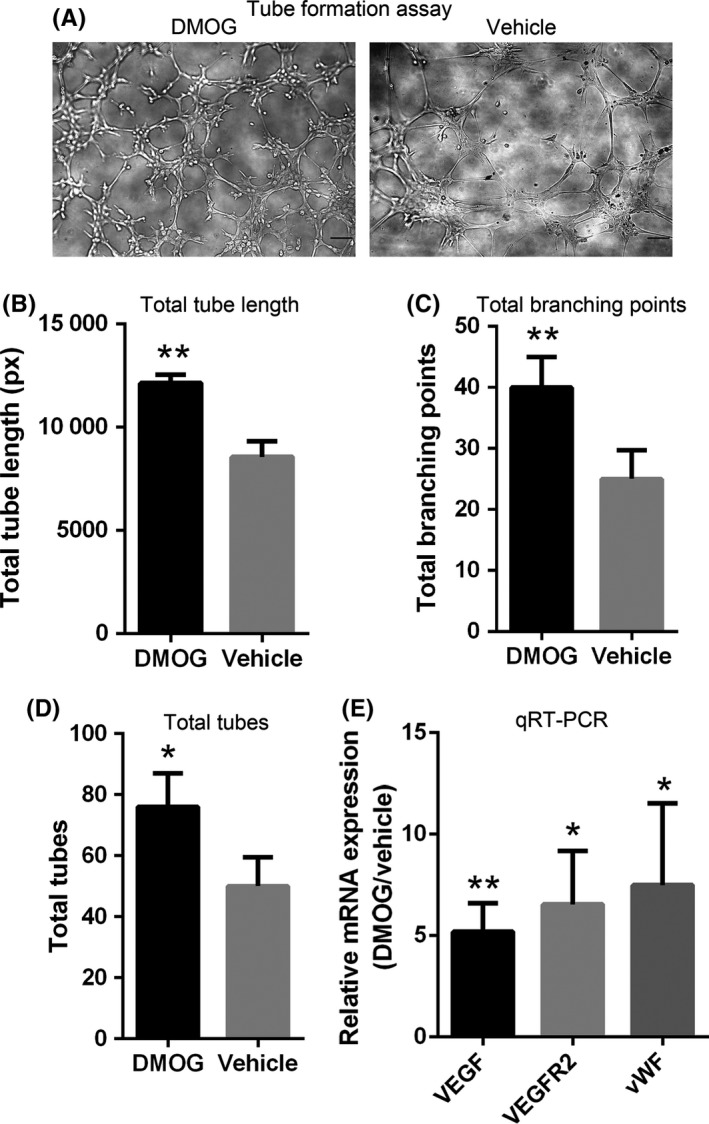
D‐ADSCs show enhanced angiogenesis. Approximately 2×10⁴ D‐ADSCs (100 μmol/L dimethyloxalylglycine for 4 days) or V‐ADSCs were seeded in 50 μL Matrigel‐coated in 96‐well plates for 6 hours. (A) Images of tube formation by ADSCs. Statistical analysis of (B) total tube length, (C) total number of branch points and (D) total number of tubes. (E) Quantitative RT‐PCR analysis of HIF‐1 target genes regulating angiogenesis in ADSCs. *P<.05, **P<.01, scale bar=100 μm. ADSC, adipose‐derived stem cell
3.7. Enhanced survival of D‐ADSCs in vivo
Implantation of D‐ADSCs with fibrin gel significantly promoted in vivo survival of these cells in mice measured by TUNEL assay (Figure 6A) and BrdU‐labelling (Figure 6D). For TUNEL assay, cell death was distinguished by the ratio of TUNEL‐positive cells vs total cells. In the V‐ADSCs group, 57.0±5.0%, 58.4±3.4% and 60.4±9.5% of total implanted cells were TUNEL‐positive 24, 48 and 72 hours later, respectively, while implanted D‐ADSCs displayed significantly decreased TUNEL‐positive cells of 22.7±5.3%, 30.3±11% and 38.3±4.0%, after 24, 48 and 72 hours respectively (Figure 6B).
Figure 6.
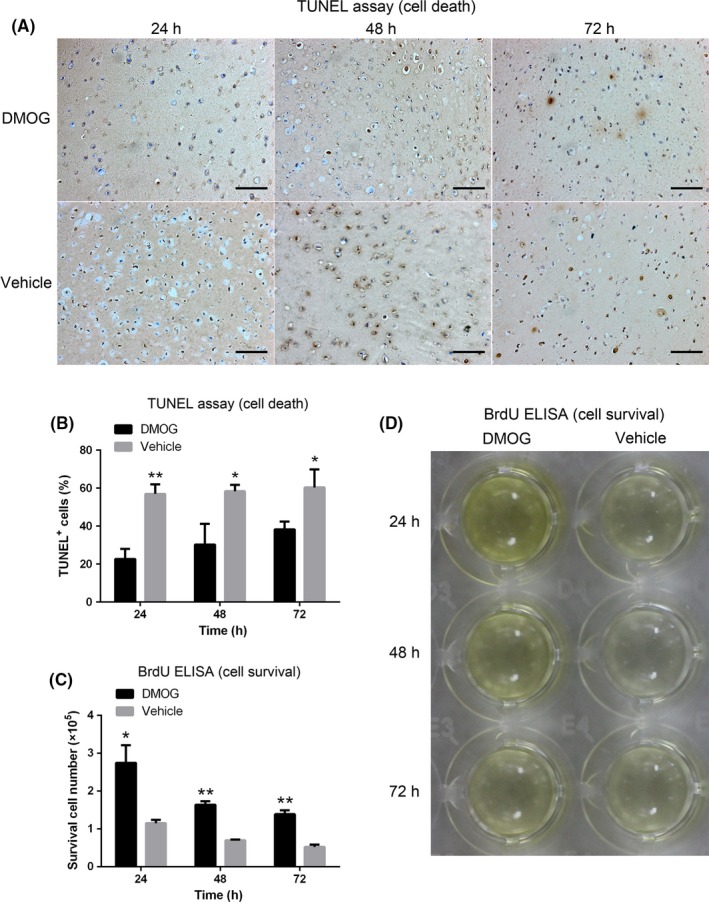
Enhanced survival of D‐ADSCs in vivo. Approximately 1×10⁶ D‐ADSCs (100 μmol/L dimethyloxalylglycine for 4 days) or V‐ADSCs were subcutaneously implanted in the dorsum of nude mice with 80 μL fibrin gel. At 24, 48 and 72 hours, the implants were extracted and analysed by TUNEL assay (A) and BrdU ELISA (D). (B) Ratio of TUNEL‐positive cells to total cells. (C) Number of surviving BrdU‐labelled ADSCs. *P<.05, **P<.01, scale bar=100 μm. ADSC, adipose‐derived stem cell
Implantation of BrdU‐prelabelled ADSCs in fibrin gel permitted the survival of transplanted cells to be detected by ELISA. As demonstrated in Figure 6C, the survival of ADSCs was significantly enhanced in the D‐ADSCs group vs the V‐ADSCs group (2.75±0.47, 1.64±0.09 and 1.39±0.10 vs 1.15±0.09, 0.70±0.02 and 0.52±0.06 [×105] after 24, 48 and 72 hours, respectively). The colour variation of ELISA in Figure 6D illustrates the impact of DMOG on the survival of implanted ADSCs.
4. DISCUSSION
The poor survival of engrafted cells in relatively ischaemic areas significantly affects the effectiveness of cell therapy.6 To improve this situation, DMOG, a PHD inhibitor, was used to pre‐treat ADSCs, and the present study demonstrates for the first time, to the best of our knowledge, that the activation of HIF‐1 can be used to promote ADSC survival after transplantation in vivo for cell therapy. The results show that 100 μmol/L DMOG preconditioning of ADSCs over 4 days gives rise to enhanced angiogenic activities and metabolic reprogramming. Moreover, the metabolic reprogramming of reduced mitochondrial mass and ROS levels and increased glucose uptake, glycogen storage, lactate secretion and intracellular pH contribute to the enhanced cell survival under acidic, hypoxic and nutrient‐depleted environment in vitro and in vivo. This consequence of cellular metabolism is in accordance with the alteration of multiple HIF‐1 target genes encoding mitophagy regulator (BNIP3), metabolic enzymes (COX4I1, COX4I2, LDHA and PDK1), membrane transporters (GLUT1, GLUT3 and MCT4), glycogen synthases (PGM and GYS1) and phosphorylase (PYGL), pH regulators (CAR9, NHE2 and NHE3), and angiogenic factors (VEGF, VEGF‐R2 and vWF).
It has been shown that ischaemic conditions characterized by low oxygen, glucose and pH is a major reason for poor cell survival in cell therapy.7 For this reason, we simulated an environment with 1% O2, pH 6.4 and 0.56 μmol/L glucose, and D‐ADSCs appeared more adapted to this unfavourable environment compared to V‐ADSCs. Afterwards, to clarify whether DMOG preconditioning plays a survival promoting role in acidic, hypoxic, or nutrient‐depleted environment, which leads to the above responses, ADSCs were separate subjected to hostile environments consisting of 1% O2/pH 6.4/0.56 μmol/L glucose, and the D‐ADSCs revealed enhanced survivability in these conditions as well. Some researchers have already explored the underlying mechanisms of survival in cells including mouse bone marrow‐derived angiogenic cells7 and murine periosteum‐derived cells,15 and we verified that the same metabolic reprogramming occurred in ADSCs. A subunit switch of cytochrome c oxidase (COX4I2 on, COX4I1 off [Figure 3E]), which increases its efficiency under hypoxic conditions (Figure 7h),17 and up‐regulated PDK1, which inactivates pyruvate dehydrogenase and shunts pyruvate away from the mitochondria (Figure 7g)18, 19 aided by selective mitophagy due to BNIP3 (Figure 7i),20 result in reduced mitochondrial mass (Figure 3 NAO) and ROS levels (Figure 3 H2DCFDA, MitoSOX™ RED) and help ADSCs to adapt to the hypoxic environment (Figure 2c); activated GLUT1 and GLUT3, which import glucose (Figure 7a) and LDHA, which increases flux from glucose to lactate (Figure 7a)23 accompanied by glycogen synthesis by PGM and GYS1 (Figure 7b) as well as glycogen breakdown by PYGL (Figure 7c) results in increased glucose uptake (Figure 4A,B) and storage as glycogen (Figure 4C,D), which assist ADSCs to survive nutrient depletion (Figure 2E); the acidic condition (Figure 2D) is overcome by increased intracellular pH (Figure 3C,D), due to the mRNA expression of CAR9, NHE2 and NHE3 (to export H+ [Figure 7f]) and MCT4 (to export lactate [Figures 4E and 7e]).24, 25, 35 The in vivo results also correspond with these demonstrations. Taken together, metabolic reprogramming induced by DMOG preconditioning promotes the survival of ADSCs in ischaemic conditions; on the other hand, our in vivo results demonstrate that the majority of cell death after implantation occurs within 24 hours (Figure 6B,C), consistent with previous studies.7, 36
Figure 7.
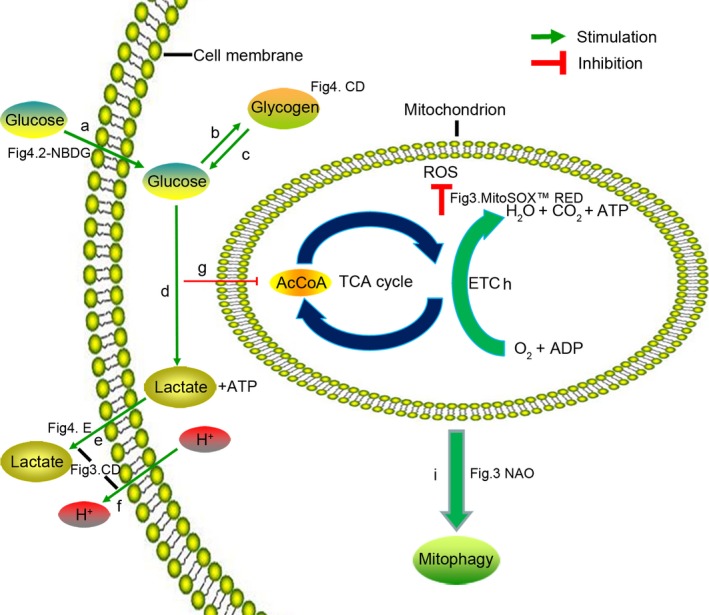
Adaptive metabolism of glucose, energy and pH in D‐ADSCs. (a) Glucose uptake (Figure 4 2‐NBDG), glucose transporters (GLUT1 and GLUT3); (b) glycogen synthases (PGM and GYS1), glycogen detection (Figure 4C,D, PAS staining); (c) glycogen phosphorylase (PYGL); (d) glycolysis (LDHA); (e) lactate discharge (Figure 4E, extracellular lactate), lactate transporter (MCT4); (f) H+ discharge (NHE2, NHE3 and CAR9); (e) and (f) are a reason of stabilization of intracellular pH (Figure 3C,D); (g) inactivating pyruvate dehydrogenase (PDK1); (h) subunit switch (COX4I1 to COX4I2) in ETC; (i) decrease in mitochondrial mass (Figure 3 NAO), mitophagy regulator (BNIP3). (g), (h) and (i) induce the decline of reactive oxygen species (Figure 3 MitoSOX™ RED). The expression of the genes mentioned above was measured as shown in Figures 3E and 4F. 2‐NBDG, 2‐[N‐(7‐nitrobenz‐2‐oxa‐1,3‐diazol‐4‐yl)amino]‐2‐deoxy‐D‐glucose; NAO, nonyl acridine orange; AcCoA, acetyl coenzyme A; TCA, tricarboxylic acid cycle; ROS, reactive oxygen species; ETC, electron transport chain; ATP, adenosine triphosphate; ADP, adenosine diphosphate; ADSC, adipose‐derived stem cell
When ADSCs encounter initial stages of ischaemia, they require the reestablishment of blood supply, which explains the significance of angiogenesis. We probed this capacity, and discovered an obvious promotion, indicating that DMOG treatment may be conducive to angiogenesis of ADSCs in cell therapy.
A notable drawback of cell therapy is the risk of tumorigeneses. Indeed, PHD inhibitors may provide an appropriate environment for tumour growth and metastasis by stabilizing HIF‐1, which plays a major role in tumorigenesis.1 However, preconditioning approaches usually regulate correlative genes over a relatively short term (within 1 week)37; this strategy might therefore not be accompanied by the risk of tumorigenesis. Moreover, some studies have dispelled this doubt. The transition of glutamine, which controls cell survival and proliferation, to glutathione in hypoxic cancer cells differs from the application of glutamine in skeletal progenitor cells.15, 38, 39, 40, 41 Ivanovic, Z et al.42 have investigated the tumorigenic potential of ADSCs in the presence of HIF‐1 pathway activation by telomerase activity assay as well as via mRNA expression levels of pRb, p16, p21 and p53, involved in tumour suppressor pathways, and found that the risk of tumorigenesis did not increase. As a result, gene modification of HIF‐1 may be suitable for clinical applications.
In summary, this study confirms that DMOG, a prolyl hydroxylase inhibitor, induces HIF‐1 activation and metabolic reprogramming including decreased ROS, increased intracellular pH value, and enhanced glucose uptake and glycogen synthesis in ADSCs and therefore presents a positive impact on cellular angiogenesis and survival rate in an ischaemic environment after transplantation. The results indicate an alternative strategy for improving the efficiency of cell therapy.
AUTHOR CONTRIBUTIONS
Study design: C.C., Q.T., W.J. and W.T.; data collection: C.C., Q.T., Y.Z. and M.D.; data analysis: C.C., Q.T., Y.C., H.W and M.Y.; manuscript preparation: C.C., W.J. and W.T.
CONFLICT OF INTEREST
The authors declare no potential conflicts of interest.
Supporting information
ACKNOWLEDGEMENTS
This study was supported by the National Natural Science Foundation of China (81300834, 31470947) and the National Key Research and Development Program of China (2016YFC1101404).
Chen C, Tang Q, Zhang Y, et al. Metabolic reprogramming by HIF‐1 activation enhances survivability of human adipose‐derived stem cells in ischaemic microenvironments. Cell Prolif. 2017;50:e12363 10.1111/cpr.12363
Contributor Information
Wei Jing, Email: jingwei@scu.edu.cn.
Weidong Tian, Email: drtwd@sina.com.
REFERENCES
- 1. Esfahani M, Karimi F, Afshar S, Niknazar S, Sohrabi S, Najafi R. Prolyl hydroxylase inhibitors act as agents to enhance the efficiency of cell therapy. Expert Opin Biol Ther. 2015;15:1739‐1755. [DOI] [PubMed] [Google Scholar]
- 2. Bourin P, Bunnell BA, Casteilla L, et al. Stromal cells from the adipose tissue‐derived stromal vascular fraction and culture expanded adipose tissue‐derived stromal/stem cells: a joint statement of the International Federation for Adipose Therapeutics and Science (IFATS) and the International Society for Cellular Therapy (ISCT). Cytotherapy. 2013;15:641‐648. [DOI] [PMC free article] [PubMed] [Google Scholar]
- 3. Nordberg RC, Loboa EG. Our fat future: translating adipose stem cell therapy. Stem Cells Transl Med. 2015;4:974‐979. [DOI] [PMC free article] [PubMed] [Google Scholar]
- 4. Castiglione F, Dewulf K, Hakim L, et al. Adipose‐derived Stem cells counteract urethral stricture formation in rats. Eur Urol. 2016;70:1032‐1041. [DOI] [PubMed] [Google Scholar]
- 5. Xu FT, Liang ZJ, Li HM, et al. Ginsenoside Rg1 and platelet‐rich fibrin enhance human breast adipose‐derived stem cell function for soft tissue regeneration. Oncotarget. 2016;7:35390‐35403. [DOI] [PMC free article] [PubMed] [Google Scholar]
- 6. Pourjafar M, Saidijam M, Mansouri K, Ghasemibasir H, Karimi Dermani F, Najafi R. All‐trans retinoic acid preconditioning enhances proliferation, angiogenesis and migration of mesenchymal stem cell in vitro and enhances wound repair in vivo. Cell Prolif. 2017;50. [DOI] [PMC free article] [PubMed] [Google Scholar]
- 7. Rey S, Luo W, Shimoda LA, Semenza GL. Metabolic reprogramming by HIF‐1 promotes the survival of bone marrow‐derived angiogenic cells in ischemic tissue. Blood. 2011;117:4988‐4998. [DOI] [PMC free article] [PubMed] [Google Scholar]
- 8. Rezaeian AH, Li CF, Wu CY, et al. A hypoxia‐responsive TRAF6‐ATM‐H2AX signalling axis promotes HIF1alpha activation, tumorigenesis and metastasis. Nat Cell Biol. 2017;19:38‐51. [DOI] [PMC free article] [PubMed] [Google Scholar]
- 9. Kaelin WG Jr, Ratcliffe PJ. Oxygen sensing by metazoans: the central role of the HIF hydroxylase pathway. Mol Cell. 2008;30:393‐402. [DOI] [PubMed] [Google Scholar]
- 10. Bosch‐Marce M, Okuyama H, Wesley JB, et al. Effects of aging and hypoxia‐inducible factor‐1 activity on angiogenic cell mobilization and recovery of perfusion after limb ischemia. Circ Res. 2007;101:1310‐1318. [DOI] [PubMed] [Google Scholar]
- 11. Ceradini DJ, Kulkarni AR, Callaghan MJ, et al. Progenitor cell trafficking is regulated by hypoxic gradients through HIF‐1 induction of SDF‐1. Nat Med. 2004;10:858‐864. [DOI] [PubMed] [Google Scholar]
- 12. Forsythe JA, Jiang BH, Iyer NV, et al. Activation of vascular endothelial growth factor gene transcription by hypoxia‐inducible factor 1. Mol Cell Biol. 1996;16:4604‐4613. [DOI] [PMC free article] [PubMed] [Google Scholar]
- 13. Kelly BD, Hackett SF, Hirota K, et al. Cell type‐specific regulation of angiogenic growth factor gene expression and induction of angiogenesis in nonischemic tissue by a constitutively active form of hypoxia‐inducible factor 1. Circ Res. 2003;93:1074‐1081. [DOI] [PubMed] [Google Scholar]
- 14. Simon MP, Tournaire R, Pouyssegur J. The angiopoietin‐2 gene of endothelial cells is up‐regulated in hypoxia by a HIF binding site located in its first intron and by the central factors GATA‐2 and Ets‐1. J Cell Physiol. 2008;217:809‐818. [DOI] [PubMed] [Google Scholar]
- 15. Stegen S, van Gastel N, Eelen G, et al. HIF‐1alpha promotes glutamine‐mediated redox homeostasis and glycogen‐dependent bioenergetics to support postimplantation bone cell survival. Cell Metab. 2016;23:265‐279. [DOI] [PMC free article] [PubMed] [Google Scholar]
- 16. Bridges JP, Lin S, Ikegami M, Shannon JM. Conditional hypoxia inducible factor‐1alpha induction in embryonic pulmonary epithelium impairs maturation and augments lymphangiogenesis. Dev Biol. 2012;362:24‐41. [DOI] [PMC free article] [PubMed] [Google Scholar]
- 17. Fukuda R, Zhang H, Kim JW, Shimoda L, Dang CV, Semenza GL. HIF‐1 regulates cytochrome oxidase subunits to optimize efficiency of respiration in hypoxic cells. Cell. 2007;129:111‐122. [DOI] [PubMed] [Google Scholar]
- 18. Kim JW, Tchernyshyov I, Semenza GL, Dang CV. HIF‐1‐mediated expression of pyruvate dehydrogenase kinase: a metabolic switch required for cellular adaptation to hypoxia. Cell Metab. 2006;3:177‐185. [DOI] [PubMed] [Google Scholar]
- 19. Papandreou I, Cairns RA, Fontana L, Lim AL, Denko NC. HIF‐1 mediates adaptation to hypoxia by actively downregulating mitochondrial oxygen consumption. Cell Metab. 2006;3:187‐197. [DOI] [PubMed] [Google Scholar]
- 20. Zhang H, Bosch‐Marce M, Shimoda LA, et al. Mitochondrial autophagy is an HIF‐1‐dependent adaptive metabolic response to hypoxia. J Biol Chem. 2008;283:10892‐10903. [DOI] [PMC free article] [PubMed] [Google Scholar] [Retracted]
- 21. Lum JJ, Bui T, Gruber M, et al. The transcription factor HIF‐1alpha plays a critical role in the growth factor‐dependent regulation of both aerobic and anaerobic glycolysis. Genes Dev. 2007;21:1037‐1049. [DOI] [PMC free article] [PubMed] [Google Scholar]
- 22. Seagroves TN, Ryan HE, Lu H, et al. Transcription factor HIF‐1 is a necessary mediator of the pasteur effect in mammalian cells. Mol Cell Biol. 2001;21:3436‐3444. [DOI] [PMC free article] [PubMed] [Google Scholar]
- 23. Iyer NV, Kotch LE, Agani F, et al. Cellular and developmental control of O2 homeostasis by hypoxia‐inducible factor 1 alpha. Genes Dev. 1998;12:149‐162. [DOI] [PMC free article] [PubMed] [Google Scholar]
- 24. Ullah MS, Davies AJ, Halestrap AP. The plasma membrane lactate transporter MCT4, but not MCT1, is up‐regulated by hypoxia through a HIF‐1alpha‐dependent mechanism. J Biol Chem. 2006;281:9030‐9037. [DOI] [PubMed] [Google Scholar]
- 25. Swietach P, Vaughan‐Jones RD, Harris AL. Regulation of tumor pH and the role of carbonic anhydrase 9. Cancer Metastasis Rev. 2007;26:299‐310. [DOI] [PubMed] [Google Scholar]
- 26. Chang CP, Chio CC, Cheong CU, Chao CM, Cheng BC, Lin MT. Hypoxic preconditioning enhances the therapeutic potential of the secretome from cultured human mesenchymal stem cells in experimental traumatic brain injury. Clin Sci (Lond). 2013;124:165‐176. [DOI] [PubMed] [Google Scholar]
- 27. Ghaffaripour HA, Jalali M, Nikravesh MR, Seghatoleslam M, Sanchooli J. Neuronal cell reconstruction with umbilical cord blood cells in the brain hypoxia‐ischemia. Iran Biomed J. 2015;19:29‐34. [DOI] [PMC free article] [PubMed] [Google Scholar]
- 28. Yan F, Yao Y, Chen L, Li Y, Sheng Z, Ma G. Hypoxic preconditioning improves survival of cardiac progenitor cells: role of stromal cell derived factor‐1alpha‐CXCR4 axis. PLoS ONE. 2012;7:e37948. [DOI] [PMC free article] [PubMed] [Google Scholar]
- 29. Sun J, Wei ZZ, Gu X, et al. Intranasal delivery of hypoxia‐preconditioned bone marrow‐derived mesenchymal stem cells enhanced regenerative effects after intracerebral hemorrhagic stroke in mice. Exp Neurol. 2015;272:78‐87. [DOI] [PubMed] [Google Scholar]
- 30. Wyatt CM, Drueke TB. HIF stabilization by prolyl hydroxylase inhibitors for the treatment of anemia in chronic kidney disease. Kidney Int. 2016;90:923‐925. [DOI] [PubMed] [Google Scholar]
- 31. Woo KM, Jung HM, Oh JH, et al. Synergistic effects of dimethyloxalylglycine and butyrate incorporated into alpha‐calcium sulfate on bone regeneration. Biomaterials. 2015;39:1‐14. [DOI] [PubMed] [Google Scholar]
- 32. Chen G, Sun W, Liang Y, Chen T, Guo W, Tian W. Maternal diabetes modulates offspring cell proliferation and apoptosis during odontogenesis via the TLR4/NF‐kappaB signalling pathway. Cell Prolif. 2017;50. [DOI] [PMC free article] [PubMed] [Google Scholar]
- 33. Wittmann K, Dietl S, Ludwig N, et al. Engineering vascularized adipose tissue using the stromal‐vascular fraction and fibrin hydrogels. Tissue Eng Part A. 2015;21:1343‐1353. [DOI] [PubMed] [Google Scholar]
- 34. Shim G, Im S, Lee S, Chen T, Guo W, Tian W. Enhanced survival of transplanted human adipose‐derived stem cells by co‐delivery with liposomal apoptosome inhibitor in fibrin gel matrix. Eur J Pharm Biopharm. 2013;85:673‐681. [DOI] [PubMed] [Google Scholar]
- 35. Ritter M, Fuerst J, Woll E, et al. Na(+)/H(+)exchangers: linking osmotic dysequilibrium to modified cell function. Cell Physiol Biochem. 2001;11:1‐18. [DOI] [PubMed] [Google Scholar]
- 36. Tang YL, Tang Y, Zhang YC, Qian K, Shen L, Phillips MI. Improved graft mesenchymal stem cell survival in ischemic heart with a hypoxia‐regulated heme oxygenase‐1 vector. J Am Coll Cardiol. 2005;46:1339‐1350. [DOI] [PubMed] [Google Scholar]
- 37. Liu XB, Wang JA, Ji XY, Yu SP, Wei L. Preconditioning of bone marrow mesenchymal stem cells by prolyl hydroxylase inhibition enhances cell survival and angiogenesis in vitro and after transplantation into the ischemic heart of rats. Stem Cell Res Ther. 2014;5:111. [DOI] [PMC free article] [PubMed] [Google Scholar]
- 38. Wise DR, Ward PS, Shay JE, et al. Hypoxia promotes isocitrate dehydrogenase‐dependent carboxylation of alpha‐ketoglutarate to citrate to support cell growth and viability. Proc Natl Acad Sci USA. 2011;108:19611‐19616. [DOI] [PMC free article] [PubMed] [Google Scholar]
- 39. Metallo CM, Gameiro PA, Bell EL, et al. Reductive glutamine metabolism by IDH1 mediates lipogenesis under hypoxia. Nature. 2011;481:380‐384. [DOI] [PMC free article] [PubMed] [Google Scholar]
- 40. Gameiro PA, Yang J, Metelo AM, et al. In vivo HIF‐mediated reductive carboxylation is regulated by citrate levels and sensitizes VHL‐deficient cells to glutamine deprivation. Cell Metab. 2013;17:372‐385. [DOI] [PMC free article] [PubMed] [Google Scholar]
- 41. Le A, Lane AN, Hamaker M, et al. Glucose‐independent glutamine metabolism via TCA cycling for proliferation and survival in B cells. Cell Metab. 2012;15:110‐121. [DOI] [PMC free article] [PubMed] [Google Scholar]
- 42. Ivanovic Z, Choi JR, Pingguan‐Murphy B, et al. In Situ Normoxia Enhances Survival and Proliferation Rate of Human Adipose Tissue‐Derived Stromal Cells without Increasing the Risk of Tumourigenesis. PLoS ONE. 2015;10:e0115034. [DOI] [PMC free article] [PubMed] [Google Scholar]
Associated Data
This section collects any data citations, data availability statements, or supplementary materials included in this article.
Supplementary Materials


