Abstract
Objectives
Stem cell therapy is considered to be a suitable alternative in treatment of a number of diseases. However, there are challenges in their clinical application in cell therapy, such as to reduce survival and loss of transplanted stem cells. It seems that chemical and pharmacological preconditioning enhances their therapeutic efficacy. In this study, we investigated effects of all‐trans retinoic acid (ATRA) on survival, angiogenesis and migration of mesenchymal stem cells (MSCs) in vitro and in a wound‐healing model.
Materials and methods
MSCs were treated with a variety of concentrations of ATRA, and mRNA expression of cyclo‐oxygenase‐2 (COX‐2), hypoxia‐inducible factor‐1 (HIF‐1), C‐X‐C chemokine receptor type 4 (CXCR4), C‐C chemokine receptor type 2 (CCR2), vascular endothelial growth factor (VEGF), angiopoietin‐2 (Ang‐2) and Ang‐4 were examined by qRT‐PCR. Prostaglandin E2 (PGE2) levels were measured using an ELISA kit and MSC angiogenic potential was evaluated using three‐dimensional tube formation assay. Finally, benefit of ATRA‐treated MSCs in wound healing was determined with a rat excisional wound model.
Results
In ATRA‐treated MSCs, expressions of COX‐2, HIF‐1, CXCR4, CCR2, VEGF, Ang‐2 and Ang‐4 increased compared to control groups. Overexpression of the related genes was reversed by celecoxib, a selective COX‐2 inhibitor. Tube formation and in vivo wound healing of ATRA‐treated MSCs were also significantly enhanced compared to untreated MSCs.
Conclusion
Pre‐conditioning of MSCs with ATRA increased efficacy of cell therapy by activation of survival signalling pathways, trophic factors and release of pro‐angiogenic molecules.
Keywords: All‐trans retinoic acid, cyclooxygenase‐2, mesenchymal stem cells, prostaglandin E2, stem cell therapy
1. Introduction
Stem cells are unspecialized self‐renewing cells with multilineage potential to differentiate into any mature specialized cell types.1, 2 Now, great attentions have directed towards MSCs, which are not any concern about teratoma formation and ethical consideration. MSCs are promising candidates for stem cell‐based therapies because they can be isolated from several tissues, such as bone marrow, adipose tissue and umbilical cord, and can be expanded in vitro.3 However, there are still critical obstacles to their utility including death of transplanted stem cells, and reducing stem cell migration or homing to the damaged tissue due to inflammatory responses, reactive oxygen species (ROS), apoptotic cascade activation, poor vascular supply, insufficient of trophic factors and loss of survival factor in injured area. Therefore, optimization of culture conditions can improve the efficiency of stem cell‐based therapy.4, 5
Scientists showed that hypoxia influences stem cell biology. In lower oxygen tension, migration of MSCs significantly increases compared with normoxia. Hypoxia increases VEGF expression, activates Akt signalling pathway and enhances the expression of various chemokine receptors such as CXCR4. These effects of hypoxia are mediated by HIF‐1.6
HIF‐1 is a heterodimeric transcription factor that consists of an oxygen‐regulated alpha subunit and a constitutively expressed beta subunit which changes the expression of several genes in response to alteration in oxygen tension.7 In cells replete with oxygen, prolyl hydroxylases are active and HIF‐1α is hydroxylated at proline residues, which is degraded via the von Hippel–Lindau‐proteasome pathway. In hypoxia, the prolyl hydroxylation is blocked and the stabilized alpha subunit translocated to the nucleus, where it dimerizes with the β subunit, and this complex binds to hypoxia‐responsive elements (HRE) within the promoter of hypoxia‐inducible genes.8, 9 Angiopoietin, VEGF, CXCR4 and matrix metalloproteinase (MMPs) are examples of HIF‐1 target genes, which have important roles in stem cell viability, proliferation and migration.10, 11
Several studies have shown that some of gene products can mimic the cytoprotective effects of hypoxia. These products include stromal‐derived factor‐1 (SDF‐1), heat shock proteins (HSPs), erythropoietin (EPO) and inflammatory intermediates, in particular PGE2, which stimulates the overexpression of HIF‐1 and other signalling pathway such as extracellular signal‐regulated kinase (ERK).12, 13
PGE2 is produced by the enzymatic action of cyclooxygenase (COX). It is synthesized from arachidonic acid and can modulate the expression of HIF‐1. COX‐2 is an inducible enzyme which is overexpressed in an inflammatory condition.14
ATRA is one of the most important retinoic acid isomers.15 ATRA plays critical roles in cell growth, apoptosis, reproduction, cell differentiation and immune function through binding to its nuclear receptors.16 The biological effects of retinoids are largely mediated by retinoic acid receptors (RARs), which are members of the steroid/thyroid‐hormone/vitamin‐D receptor family. RARs include RAR alpha, RAR beta and RAR gamma; they all act as transcription factors by binding to specific retinoic acid‐responsive elements (RAREs) in their promoter and activate transcription of target genes.17
Fernández‐Martínez et al. found that ATRA induces HIF‐1α expression and VEGF‐A production in HK2 cells (human renal proximal tubular cells). They have also shown that ATRA increases the expression of COX‐2 and the COX‐dependent production of PGE2 in other cell types.18
Therefore, in this study, we evaluated the protective effects of ATRA on MSC survival and other parameters involved in angiogenesis and migration. In addition, we investigated the efficiency of ATRA‐treated MSCs in in vivo wound‐healing model.
2. Methods
2.1. Experimental animals and Rat MSC isolation
Two adult male Wistar rats weighing 180–200 g were obtained from the animal facility of the Hamedan University of Medical Sciences of Iran. All rats were kept in standard conditions of humidity of 45–55% with a 12‐hours light/dark cycle at 20–22°C. They were fed with chow and water.
Rats were killed by intraperitoneal injections of ketamine/xylazine, and then their bone marrows were extracted by flushing the femur and tibia with DMEM medium (Gibco, Invitrogen) supplemented 15% foetal bovine serum (FBS; Gibco, Invitrogen). The cells were isolated by centrifugation at 1500 rpm for 7 min and resuspended in complete medium and then incubated at 37°C. When the cell confluence reached to 80–90%, cells were washed twice with PBS and MSCs were detached by trypsin/EDTA. All experiments were performed with the cells of passage number 2–6. This study was approved by Ethical Committee of Hamedan University of Medical Sciences based on National Institutes of Health Principles of Laboratory Animal Care (NIH publication no. 85‐23, revised 1985).
2.2. Characterization of MSCs
Surface markers of MSCs were analysed using flow cytometry. After the fourth passage, cultured MSCs were washed with PBS to remove the detached cells. About 200,000 cells were incubated in saturated concentration of PE‐ and FITC‐conjugated monoclonal rat antibodies against CD34, CD44, CD45, CD73 and CD90 for 40 min at 4°C. Cells were probed with secondary antibody for 15 min. Finally, results were analysed using FACS calibre cytometer (Becton Dickinson, San Diego, CA, USA) and CellQuest software.
2.3. Cell viability assay
To assay cell viability, the colorimetric MTT assay was used. Cells were seeded in 96‐well plates at a density of 5000 cells per well and then MSCs were treated with various concentrations of ATRA (0, 0.1, 0.5, 1, 10, 100 and 500 μmol/L). After incubation for 12, 24 and 48 hours, 3‐(4, 5‐Dimethylthiazol‐2‐yl)‐2, 5‐diphenyltetrazolium bromide (Sigma Aldrich, St Louis, MO, USA) was added and incubated for 4 hours at 37°C. The medium was discarded, and then 100 μL DMSO (Sigma‐Aldrich) was added. The optical density of solubilized formazan was measured at 570 nm using an automatic microplate reader.
2.4. Real‐time PCR
Total RNA from cell was extracted by the RNX Plus solution (Sinaclone, Tehran, Iran). Subsequently, 2 μg total RNA was used for cDNA synthesis in a final volume of 20 μL according to the manufacturer's instructions (Thermo Scientific Waltham, MA, USA). The volume of the PCR reaction mixture consisted of 1 μL cDNA, 7 μL H2O, 10 μL SYBR Premix Ex Taq 2 Kits (Takara, Seoul, Korea) and 1 μL of each primers. cDNA was amplified for 40 cycles: 95°C for 15 seconds, annealing for 30 seconds, and 72°C for 30 seconds. mRNA expression level was normalized to 18srRNA. Relative expression was reported by 2−ΔΔCT method analysis. Specific primers of genes are listed in Table 1.
Table 1.
Primer sequences for qRT‐PCR
| GENE | Sense strand | Antisense strand | Accession number |
|---|---|---|---|
| COX2 | TGCTGTTCCAACCCATGTCA | TCTTGTCAGAAACTCAGGCGT | NM_017232 |
| HIF1α | CCATTCCTCATCCATCAA | CCATCAACTCAGTAATCCT | NM_024359 |
| CXCR4 | CATGGAAATATACACTTCGGA | TGCCCACTATGCCAGTCAAG | NM_022205 |
| CCR2 | TGTTACCTCAGTTCATCCA | GTTCACCATCATCATAGTCAT | NM_021866 |
| VEGF | GTGTGTGTGTGTATGAAATCTGTG | GCAGAGCTGAGTGTTAGCAA | NM_001287107 |
| Angp2 | CAGTTCGTTGTTCCGTCTTGTG | CCGTATAGTAATAGTGTCCAGCCATT | NM_134454 |
| Angp4 | TCCATCCAGTATGAGAAC | GCAGTTATCATTGTCCAT | NM_001106526 |
| 18srRNA | GTAACCCGTTGAACCCCATT | CCATCCAATCGGTAGTAGCG | NR_046237 |
2.5. PGE2 measurement
After treatment of MSCs, supernatants were collected. The PGE2 released into the cell culture medium was measured by PGE2 ELISA kit using PGE2 standard curve, according to the manufacturer's instructions (Cayman Chemical).
2.6. Three‐dimensional vessel formation
HUVECs were cultured on dextran‐coated Cytodex 3 Micro carrier bead. Mixed suspension was shaken every 20 minutes in humid 37°C incubator for 3–4 hours and then transferred into 6‐well plates and incubated in 37°C for 18–20 hours. After this time, beads were resuspended in ice‐cold collagen and 10X DMEM. This mixture was added in 96‐well tissue culture plate and allowed to solidify for 10 min at room temperature. Then, DMEM media and different concentrations of ATRA (0, 0.1, 1, 10, 100 μmol/L) were added to each well. Cells were monitored after 48 hours. Sprouts formation was measured using NIH Image J software and presented as a percentage.19
2.7. Wound‐healing model
Eighteen adult male Wistar rats were anesthetized by intraperitoneal injection of xylazine and ketamine.20 After shaving the dorsal surfaces of rats, one wound (8 mm in diameter) was created on the midline of the rat's neck. Rats were randomly divided into three groups, which were treated with 100 μL PBS, 1×10⁶ MSCs in 100 μL PBS alone and 1×10⁶ ATRA‐treated MSCs in 100 μL PBS around the wounds at four injection sites. Four wounds per treatment were evaluated by histopathological examination.21, 22 Analysis of reduction in wound size was calculated as follows: (Area of initial wound − Area of wound on day X)/Area of initial wound×100, X=0, 6, 9 and 14.
2.8. Histology
For histological examination, skin specimens from wound area were fixed in 10% formalin and embedded in paraffin, and the 3 μm sections of the sample were obtained. Sections were stained with haematoxylin and eosin (H&E) to evaluate angiogenesis and re‐epithelialization. Masson's trichrome was used for collagen staining.
2.9. Statistical analysis
The statistical significance of the mean differences between groups was analysed by one‐way ANOVA and Tukey's post hoc tests. Statistically significant differences were assumed at P<.05. The results are reported as mean±standard error of the mean (SEM).
3. Result
3.1. MSC characterization
Cell surface characterization of MSCs using flowcytometry revealed that MSCs expressed CD44, CD73 and CD90 and were negative for expressions of CD34 and CD45 (Figure 1).
Figure 1.
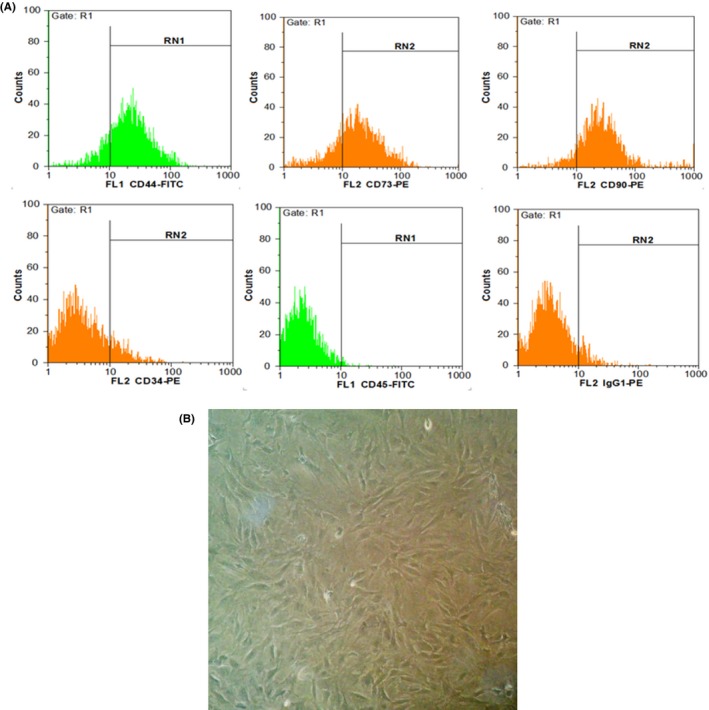
Characterization of MSC using flow cytometry. A, MSCs were positive for CD73, CD44 and CD90, while they were negative for CD34 and CD45 (hematopoietic markers). B, MSCs after fourth passage in 90% confluency. Cells showed fibroblast like morphology (long and thin) under phase contrast microscope
3.2. ATRA increased MSC viability
MSC viability present in different concentrations of ATRA was tested by MTT assay. As shown in Figure 2, ATRA significantly enhanced proliferation of MSCs at 24 and 48 hours. The MSC viability was significantly higher in all treated MSCs excepted 0.1 μmol/L ATRA for 24 and 48 hours compared with the control. Moreover, during the 12 hours, no significant differences were observed (data not shown).
Figure 2.
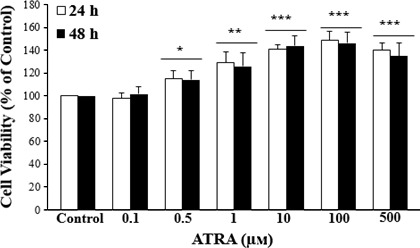
Effect of ATRA on MSCs proliferation. MSCs were treated with various concentrations of ATRA for 24 and 48 hours and their viability were examined by MTT assay. MTT results indicated that MSCs viability and proliferation increased by ATRA compared to the control group. Data are represented as the mean±SEM (n=8). *P<.05, **P<.01, ***P<.001, compared with control
3.3. ATRA elevated thePGE2 levels:
MSCs were treated with several doses (1, 10, 100 μmol/L) of ATRA to evaluate the effect of ATRA on PGE2 levels. As shown in Figure 3, compared with control group, pre‐treatment with ATRA significantly increased the PGE2 levels in a dose‐depended manner in MSCs.
Figure 3.
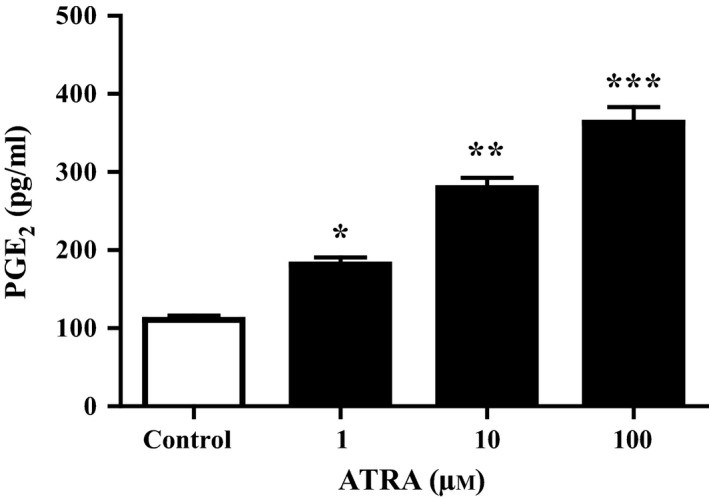
Measurement of PGE2 levels in MSCs. The cells were treated with 0, 1, 10 and 100 μmol/L ATRA for 24 hours. PGE2 levels in the culture medium were measured by ELISA. ATRA significantly increased PGE2 levels. Data are reported as mean±SEM (n=3). *P<.05, **P<.01, ***P<.001 vs control cells
3.4. ATRA increased the expression of genes involved in MSC survival, migration and angiogenesis
Quantitative real‐time PCR was performed on ATRA‐treated and untreated MSCs, and results showed that ATRA markedly enhanced the mRNA levels of COX‐2, HIF‐1, CXCR4, CCR2, VEGF, Ang‐2 and Ang‐4 compared with untreated MSCs. However, the overexpression of these genes was downregulated by pretreating cells with celecoxib (50 μmol/L) (Figure 4).
Figure 4.
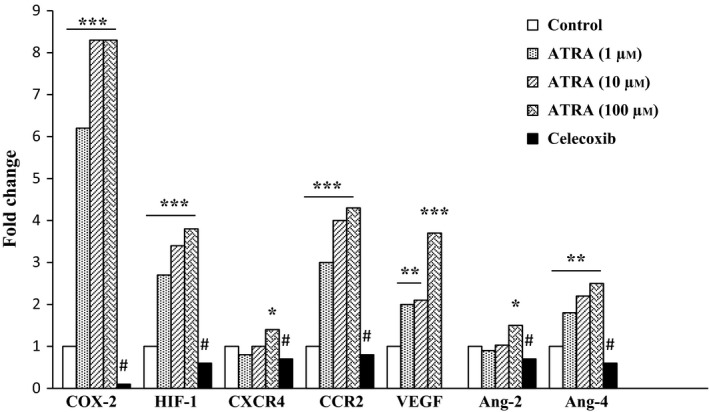
Effect of ATRA on expression of genes involved in MSCs survival, migration and angiogenesis. MSCs were treated with ATRA (0, 1, 10 and 100 μmol/L) for 24 hours, and the expression of genes was measured by qRT‐PCR. The expression of these genes was significantly increased compared to untreated control. These effects were inhibited by celecoxib. Data were normalized to levels of 18s rRNA. *P<.05, **P<.01 and ***P<.001 vs non‐treated MSCs and # P<.001 vs 100 μmol/L ATRA‐treated MSCs. Cyclooxygenase‐2, COX‐2; hypoxia‐inducible factor‐1, HIF‐1; C‐X‐C chemokine receptor type 4, CXCR4; C‐C chemokine receptor type 2, CCR2; Vascular endothelial growth factor, VEGF; Angiopoietin‐2, Ang‐2; and Angiopoietin‐4, Ang‐4
3.5. ATRA promoted the vascular sprout formation
By the use of three‐dimensional model of angiogenesis, we evaluated the effects of ATRA on vessel formation. ATRA at 1 μmol/L had significantly higher levels of endothelial cell sprouts formation compared with the untreated group. In contrast, ATRA at lower and higher concentrations had no stimulatory effect on vessel formation, and results were similar to the control group (Figure 5).
Figure 5.
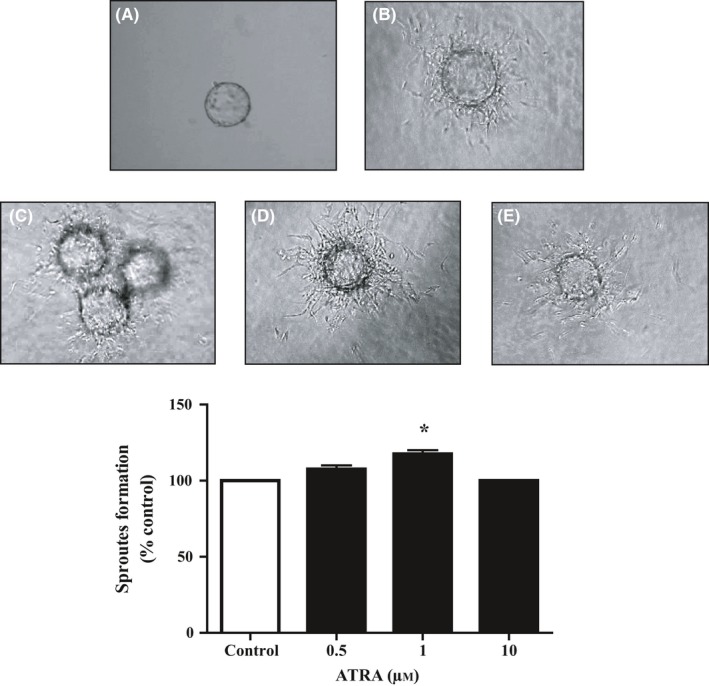
Effect of ATRA on capillary formation potential of HUVECs. Capillary sprout formation of HUVECs in (A) medium with 2% FBS in the first day, (B) medium with 2% FBS, (C) 0.5 μmol/L (D) 1 μmol/L and (E) 10 μmol/L ATRA‐treated HUVECs were analyzed by inverted microscopy after 48 hours. The alternation in sprout formation determined by NIH image J. Data reported as mean±SEM (n=3); *P<.05 vs control
3.6. ATRA‐treated MSCs enhanced wound healing in rats
Rats that received ATRA‐treated MSCs showed acceleration wound closure than control and untreated group at days 6, 9 and 14. Wound closure rates in groups injected with MSCs and ATRA‐treated MSCs were markedly higher than in those injected with PBS after 6 days. Moreover, at days 9 and 14, wound closure rate in rats injected with ATRA‐treated MSCs was remarkably higher compared with the other two groups (P<.01) (Figure 6).
Figure 6.
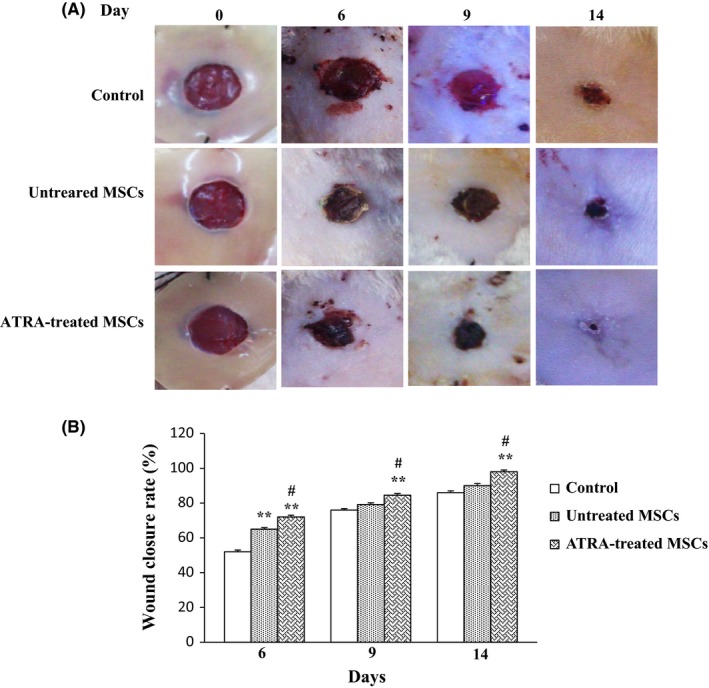
Effects of MSC on wound closure. A, Images of wounds injected with PBS, untreated MSCs and ATRA‐treated MSCs after 0, 6, 9 and 14 days. B, Representation of average wound closure rate in all groups using NIH ImageJ software. Data are reported as mean±SEM. (n=3; *P<.05, **P<.01 vs control, # P<.05 vs untreated MSCs)
3.7. ATRA enhanced angiogenesis in wounds
Mean of vascular structure per high‐power field (x400) in microscopic evaluation is significantly higher in groups injected with untreated MSCs and ATRA‐treated MSCs compared with those injected with PBS. Angiogenesis significantly increased in the group received ATRA‐treated MSCs compared with untreated MSCs (P<.05) and control group (P<.01) on 9 days. Angiogenesis enhanced over the first 6 days and reached its maximum level after 9 days (Figure 7). It then decreased by day 14 in all groups (data not shown).
Figure 7.
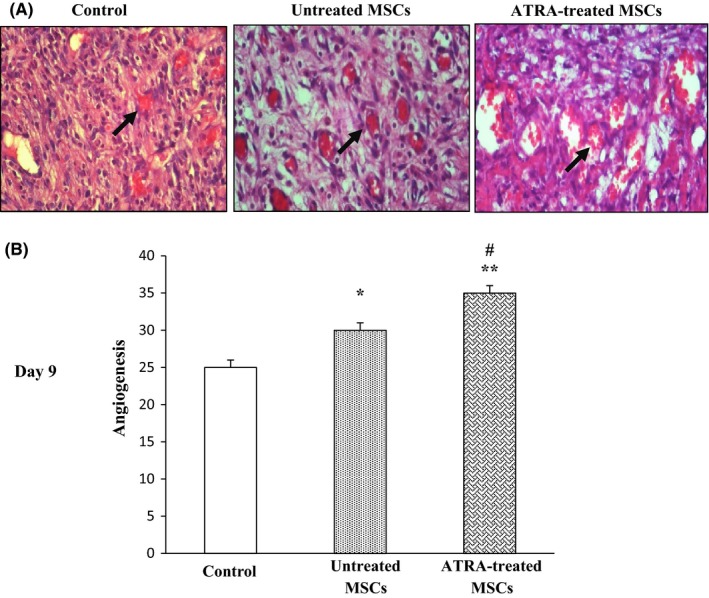
Effect of ATRA on wound vascularity. A, Representative images of histological sections of wounds in rat treated with PBS, untreated MSCs and ATRA‐treated MSCs are shown after 9 days. Arrows signify blood vessels. B, Comparison between angiogenic scores in groups after 9 days. Data are represented as mean±SEM. (n=3); *P<.05, **P<.01 vs control and # P<.05 vs untreated MSCs
3.8. ATRA promoted wound collagenization and epithelialization
It was shown that the groups which were injected with untreated MSCs and ATRA‐treated MSCs had significantly higher levels of collagenization and epithelialization compared with those injected with PBS. Collagenization was quantified using customized Image J software. According to the presence of closely packed and thick collagen bundles in Masson staining, percent of collagenization is significantly higher in ATRA‐treated MSCs compared with others. Increased collagen levels of ATRA‐treated MSC groups reached to maximum levels by 9 days compared with control groups (P<.001). Collagen levels were significantly higher in groups injected with ATRA‐treated MSCs compared with those injected with untreated MSCs after 6 (P<.05) and 9 days (P<.01). They did not have any significant alteration after 14 days in all groups (Figures 8A,B).
Figure 8.
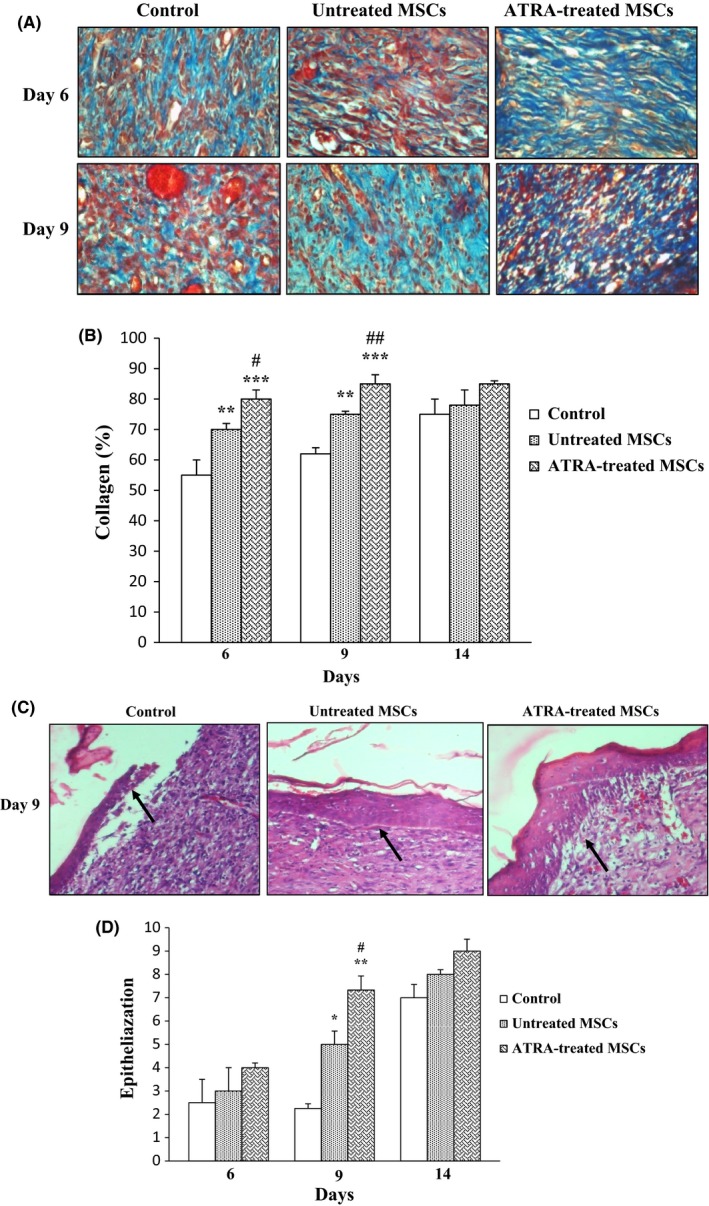
Effect of ATRA on collagenization and epithelialization. A, Masson's trichrome staining was used for assessment of collagenization. Fibers of collagen are stained blue and arrows signify collagen fibers. Wounds injected with ATRA‐treated MSCs and untreated MSCs had higher tissue collagenization compared to those injected with PBS at 6 and 9 days. Intensity of staining was compared with normal skin on day 0 was determined by NIH image J. B, Comparison between percent of collagen fibers in groups within 14 days. C, Epithelialization was evaluated using H&E staining of wound sections. Arrows signify epithelium. Wounds injected with ATRA‐treated MSCs had higher tissue epithelialization compared to untreated MSCs and PBS groups at 9 days. D, Comparison between the number of epithelium layers in groups. Data are represented as mean±SEM. (n=30) *P<.05, **P<.01, ***P<.001 vs control group and # P<.05, ## P<.01 vs untreated MSCs
Epithelialization of wounded area also was enhanced in all groups according to stratification and cell layer of squamous epithelium over the 14‐day experimentation. Wound injected with ATRA‐treated MSCs had higher levels of epithelialization compared with control wounds (P<.01) and untreated MSCs (P<.05) after 9 days (Figure 8C,D).
4. Discussion
Over the last decade, stem cell‐based therapy has emerged as an appealing approach for promoting therapy for various diseases and therapeutic potential of adult stem cells is the main focus of scientific research. Nonetheless, the current stem cell‐based therapies have not yet reached to many synthetic drug delivery system achievements.1, 23 Hence, pre‐treatment strategies for promotion function of stem cell before transplantation can increase the efficacy of the treatment and personalized medicine.12
The main objectives of this study were to inquire the effects of ATRA on the number of molecular mechanisms associated with survival, angiogenesis and migration of MSCs and improve the performance of MSCs in vitro. For this purpose, the MSCs were treated with different concentrations of ATRA, and then to confirm ATRA‐induced COX2, the expression of COX2 and the level of its product, PGE2, were evaluated. ATRA‐treated MSCs showed a significant increase in COX‐2 expression and PGE2 level. Several studies have shown the effects of ATRA on the COX2 and PGE2 levels, and they have confirmed the validity of our study.18, 24 Alique et al. explained ATRA induces changes in the spinal cord similar to those observed in inflammation. The sensitization‐like effect induced by administration of ATRA was mediated by RARs and related to the modulation of COX‐2 and interleukin‐1 activities.25 Transcriptional mechanisms were involved in the COX‐2 upregulation by ATRA. The transcriptional effects of ATRA are most commonly mediated through binding to nuclear receptors RARs, which normally act as ligand‐inducible transcription factors via binding to ATRA response elements known as RAREs.26 Several studies have reported that ATRA enhances ERK1/2 phosphorylation and ERK1/2 plays a key role in the upregulation of COX‐2 by ATRA.25, 27, 28, 29, 30 Alique et al. have observed a subpopulation of classical RAR and RXR receptors localized at or near the cell membrane in rat mesangial cells (MC), which could be responsible for ATRA‐induced COX‐2 upregulation through ERK1/2 phosphorylation.31 In contrast to these findings and our study, ATRA inhibited COX‐2, PGE2 and thromboxane A2 (TXA2) (the other product of COX‐2) by the TGF β/Smad‐signalling pathway in rat MC.32 These differences could be related to diversity of ATRA concentrations and study conditions.
Hypoxic preconditioning can trigger the therapeutic effects of MSCs and enhances survival, differentiation and homing to the injured tissue.12 In hypoxia, the key regulator of this condition is HIF‐1 that changes its downstream genes expression.33 Our results revealed that in addition to COX2 induction, expression of HIF‐1α was significantly higher in ATRA‐treated MSCs compared with non‐treated MSCs, whereas celecoxib reversed the HIF‐1α expression. Along with this result, other studies have reported that ATRA upregulates HIF‐1α in normoxia in HK‐2 cells and increases HIF‐1α mRNA half‐life, but there is no alternation in HIF‐1α protein under hypoxia. Also, ATRA‐induced HIF‐1α upregulation requires for induction of RARβ in renal tissue. ATRA exerts its effects on HIF‐1α and VEGF‐A production through COX2 activity and intracellular PGE2 in HK‐2 cells. These results confirmed that PGE2 mediates the effects of ATRA on HIF‐1α expression.18, 34 However, one study showed that ATRA protects hypoxia‐induced injury via suppression of VEGF expression and inhibition of the NFκB pathway and HIF‐1 as a key regulator for cellular responses to hypoxia.35
It appears that alpha subunit of HIF is not only regulated by the O2 concentration but also is controlled by various other stimuli, such as cytokines, nitric oxide, transition metals, growth factors and mechanical stresses.36 The COX‐2 expression is known to catalyse the synthesis of prostaglandins, particularly the PGE2 that induces the HIF‐1 expression and von Hippel–Lindau tumour suppressor (VHL) protein degradation. As a result, the sustained expression of VHL protein played an essential regulatory role in suppressing hypoxia‐induced HIF‐1a accumulation.37 Jones et al. reported that non‐steroidal anti‐inflammatory drugs (NSAID) improved the VHL expression through COX‐2 inhibition, which targeted HIF‐1α for ubiquitination and decreased HIF‐1 stabilization.38 It has been shown that the nuclear localization of HIF‐1α is repressed by COX‐2 inhibitor and PGE2 effects on HIF‐1α is controlled by MAP kinase signalling pathway in PC‐3ML human prostate tumour cell. However, COX‐2 inhibitors suppress prostate cancer growth and angiogenesis via regulation of HIF‐1α and VEGF.14
In this study, we examined the effect of ATRA on CXCR4 and CCR2 expression. Stem cell therapy success depends on the migration of the transplanted cells. Chemokines are small polypeptides that coordinate stromal cells traffic throughout tissue microenvironments. Chemokines and growth factors illustrate chemotactic effects on bone marrow MSCs. Hence, it seems that chemokines and their receptors are important factors to control cell migration through phosphorylation of mitogen‐activated protein kinase (MAPK) and focal adhesion kinase (FAK) pathways.39, 40 It has been shown that PGE2‐induced myeloid‐derived suppressor cells relocated to ascites in ovarian cancer patients due to both CXCL12 and CXCR4.41 ATRA treatment enhances migration of MOLT‐3 cell lines (T lymphoblast) via M‐CXCR4/SDF‐1 axis and the PI3K/Akt pathway.42
However, celecoxib repressed CD133‐positive cell migration through decrease of CCR2 expression levels of gastric cancer tissue in Helicobacter pylori‐infected gastritis model.43
Moreover, our previous studies showed that HIF‐1 directly increased the expression of CXCR4 and CCR2 on the surface of the DFO‐treated MSCs.44 In low oxygen concentration, CXCR4 expression increased in different cell types that lead to high chemotactic response to CXCL12.45 Thus, we think that increased expression of HIF‐1 in cells treated with ATRA can indirectly increase the expression of CXCR4 and CCR2 in addition to increased expression of COX2.
Adequate new blood vessel formation is essential for stem cell survival, proliferation and wound healing. Our results showed that ATRA‐treated MSCs displayed a significant increase in VEGF, Ang‐2, Ang‐4 gene expression and capillary tube formation of HUVECs, compared with non‐treated MSCs. In order to investigate COX‐2 mediated effect of ATRA on angiogenic genes, the expression levels of these genes were measured in presence of COX‐2 inhibitor. Celecoxib treatment reversed the ATRA‐mediated increases of genes expression. These findings reveal that COX‐2 is an essential mediator in induction of angiogenic factors. These results are similar to our previous study indicating that endothelin‐1‐induced COX‐2 can increase the VEGF, Ang‐2 and Ang‐4 expression in MSCs.46
Along with this result, one research has also shown that ATRA has high stimulatory effects on endothelial cells vessel formation in vitro model in the presence of fibrin and inflammatory mediators.47 This proangiogenic effect of ATRA was reported in low concentration. Angiogenic effect of ATRA also has been showed in the chicken chorioallantoic membrane assay.48 ATRA enhances the expression of the VEGF gene in human retinal pigment epithelial cells.49 ATRA is also demonstrated to induce angiogenesis through RAR mainly by induction of hepatocyte growth factor and angiopoietin‐2 generation.50 Conversely, Kini et al. have reported that ATRA suppresses VEGF production and angiogenesis and decreases microvessel density in bone marrow of acute promyelocytic leukaemia patients.51 The difference in results may be due to the kind of cell and concentration of ATRA in these examinations. Under hypoxic condition, HIF‐1 increases the mRNA and protein levels of VEGF, Ang‐2 and Ang‐4 in primary human endothelial cells.52 VEGF as a primary key regulator of cell proliferation, differentiation and migration is induced by hypoxia. Hypoxic‐induced COX‐2 increases the expression of VEGF and angiogenesis through p38 and JNK kinase activation pathways.53 Family of angiopoietins is another factor that is involved in angiogenesis. Angiopoietins bind to their tyrosine kinase Tie‐2 receptors and active signalling pathways. In the presence of VEGF, Ang‐2 enables to make existing vasculature more responsive to angiogenic stimuli. Moreover, Ang‐4 has stimulatory effect on the endothelial cell migration and capillary formation.54
In this study, we used an excisional wound model in rat to confirm whether increased in vitro angiogenic potential of ATRA contributes to improve wound healing.
Wound healing is a complex chain of processes that contains interaction among a variety of different cells and biological factors involve in cell migration, proliferation, extracellular matrix (ECM) deposition and angiogenesis. Some studies showed that MSCs would promote wound healing.55 Also, pretreatment of cell with ATRA increases the wound healing in mice diabetic ulcers.56 Therefore, ATRA‐treated MSCs seem to be more potent and benefit for wound healing. Since revascularization is one of the essential process for wound healing, we hypothesized that angiogenic factor studied in vitro resulting in angiogenesis of wound site in rat surgical wound model. Results of histology showed that rats’ ulcers which were injected with ATRA‐treated MSCs have more vessels in terms of size and number. In this regard, several immature blood vessels were developed and calibre of existing vessels increased. Based on other studies, it seems that VEGF is important for angiogenesis during granulation tissue formation from day 4 to 7.57
Our data showed that collagen, epithelialization and wound closure significantly were increased in ATRA‐treated MSC group. Brem et al. (2009) demonstrated that VEGF is effective in accelerating wound closure rate by stimulating angiogenesis, epithelialization and collagenization.58 The results of Mehrabani et al. also showed that conditioned medium derived from DFO‐treated cells due to higher angiogenic potential promotes epithelialization, collagenization and wound closure rate compared to CM derived from non‐treated cells.21
In conclusion, our results suggest that ATRA may act as an important indicator in cultured MSCs by inducing multiple chemokine receptors and angiogenic factors. Therefore, preconditioning of stem cells with ATRA before transplantation could enhance their therapeutic capacity.
Conflict of interest
The authors declare no conflict of interests related to this study.
Acknowledgements
This study was supported by a grant from the Hamedan University of Medical Sciences and Iranian Council of Stem Cell Technology.
References
- 1. Srijaya TC, Ramasamy TS, Kasim NHA. Advancing stem cell therapy from bench to bedside: Lessons from drug therapies. J Transl Med. 2014;12:1. [DOI] [PMC free article] [PubMed] [Google Scholar]
- 2. Herberts CA, Kwa MS, Hermsen HP. Risk factors in the development of stem cell therapy. J Transl Med. 2011;9:1. [DOI] [PMC free article] [PubMed] [Google Scholar]
- 3. Wei X, Yang X, Han Z‐P, Qu F‐F, Shao L, Shi Y‐F. Mesenchymal stem cells: A new trend for cell therapy. Acta Pharmacol Sin 2013;34:747–754. [DOI] [PMC free article] [PubMed] [Google Scholar]
- 4. Kang SK, Shin IS, Ko MS, Jo JY, Ra JC. Journey of mesenchymal stem cells for homing: Strategies to enhance efficacy and safety of stem cell therapy. Stem Cells Int 2012;2012:342968. doi: 10.1155/2012/342968. [DOI] [PMC free article] [PubMed] [Google Scholar]
- 5. Haider HK, Ashraf M. Strategies to promote donor cell survival: Combining preconditioning approach with stem cell transplantation. J Mol Cell Cardiol. 2008;45:554–566. [DOI] [PMC free article] [PubMed] [Google Scholar]
- 6. Mohyeldin A, Garzón‐Muvdi T, Quiñones‐Hinojosa A. Oxygen in stem cell biology: A critical component of the stem cell niche. Cell Stem Cell. 2010;7:150–161. [DOI] [PubMed] [Google Scholar]
- 7. Semenza GL. Hypoxia‐inducible factor 1: Control of oxygen homeostasis in health and disease. Pediatr Res. 2001;49:614–617. [DOI] [PubMed] [Google Scholar]
- 8. Li YM, Zhou BP, Deng J, Pan Y, Hay N, Hung M‐C. A hypoxia‐independent hypoxia‐inducible factor‐1 activation pathway induced by phosphatidylinositol‐3 kinase/Akt in HER2 overexpressing cells. Cancer Res. 2005;65:3257–3263. [DOI] [PubMed] [Google Scholar]
- 9. Fernández‐Martínez AB. Cazaña FJL. Epidermal growth factor receptor transactivation by intracellular prostaglandin E 2‐activated prostaglandin E 2 receptors. Role in retinoic acid receptor‐β up‐regulation. Biochimica et Biophysica Acta (BBA)‐Molecular. Cell Res. 2013;1833:2029–2038. [DOI] [PubMed] [Google Scholar]
- 10. Esfahani M, Karimi F, Afshar S, Niknazar S, Sohrabi S, Najafi R. Prolyl hydroxylase inhibitors act as agents to enhance the efficiency of cell therapy. Expert Opin Biol Ther. 2015;15:1739–1755. [DOI] [PubMed] [Google Scholar]
- 11. Ortiz‐Barahona A, Villar D, Pescador N, Amigo J, del Peso L. Genome‐wide identification of hypoxia‐inducible factor binding sites and target genes by a probabilistic model integrating transcription‐profiling data and in silico binding site prediction. Nucleic Acids Res. 2010;38:2332–2345. [DOI] [PMC free article] [PubMed] [Google Scholar]
- 12. Yu SP, Wei Z, Wei L. Preconditioning strategy in stem cell transplantation therapy. Transl Stroke Res. 2013;4:76–88. [DOI] [PMC free article] [PubMed] [Google Scholar]
- 13. Fukuda R, Kelly B, Semenza GL. Vascular endothelial growth factor gene expression in colon cancer cells exposed to prostaglandin E2 is mediated by hypoxia‐inducible factor 1. Cancer Res. 2003;63:2330–2334. [PubMed] [Google Scholar]
- 14. Liu XH, Kirschenbaum A, Lu M, Yao S, Dosoretz A, Holland JF, et al. Prostaglandin E2 induces hypoxia‐inducible factor‐1α stabilization and nuclear localization in a human prostate cancer cell line. J Biol Chem. 2002;277:50081–50086. [DOI] [PubMed] [Google Scholar]
- 15. Liang C, Guo S, Yang L. All‐trans retinoic acid upregulates VEGF expression in glioma cells in vitro. J Biomed Res. 2013;27:51–55. [DOI] [PMC free article] [PubMed] [Google Scholar]
- 16. Adamson PC. All‐trans‐retinoic acid pharmacology and its impact on the treatment of acute promyelocytic leukemia. Oncologist. 1996;1:305–314. [PubMed] [Google Scholar]
- 17. Zhang R, Wang Y, Li R, Chen G. Transcriptional Factors Mediating Retinoic Acid Signals in the Control of Energy Metabolism. Int J Mol Sci. 2015;16:14210–14244. [DOI] [PMC free article] [PubMed] [Google Scholar]
- 18. Fernández‐Martínez AB, Jiménez MIA, Cazaña FJL. Retinoic acid increases hypoxia‐inducible factor‐1α through intracrine prostaglandin E 2 signaling in human renal proximal tubular cells HK‐2. Biochim Biophys Acta. 2012;1821:672–683. [DOI] [PubMed] [Google Scholar]
- 19. Mansouri K, Mostafie A, Rezazadeh D, Shahlaei M, Modarressi MH. New function of TSGA10 gene in angiogenesis and tumor metastasis: A response to a challengeable paradox. Hum Mol Genet. 2016;25:233–244. [DOI] [PubMed] [Google Scholar]
- 20. Niknazar S, Nahavandi A, Najafi R, Danialy S, Mehrjerdi FZ, Karimi M . Parents’ adulthood stress induces behavioral and hormonal alterations in male rat offspring. Behav Brain Res. 2013;252:136–143. [DOI] [PubMed] [Google Scholar]
- 21. Mehrabani M, Najafi M, Kamarul T, Mansouri K, Iranpour M, Nematollahi M, et al. Deferoxamine preconditioning to restore impaired HIF‐1α‐mediated angiogenic mechanisms in adipose‐derived stem cells from STZ‐induced type 1 diabetic rats. Cell Prolif. 2015;48:532–549. [DOI] [PMC free article] [PubMed] [Google Scholar]
- 22. Kumar MS, Sripriya R, Raghavan HV, Sehgal PK. Wound healing potential of Cassia fistula on infected albino rat model. J Surg Res. 2006;131:283–289. [DOI] [PubMed] [Google Scholar]
- 23. Zhu P, Liu J, Shi J, Zhou Q, Liu J, Zhang X, et al. Melatonin protects ADSCs from ROS and enhances their therapeutic potency in a rat model of myocardial infarction. J Cell Mol Med. 2015;19:2232–2243. [DOI] [PMC free article] [PubMed] [Google Scholar]
- 24. Kim B, Lee JH, Yang MS, Jou I, Joe EH. Retinoic acid enhances prostaglandin E2 production through increased expression of cyclooxygenase‐2 and microsomal prostaglandin E synthase‐1 in rat brain microglia. J Neurosci Res. 2008;86:1353–1360. [DOI] [PubMed] [Google Scholar]
- 25. Alique M, Moreno V, Kitamura M, Xu Q, Lucio‐Cazana F. Kinase‐dependent, retinoic acid receptor‐independent up‐regulation of cyclooxygenase‐2 by all‐trans retinoic acid in human mesangial cells. Br J Pharmacol. 2006;149:215–225. [DOI] [PMC free article] [PubMed] [Google Scholar]
- 26. Thacher SM, Vasudevan J, Chandraratna RA. Therapeutic applications for ligands of retinoid receptors. Curr Pharm Des. 2000;6:25–58. [DOI] [PubMed] [Google Scholar]
- 27. Hong HY, Varvayanis S, Yen A. Retinoic acid causes MEK‐dependent RAF phosphorylation through RARα plus RXR activation in HL‐60 cells. Differentiation. 2001;68:55–66. [DOI] [PubMed] [Google Scholar]
- 28. Xu Q, Konta T, Furusu A, Nakayama K, Lucio‐Cazana J, Fine LG, et al. Transcriptional Induction of Mitogen‐activated Protein Kinase Phosphatase 1 by Retinoids Selective roles of nuclear receptors and contribution to the antiapoptotic effect. J Biol Chem. 2002;277:41693–41700. [DOI] [PubMed] [Google Scholar]
- 29. Cañón E, Cosgaya JM, Scsucova S, Aranda A. Rapid effects of retinoic acid on CREB and ERK phosphorylation in neuronal cells. Mol Biol Cell. 2004;15:5583–5592. [DOI] [PMC free article] [PubMed] [Google Scholar]
- 30. Agarwal C, Chandraratna RA, Johnson AT, Rorke EA, Eckert RL. AGN193109 is a highly effective antagonist of retinoid action in human ectocervical epithelial cells. J Biol Chem. 1996;271:12209–12212. [DOI] [PubMed] [Google Scholar]
- 31. Alique M, Lucio‐Cazaña FJ, Moreno V, Xu Q, Konta T, Nakayama K, et al. Upregulation of cyclooxygenases by retinoic acid in rat mesangial cells. Pharmacology. 2006;79:57–64. [DOI] [PubMed] [Google Scholar]
- 32. Han J, Zhang L, Chen X, Yang B, Guo N, Fan Y. Effects of all‐trans retinoic acid on signal pathway of cyclooxygenase‐2 and Smad3&7 in transforming growth factor‐β‐stimulated glomerular mesangial cells. Exp Biol Med. 2014;239:272–283. doi: 10.1177/1535370213519216. [DOI] [PubMed] [Google Scholar]
- 33. Semenza GL. HIF‐1: Mediator of physiological and pathophysiological responses to hypoxia. J Appl Physiol. 2000;88:1474–1480. [DOI] [PubMed] [Google Scholar]
- 34. Fernández‐Martínez AB, Jiménez MIA, Hernández IS, García‐Bermejo ML, Manzano VM, Fraile EA, et al. Mutual regulation of hypoxic and retinoic acid related signalling in tubular proximal cells. Int J Biochem Cell Biol. 2011;43:1198–1207. [DOI] [PubMed] [Google Scholar]
- 35. Wan X, Li X, Bo H, Zhao Y, Liu L, Chen W, eds, et al., All‐trans retinoic acid protects renal tubular epithelial cells against hypoxia induced injury in vitro. Transplant Proc. 2013;45:497–502. [DOI] [PubMed] [Google Scholar]
- 36. Chun YS, Kim MS, Park JW. Oxygen‐dependent and ‐independent regulation of HIF‐1alpha. J Korean Med Sci. 2002. Oct;17:581–588. [DOI] [PMC free article] [PubMed] [Google Scholar]
- 37. Wang YQ, Luk JM, Ikeda K, Man K, Chu AC, Kaneda K, et al. Regulatory role of vHL/HIF‐1α in hypoxia‐induced VEGF production in hepatic stellate cells. Biochem Biophys Res Commun. 2004;317:358–362. [DOI] [PubMed] [Google Scholar]
- 38. Jones MK, Szabó IL, Kawanaka H, Husain SS, Tarnawski AS. von Hippel Lindau tumor suppressor and HIF‐1α: New targets of NSAIDs inhibition of hypoxia‐induced angiogenesis. FASEB J. 2002;16:264–266. [DOI] [PubMed] [Google Scholar]
- 39. Honczarenko M, Le Y, Swierkowski M, Ghiran I, Glodek AM, Silberstein LE. Human bone marrow stromal cells express a distinct set of biologically functional chemokine receptors. Stem Cells. 2006;24:1030–1041. [DOI] [PubMed] [Google Scholar]
- 40. Wu Y, Zhao RC. The role of chemokines in mesenchymal stem cell homing to myocardium. Stem Cell Rev. 2012;8:243–250. [DOI] [PubMed] [Google Scholar]
- 41. Obermajer N, Muthuswamy R, Odunsi K, Edwards RP, Kalinski P. PGE2‐induced CXCL12 production and CXCR4 expression controls the accumulation of human MDSCs in ovarian cancer environment. Cancer Res. 2011;71:7463–7470. [DOI] [PMC free article] [PubMed] [Google Scholar]
- 42. Jimi S, Matsumoto T, Suzumiya J, Hara S, Takamatsu Y, Tamura K. All‐trans retinoic acid accelerates migration of MOLT3 to SDF‐1 α/CXCL12 through the phosphatidylinositol 3 kinase (PI3K)/Akt pathway. Blood. 2006;108:4221. [Google Scholar]
- 43. Futagami S, Hamamoto T, Shimpuku M, Nagoya H, Kawagoe T, Horie A, et al. Celecoxib inhibits CD133‐positive cell migration via reduction of CCR2 in Helicobacter pylori‐infected Mongolian gerbils. Digestion. 2010;81:193–203. [DOI] [PubMed] [Google Scholar]
- 44. Najafi R, Sharifi AM. Deferoxamine preconditioning potentiates mesenchymal stem cell homing in vitro and in streptozotocin‐diabetic rats. Expert Opin Biol Ther. 2013;13:959–972. [DOI] [PubMed] [Google Scholar]
- 45. Schioppa T, Uranchimeg B, Saccani A, Biswas SK, Doni A, Rapisarda A, et al. Regulation of the chemokine receptor CXCR4 by hypoxia. J Exp Med. 2003;198:1391–1402. [DOI] [PMC free article] [PubMed] [Google Scholar]
- 46. Pourjafar M, Saidijam M, Malih S, Ranjbar T, Shabab N, Najafi R. Cytoprotective effects of endothelin‐1 on mesenchymal stem cells: An in vitro study. Clin Exp Pharmacol Physiol. 2016;43:769–776. [DOI] [PubMed] [Google Scholar]
- 47. Lansink M, Koolwijk P, van Hinsbergh V, Kooistra T. Effect of steroid hormones and retinoids on the formation of capillary‐like tubular structures of human microvascular endothelial cells in fibrin matrices is related to urokinase expression. Blood. 1998;92:927–938. [PubMed] [Google Scholar]
- 48. Gaetano C, Catalano A, Illi B, Felici A, Minucci S, Palumbo R, et al. Retinoids induce fibroblast growth factor‐2 production in endothelial cells via retinoic acid receptor α activation and stimulate angiogenesis in vitro and in vivo. Circ Res. 2001;88:e38–e47. [DOI] [PubMed] [Google Scholar]
- 49. Chen J‐T, Liang J‐B, Chou C‐L, Shyu R‐C, Lu D‐W. Retinoic acid induces VEGF gene expression in human retinal pigment epithelial cells (ARPE‐19). J Ocul Pharmacol Ther. 2005;21:413–419. [DOI] [PubMed] [Google Scholar]
- 50. Saito A, Sugawara A, Uruno A, Kudo M, Kagechika H, Sato Y, et al. All‐trans retinoic acid induces in vitro angiogenesis via retinoic acid receptor: Possible involvement of paracrine effects of endogenous vascular endothelial growth factor signaling. Endocrinology. 2007;148:1412–1423. [DOI] [PubMed] [Google Scholar]
- 51. Kini AR, Peterson LC, Tallman MS, Lingen MW. Angiogenesis in acute promyelocytic leukemia: Induction by vascular endothelial growth factor and inhibition by all‐trans retinoic acid. Blood. 2001;97:3919–3924. [DOI] [PubMed] [Google Scholar]
- 52. Yamakawa M, Liu LX, Date T, Belanger AJ, Vincent KA, Akita GY, et al. Hypoxia‐inducible factor‐1 mediates activation of cultured vascular endothelial cells by inducing multiple angiogenic factors. Circ Res. 2003;93:664–673. [DOI] [PubMed] [Google Scholar]
- 53. Wu G, Luo J, Rana JS, Laham R, Sellke FW, Li J. Involvement of COX‐2 in VEGF‐induced angiogenesis via P38 and JNK pathways in vascular endothelial cells. Cardiovasc Res. 2006;69:512–519. [DOI] [PubMed] [Google Scholar]
- 54. Yamakawa M, Liu LX, Belanger AJ, Date T, Kuriyama T, Goldberg MA, et al. Expression of angiopoietins in renal epithelial and clear cell carcinoma cells: Regulation by hypoxia and participation in angiogenesis. Am J Physiol Renal Physiol. 2004;287:F649–F657. [DOI] [PubMed] [Google Scholar]
- 55. Nie C, Yang D, Morris SF. Local delivery of adipose‐derived stem cells via acellular dermal matrix as a scaffold: A new promising strategy to accelerate wound healing. Med Hypotheses. 2009;72:679–682. [DOI] [PubMed] [Google Scholar]
- 56. Kitano Y, Yoshimura K, Uchida G, Sato K, Harii K. Pretreatment with topical all‐trans‐retinoic acid is beneficial for wound healing in genetically diabetic mice. Arch Dermatol Res. 2001;293:515–521. [DOI] [PubMed] [Google Scholar]
- 57. Tonnesen MG, Feng X, Clark RA, eds. Angiogenesis in wound healing. J Invest Dermatol Symp Proc: Nat Publishing Group. 2000;129:2275–2287. [DOI] [PubMed] [Google Scholar]
- 58. Brem H, Kodra A, Golinko MS, Entero H, Stojadinovic O, Wang VM, et al. Mechanism of sustained release of vascular endothelial growth factor in accelerating experimental diabetic healing. J Invest Dermatol. 2009;129:2275–2287. [DOI] [PubMed] [Google Scholar]


