Abstract
Objectives
Breast cancer stem cells (CSCs) are a small population of tumour cells with the ability of self‐renewal and resistance to chemotherapy. Targeting CSCs is a promising strategy for treatment of cancer. A recent study demonstrated that adenosine receptor agonists inhibit glioblastoma CSCs proliferation. At present, the effect of adenosine on breast CSCs has not been reported. Therefore, this study was designed to evaluate the effect of adenosine and its signalling pathways in breast CSCs.
Materials and methods
Anti‐proliferative effect of adenosine on breast CSCs was evaluated by mammosphere formation and MTS assay. The effect of adenosine on cell cycle progression was examined using flow cytometry. Detection of apoptosis was conducted by Annexin V‐FITC. The expression levels of cell cycle and apoptosis regulatory proteins as well as ERK1/2, and GLI‐1 were measured by Western blot.
Results
Adenosine reduced CSCs population and mammosphere formation in breast CSCs. Adenosine induced G1 cell cycle arrest in breast CSCs in conjunction with a marked down‐regulation of cyclin D1 and CDK4. Adenosine also induced apoptosis by regulation of Bax/Bcl‐2 ratio, mitochondrial membrane potential depletion and activation of caspase‐6. Moreover, adenosine inhibited ERK1/2 phosphorylation and GLI‐1 protein expression.
Conclusions
These findings indicated that adenosine induces cell cycle arrest and apoptosis through inhibition of GLI‐1 and ERK1/2 pathways in breast CSCs.
1. Introduction
Cancer stem cells (CSCs) are a minority population of tumour cells that possess the capacity to self‐renew and to initiate tumour growth.1, 2 There are increasing data supporting the existence of CSCs in breast cancer cells. Cancer stem cells are considered responsible for cancer initiation, progression, metastasis, recurrence and therapeutic resistance.3, 4 Targeting CSCs has been thought as a promising strategy for lasting treatment of cancer.5
Breast CSCs were identified via the specific marker CD44+/CD24− in breast cancer cells. Another marker is used for identification of breast CSCs is their ability to grow under anchorage‐independent spheres.6, 7
A recent study showed that adenosine triphosphate (ATP) reduces glioblastoma CSCs via purinergic receptors.8 Purinergic receptors are classified into two major families: the P1 and P2 receptors. ATP and adenosine are principal ligands for purinergic receptors.9, 10
Adenosine implicated in several aspects of cancer biology, such as cell growth inhibition, and apoptosis induction in various cancer cell type.11, 12 The effects of adenosine are mediated through stimulation of adenosine receptors (ARs) which are divided into four subtypes: A1, A2A, A2B and A3.13
Recent studies have shown the potential role of ARs in the regulation of hedgehog (Hh) and ERK1/2 signalling pathways.14, 15 The Hh signalling pathway contains several key components, including patched1 (PTCH1), smoothened (SMO) and glioma‐associated oncogene homologue (GLI). SMO and GLI‐1 are downstream effectors of the Hh signalling pathway which both are considered as crucial targets for cancer therapy.16
Several studies have highlighted the critical role of Hh and ERK1/2 signalling in the regulation of self‐renewal of CSCs.17, 18 Emerging studies have shown the contribution of ARs in proliferation and differentiation of stem cells.9 It has been shown that ATP inhibits tumour sphere formation and reduces CSCs in glioblastoma cells,8 but currently, there is very little known about the role of ARs in the biological processes of CSCs. Recently, Daniele and coworkers indicated that ARs are expressed in CSCs, and also they found that treatment of glioblastoma CSCs with AR agonists results in a significant reduction in cell viability. Therefore, they suggested that the ARs could be a novel pharmacological target for the development of new anti‐glioblastoma CSC therapies.19
At present, the effect of adenosine on breast CSCs has not been reported. Therefore, in this study, we investigated the effect of adenosine and its signalling pathways in breast CSCs isolated from MCF‐7 and MDA‐MB‐231 breast cancer cell line.
2. Materials and methods
2.1. Chemicals
Dulbecco's modified Eagle's medium (DMEM) medium, foetal bovine serum (FBS), penicillin and streptomycin and trypsin/EDTA solution were provided from Gibco (Life Technologies GmbH, Karlsruhe, Germany). Epidermal growth factor (EGF), basic fibroblast growth factor (bFGF) and B‐27 supplement were from Invitrogen Co. (Grand Island, NY, USA). The MTS Cell Proliferation kits were from Promega (Madison, WI, USA). Anti‐CD44 antibody (FITC) and anti‐CD24 antibody (PE) were purchased from Abcam (Cambridge, MA, USA). Nucleoside transporter inhibitor S‐(4‐nitrobenzyl)‐6‐thioinosine (NBTI) was obtained from Sigma‐Aldrich (St. Louis, MO, USA). Mouse monoclonal antibody against OCT‐4, Bax, Bcl‐2, CDK4, cyclin D1, SMO, GLI‐1 ERK1/2, GAPDH and goat anti‐mouse secondary antibodies were obtained from Santa Cruz Biotechnology, Inc. (Santa Cruz, CA, USA).
2.2. Cell culture
Breast cancer cell lines MCF‐7 and MDA‐MB‐231 were obtained from Iranian Biological Resource Center (IBRC). These cells were maintained in DMEM media supplemented with 10% FBS, 100 U/mL penicillin, and 100 mg/mL streptomycin and cultured at 37°C in 5% CO2 humidified atmosphere.
2.3. Mammosphere‐forming culture and isolation of breast CSC
For mammosphere culture, MDA‐MB‐231 and MCF‐7 cells were plated at 1 × 10⁵ cells/mL in sphere medium containing DMEM‐F12, 1% (v/v) B‐27 supplement, 10 ng/mL bFGF, and 20 ng/mL EGF. Cells were subsequently seeded into ultra‐low attachment six‐well plates. Cells grown in these conditions and mammospheres appeared after 7 days. For mammosphere passage, primary mammospheres were gathered by gentle centrifugation and trypsinized to generate a single cell suspension. Then, the cells were replated to generate secondary and tertiary mammospheres. Breast CSCs for the assays isolated from dissociation tertiary mammospheres and plated for every assay.
2.4. Soft agar colony formation assay
For assessment colony forming, six‐well plates coated with agar 0.8% and allowed to solidify at room temperature. Then, a suspension containing 1000 cells/well in a mixture of 0.4% agar in DMEM/F12 medium was added on top of the base layer. Following 14‐day incubation, the plates were fixed with methanol for 15 minutes and stained with crystal violet 0.5% for 20 minutes. Subsequently, the plates were washed with PBS, and images were acquired by an inverted microscope.
2.5. Flow cytometric analysis of cell surface markers
Tertiary mammospheres from MCF‐7 and MDA‐MB‐231 cells were trypsinized to prepare a single cell and washed with PBS. Then, a suspension containing 5 × 10⁴ cells were incubated with anti‐CD44 antibody conjugated to FITC and anti‐CD24 antibody conjugated to PE at 4°C in dark for 30 minutes. Following incubation, the cells were washed with PBS to remove excess antibody and then analysed on a FACS Calibur (BD Biosciences, Franklin Lakes, NJ, USA). Gates are based on the isotype control corresponding to each mammosphere cells.
2.6. Inhibitory effect of adenosine on mammosphere formation
Cancer cells (5 × 10⁴ cells/well) were cultured in sphere media in a six‐well plate in the presence of adenosine (1‐100 μmol/L) and NBTI or absence of adenosine. Mammospheres formation was evaluated after 7 days. Images were visualized using Olympus Inverted Microscope (Olympus, Tokyo, Japan). The sizes of mammosphere were measured using Image J software (National Institutes of Health, Bethesda, MD, USA).
2.7. MTS viability assay
Cell viability was evaluated by MTS assay according to the manufacturer's instructions (Promega, Tokyo, Japan). In brief, 3000 cells/well from disaggregated secondary‐mammospheres were seeded in 96‐well plates for 7 days to allow reform spheres. Cells then were treated with NBTI and various concentrations of adenosine (0.1‐100 μmol/L) for 48 hours in the absence or presence of MRS1220, an inhibitor of A3 adenosine receptors; DMPX, an inhibitor of A2a adenosine receptors; or DPCPX, an inhibitor of A1 adenosine receptors and also PSB 603, an inhibitor of A2B adenosine receptors. Then, 20 μL of MTS reagent was added to each well. Following 2 hours of incubation in 37°C, absorbance was measured at 490 nm in a Microplate Reader (Synergy H1 Hybrid Multi‐Mode BioTek, Winooski, VT, USA).
2.8. Analysis of cell cycle by measuring cellular DNA content
Analysis of cell cycle was conducted by flow cytometry according to Nicoletti method as previously described.20, 21 Briefly, breast CSCs (5 × 10⁴ cell/well) were treated with various concentrations of adenosine in the presence of NBTI for 48 hours. After treatments, cells were collected and washed with cold PBS. The cells were then fixed with 2 mL of ice‐cold 70% ethanol and allowed to incubate at 4°C for 30 minutes. The cells were washed, and re‐suspended in PBS solution, containing 20 mg/mL of propidium iodide (PI), 0.1% Triton X‐100 and 100 mg/mL of RNAse. After incubation for 30 minutes in the dark on ice, cells were analysed for DNA content using a FACS Calibur flow cytometer (BD Bioscience). Quantification of cell cycle distribution was performed using Flow Jo software version 7.6.1 (Tristar, El Segundo, CA, USA).
2.9. Detection of apoptosis using Annexin V/PI staining
Detection of apoptosis was conducted by Annexin V‐FITC/PI apoptosis detection kit according to the manufacturer's protocol as previously described.22 Briefly, 5 × 10⁴ cell/well from disaggregated tertiary mammospheres were seeded in six‐well plates and treated with various concentrations of adenosine (1‐100 μmol/L) in the presence of NBTI. After 48 hours of incubation, cells were collected and centrifuged. Then, the cells were washed with PBS and re‐suspended in the binding buffer. The cells were then incubated with Annexin V‐ FITC and PI and maintained in the dark place. Flow cytometric analysis was examined immediately using FACS Calibur flow cytometer (BD Bioscience).
2.10. Measurement of caspase‐6 activity
Breast CSCs (5 × 10⁵ cell/well) were cultured overnight in 24‐well plates and treated with various concentrations of adenosine (0.1, 1, 10 and 100 μmol/L) in the presence of NBTI for 48 hours. Moreover, the cells were treated with adenosine 10 μmol/L for 0, 6, 12, 24, 48 and 60 hours. Caspase‐6 activity was evaluated according to the manufacturer's instructions (R&D Systems, Minneapolis, MN, USA). Briefly, the cells were harvested and lysed in lysis buffer on ice for 10 minutes. Then, the cells were centrifuged at 10 000 g for 1 minute. After centrifugation, the supernatants were incubated with caspase‐6 substrate (VEID‐AFC) in reaction buffer. Samples were incubated in a 96‐well flat bottom microplate at 37°C for 1 hour and absorbance was measured at 490 nm with a Microplate Reader (Synergy H1 Hybrid Multi‐Mode ‐Bio‐Tek).
2.11. Mitochondrial membrane potential (ΔΨm) analysis
The mitochondrial membrane potential (ΔΨm) was investigated using the JC‐1 probe as previously described.23 JC‐1 accumulates in the mitochondrial matrix at a high ΔΨm and gives red fluorescence; when ΔΨm is relatively low, it may lead to a loss of JC‐1 aggregates and an increase in green fluorescent. The ratio between green and red fluorescence provides an estimate of ΔΨm. Breast CSCs (1 × 10³ cell/well) were seeded in 96‐well plates and treated with adenosine (1, 10 and 100 μmol/L) for 48 hours. The cells were then incubated with the JC‐1 by replacing the culture medium with HEPES buffer (40 mmol/L, pH 7.4) containing 4.5 g/L glucose (high glucose medium), 0.65% NaCl and 2.5 mol/L JC‐1 for 30 minutes at 37°C. Fluorescence was measured at two excitation/emission wavelength pairs, 490/540 and 540/590 nm with a Microplate Reader (Synergy H1 Hybrid Multi‐Mode ‐Bio‐Tek). Changes in the ratio between the measured red (590 nm) and green (540 nm) fluorescence intensities show changes in mitochondrial membrane potential.
2.12. Western blot analysis
Breast CSCs (5 × 10⁵ cell/well) were treated with various concentrations of adenosine (1‐100 μmol/L) in the presence of NBTI for 48 hours. For OCT‐4 protein assay, cells were not treated with adenosine. Western blot analysis was done according to methods published previously.21 In brief, the cells were lysed with RIPA buffer supplemented with complete protease inhibitors cocktail (Sigma‐Aldrich) and disrupted by sonication and then were centrifuged (10 000 g, 10 minutes, 4°C). The protein concentration of each lysate was quantified with the Bradford protein assay kit (Bio‐Rad, Hercules, CA, USA). Equal amounts of the proteins were subjected to SDS‐PAGE and transferred to PVDF membranes. Membranes were blocked with 5% skim milk for 2 hours at room temperature and incubated with mouse monoclonal antibody against OCT‐4, Bcl‐2, Bax, cyclin D1, CDK4, ERK1/2, GLI‐1, SMO and GAPDH (Santa Cruz, Biotechnology) overnight at 4°C, and then were washed three times with PBS containing 0.1% Tween‐20 (PBST). Membranes were incubated using an appropriate horseradish peroxidase‐conjugated secondary antibody for 1 hour at room temperature. After washing with PBST, the proteins of interest were detected using ECL detection reagent (Bio‐Rad). Densitometric analyses of bands were measured using ImageJ software (National Institutes of Health, Bethesda, MD, USA).
2.13. Statistical analysis
The results are presented as mean ± SD, and statistical analysis was analysed by the non‐parametric test of variance between groups (ANOVA) followed by Dunnett's post hoc test. All experiments were repeated at least three times independently. Statistical analyses were conducted using the software package spss version 18 (Statistical Package ver. 18.0; SPSS Inc., Chicago, IL, USA). A difference was regarded statistically significant at P<.05.
3. Results
3.1. Mammosphere formation of breast cancer cell lines
The breast cancer cells were seeded at sphere medium and allowed for the formation of spheres. The cells were grown in these conditions and spheres were formed, called mammosphere (Figure 1A). We observed more mammospheres grow to a size larger than 50 μm diameter after 7 days. Passaging was performed after 7 days, and the single cell was able to re‐form mammospheres.
Figure 1.
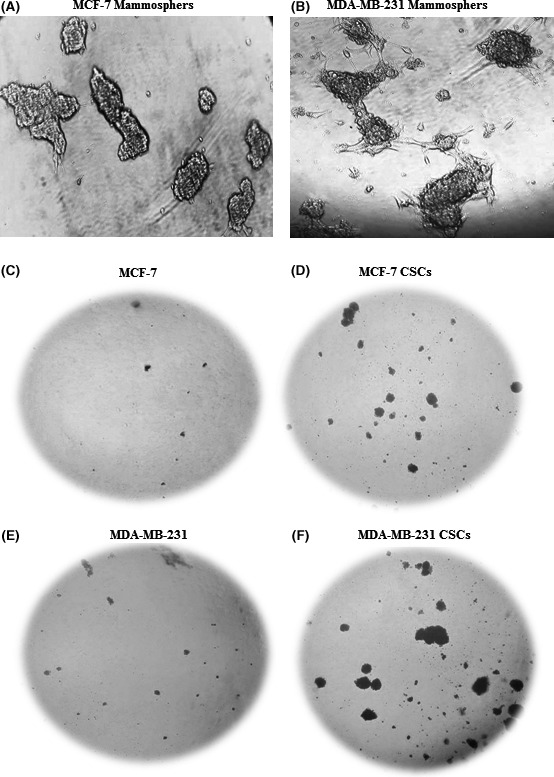
Mammosphere formation and clonogenic self‐renewal of breast cancer stem cells (CSCs). Breast cancer cells cultured in serum‐free medium and mammosphere appeared after 7 days. Mammospheres obtained from MCF‐7 (A) and MDA‐MB‐231 (B). The clonogenic self‐renewal ability of breast CSCs in soft agar. Colonies formed by cells obtained from MCF‐7 (C). Colonies formed by cells obtained from MCF‐7 CSCs (D). Colonies formed by cells obtained from MDA‐MB‐231 (E). Colonies formed by cells obtained from MDA‐MB‐231 CSCs (F)
3.2. Clonogenic self‐renewal ability of breast CSCs
The clonogenic self‐renewal ability of breast CSCs was assessed by the soft agar colony formation. We assessed the capacity of breast CSCs and breast cancer cells to form colonies in soft agar. As shown in Figure 1B, the number of colonies derived from breast CSCs were higher than the colonies obtained from breast cancer cells. This result showed that the clonogenic self‐renewal capacity of breast CSCs was higher compared with breast cancer cells.
3.3. The expression level of OCT4 in breast cancer cell line and breast CSCs
Octamer‐binding transcription factor 4 (OCT4) is a transcription factor that has an important role for the maintenance of self‐renewal capacity of embryonic stem cells and is used as biomarkers to identify CSCs.24, 25 In this study, we evaluated the expression level of OCT4 in breast CSCs compared with breast cancer cell line. As shown in Figure 2A, the expression level of OCT4 in breast CSCs was higher from breast cancer cells. These data indicated that breast CSCs possess stem cell characteristics.
Figure 2.
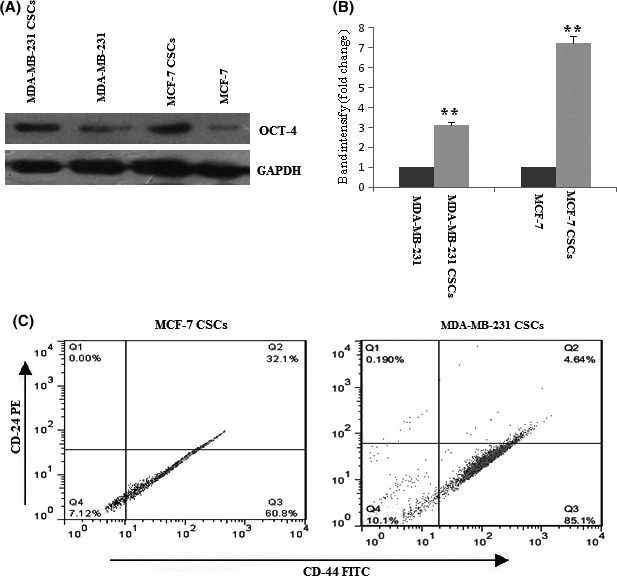
The expression level of OCT‐4 in breast cancer stem cells (CSCs) and breast cancer cell line and CD44+/CD24− expression profile in breast CSCs. The protein expressions of OCT‐4 proteins were determined by Western blot in breast CSCs and breast cancer cell line (A). Quantification analysis of OCT‐4 protein expression (B). Expression of CD24 and CD44 in tertiary mammospheres obtained from breast cancer cell line by flow cytometry (C) . The results shown represent the mean ± SD of three independent experiments. **P<.01 compared with the control group.
3.4. CD44+/CD24− expression profile in CSCs isolated from breast cancer cell lines
Breast CSCs were identified based on the expression of surface marker CD44 and non‐expression of CD24. Flow cytometry analysis showed the presence of 60.8% CSCs population in tertiary mammospheres derived from MCF‐7 cancer cells and 85.1% in tertiary mammospheres derived from MDA‐MB‐231 cancer cells (Figure 2B). This result showed that mammospheres are enriched for breast CSCs.
3.5. Adenosine reduces mammosphere formation
To know whether adenosine inhibits mammosphere formation, MDA‐MB‐231 and MCF‐7 cells were plated at sphere medium with and without adenosine. After incubation for 7 days, the number of mammospheres decreased in both MCF‐7 and MDA‐MB‐231 mammospheres. Moreover, the size of mammosphere formed upon treatment with adenosine was smaller than those in the medium without adenosine (Figure 3A,B).
Figure 3.
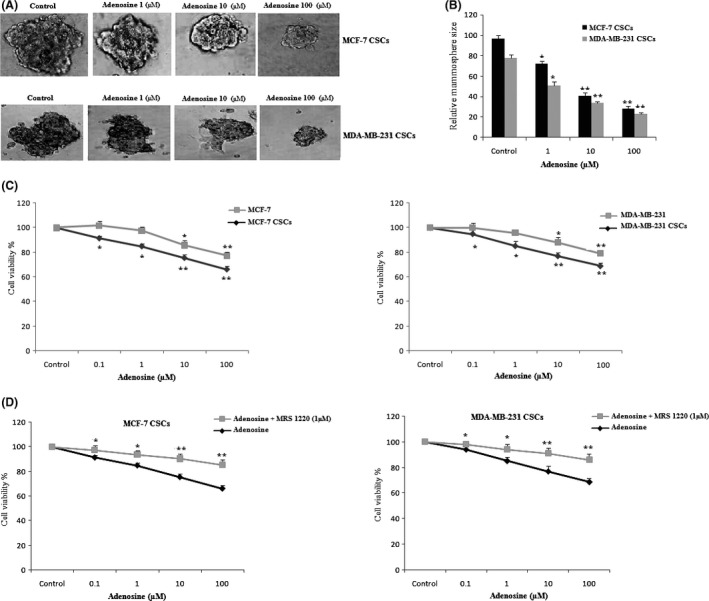
The effect of adenosine on the mammosphere‐forming ability and cell viability of breast cancer stem cells (CSCs). The size of mammosphere formed upon treatment with adenosine was smaller than those in the medium without adenosine (A). Quantitative analysis of mammosphere formation (B). Adenosine reduced cell viability in breast CSCs and breast cancer cell lines (C). The effect of A3ARs antagonist on the adenosine‐induced cytotoxicity in breast CSCs (D). The results shown represent the mean ± SD of three independent experiments. *P<.05; **P<.01 compared with the control group
3.6. Susceptibility of breast cancer cells and breast CSCs to adenosine
We investigated the anti‐proliferative effect of adenosine in breast cancer cell lines and breast CSCs by MTS assay. Cells were treated with various concentrations of adenosine for 48 hours.
As shown in Figure 3C, treatment of both cancer cell lines and breast CSCs with adenosine resulted in a dose‐dependent reduction in the cell viability compared to control. It is worth noting that the effect of adenosine on breast CSCs was higher from breast cancer cell line (P<.05). Moreover, consistent with previous study13, our results also indicated that addition of NBTI, nucleoside transport inhibitors, had no effect on the percentage of adenosine‐inhibited cell viability in the breast CSCs (data not shown).
For evaluation of the possible role of adenosine receptors in the cytotoxic effect of adenosine, we pre‐treated CSCs with the AR antagonists. Adenosine‐induced CSCs cytotoxicity was significantly inhibited by MRS1220, an inhibitor of A3 adenosine receptors (P<.05) (Figure 3D).
3.7. Adenosine induced cell cycle arrest by modulation of cell cycle checkpoint proteins
The effect of adenosine on cell cycle distribution was explored to elucidate insights into the mechanism of its anti‐proliferative activity. As shown in Figure 4A, in MCF‐7 CSCs, 50.42% untreated cells were in G1 phase, 14.52% in G2/M phase, 23.12% in S phase and 1.62 in sub‐G1 phase. In untreated MDA‐MB‐231 CSCs, 44.88% were in G1 phase, 14.34% in S phase, 32.66% in G2/M phase and 2.14 in sub‐G1. As shown in Figure 4B, adenosine induced the accumulation of breast CSCs in G1 and sub‐G1 phase in a dose‐dependent manner (P<.05). Concomitant with this increase in the percentage of cells in G1 and sub‐G1, a significant decrease in the percentage of cells in the S and G2/M phase was observed. To elucidate the mechanisms of adenosine involved in the regulation of G0/G1 cell cycle arrest, we next evaluated the effect of adenosine on the expression levels of CDK4 and cyclin D1 proteins. Treatment of MCF‐7 CSCs and MDA‐MB‐231 CSCs with adenosine for 48 hours resulted in dose‐dependent decreases in the expression levels of cyclin D1 and CDK4 proteins (Figure 4C,D). These results showed that adenosine induces G1 cell cycle arrest with down‐regulation of cyclin D1 and CDK4 in breast CSCs.
Figure 4.
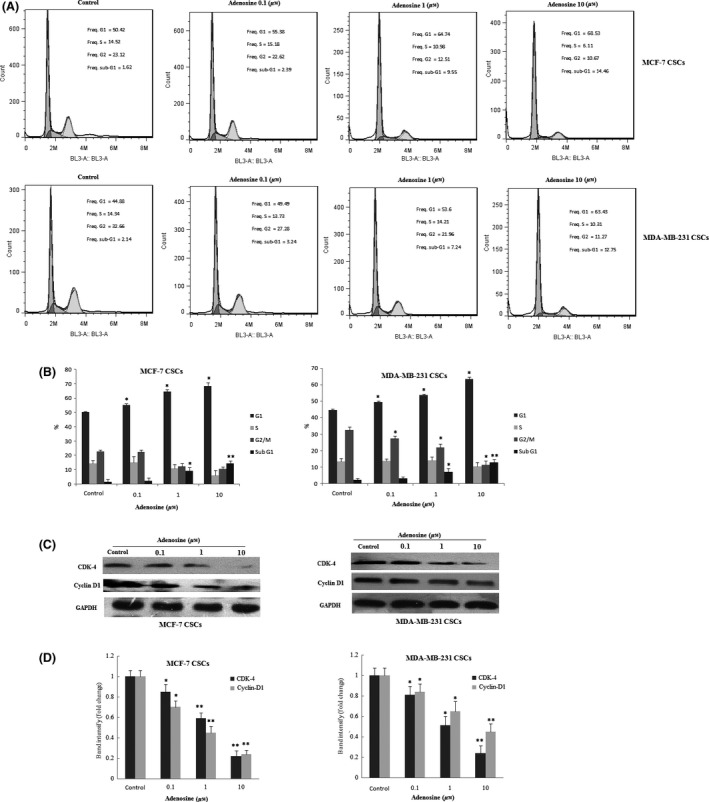
Cell cycle effects of adenosine on breast cancer stem cells (CSCs). Cell cycle analysis was performed by flow cytometry (A). Cell cycle distribution was shown in breast CSCs (B). The expression levels of CDK‐4 and cyclin D1 were determined by Western blot (C). Quantification analysis of CDK‐4 and cyclin D1 protein expression (D). The results shown represent the mean ± SD of three independent experiments. *P<.05; **P<.01 compared with the control group
3.8. Adenosine could induce apoptosis of MCF‐7 and MDA‐MB‐231 CSCs
To explore whether the adenosine‐induced cell growth inhibition was also due to apoptosis, we evaluated the effect of adenosine on cell apoptosis by flow cytometry analysis (Figure 5A). Apoptosis ranged from 5.48 ± 2.6 to 32.4 ± 1.7% in MCF‐7 CSCs and ranged from 7.089 ± 2.5 to 24.5 ± 1.8% in MDA‐MB 231 CSCs. In order to confirm that adenosine induces apoptosis in breast CSCs, we evaluated the effect of adenosine on pro‐ apoptotic protein (Bax) and anti‐apoptotic protein (Bcl‐2) by Western blot. Our data indicated that adenosine dose‐dependently increases Bax and decreases Bcl‐2 protein expression (Figure 5C). To evaluate that adenosine‐triggered apoptosis relate to the activation of caspases, we examined the catalytic activities of caspase‐6 in adenosine‐treated cells using the colorimetric assay kits. The treatment of breast CSCs with adenosine resulted in a significant increase in the activity of caspase‐6 compared to the control in a concentration‐ (Figure 6A) and time‐ (Figure 6B) dependent manner. These data show that caspase‐6 is involved in the adenosine‐induced apoptosis. Disorder of mitochondrial integrity is one of the early events in the induction of apoptosis.22 To explore the effect of adenosine on the function of mitochondria, potential changes in the mitochondrial membrane were evaluated by the JC‐1 probe. As shown in Figure 6C, adenosine reduces the ratio between red and green fluorescence and decreases the level of ΔΨm in a dose‐dependent manner.
Figure 5.
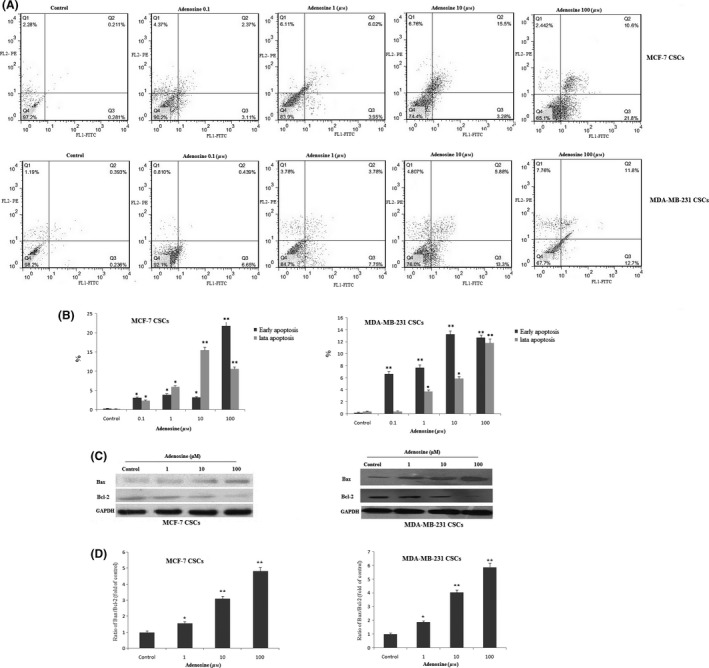
Detection of apoptosis in breast cancer stem cells (CSCs). Flow cytometric analysis of breast CSCs after treatment with adenosine (A). After treatment with adenosine apoptosis gradually increased in breast CSCs (B). The expression levels of Bax and BCL‐2 proteins were determined by Western blot (C). Quantification analysis of Bax/Bcl‐2 protein expression ratio (D). The results shown represent the mean ± SD of three independent experiments. *P<.05; **P<.01 compared with the control group
Figure 6.
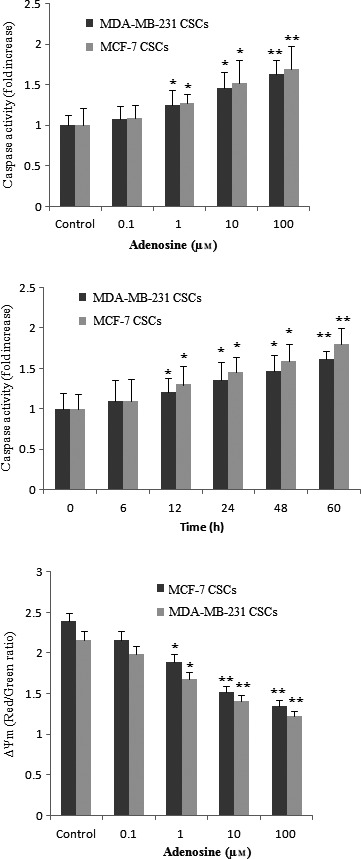
The effects of adenosine on caspase‐6 activity and mitochondrial transmembrane potential (ΔΨm). In breast cancer stem cells (CSCs), the activity of caspase‐6 increased in a concentration (A) and time (B) dependent manner after treatment with adenosine. The effect of various concentrations of adenosine on ΔΨm using JC‐1 prob (C). The results shown represent the mean ± SD of three independent experiments. *P<.05; **P<.01 compared with the control group
3.9. ERK1/2 and Hh signalling pathways are involved in adenosine‐induced apoptosis in MCF‐7 and MDA‐MB‐231 CSCs
It has been recently reported that ERK1/2 and Hh are two important signalling pathways in the survival of CSCs.17, 18 To determine the specific mechanism of inhibitory effect and apoptosis induction of adenosine in breast CSCs, we evaluated the effect of adenosine on ERK1/2 and downstream effectors of Hh (SMO and GLI‐1) signalling pathway. The Western blot analysis indicated that adenosine inhibited ERK1/2 phosphorylation in a dose‐dependent manner in breast CSCs (Figure 7A,B). Our data also showed that adenosine down‐regulates the expression levels of GLI‐1 and SMO in a dose‐dependent manner in breast CSCs (Figure 7A,B).
Figure 7.
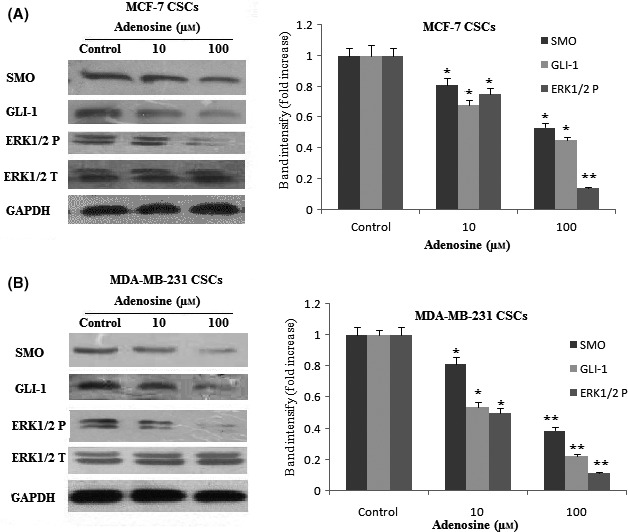
The expression levels and of SMO, GLI‐1 and ERK1/2 protein after treatment with adenosine. The expression levels and quantification analysis of SMO, GLI1 and ERK1/2 proteins were determined by Western blot and imageJ software, respectively, in MCF‐7 CSCs (A) and MDA‐MB‐231 CSCs (B). The results shown represent the mean ± SD of three independent experiments. *P<.05; **P<.01 compared with the control group
4. Discussion
Cancer stem cells are responsible for chemoresistance and metastasis of breast cancer.26 Signalling pathways have a pivotal role in the maintenance and formation of CSCs.27 A recent study reported that purinergic system for ATP had a crucial role in the survival of CSCs.8 At present, no study on the functions of adenosine in breast CSCs is available. In this study, we investigated the effect of adenosine in breast CSCs.
In the first phase of this study, we showed that adenosine reduces mammosphere formation and induces anti‐proliferative effect in breast CSCs and breast cancer cells in a dose‐dependent manner, consistent with the data, showing the inhibitory effect of adenosine on breast cancer cells.28, 29 In contrast, a recent study reported that adenosine induces proliferation in triple negative breast cancer cells.30 Moreover, the effect of adenosine on breast CSCs was significantly higher from breast cancer cell line. These data showed the specific targeting of breast CSCs by adenosine.
It has been demonstrated that the effects of adenosine are through either receptor‐dependent (ARs) or ‐independent mechanisms.15 We found that addition of NBTI had no effect on the percentage of adenosine‐inhibited cell viability in the breast CSCs. This finding showed the possibility for the implication of ARs in adenosine‐induced CSCs cytotoxity.
We also investigated the involvement of adenosine receptors in the cytotoxic effect of adenosine. Adenosine‐induced CSCs cytotoxicity was significantly inhibited by MRS1220, an inhibitor of A3 adenosine receptors. Therefore, implication of A3 adenosine receptors in adenosine‐induced cell cytotoxicity was suggested.
To understand the basis of the inhibitory effect of adenosine against breast CSCs, we examined the effects of adenosine on cell cycle distribution and apoptosis. Our data indicated that adenosine induces sub‐G1 accumulation and G1 arrest in breast CSCs. These results revealed that adenosine induces cell cycle arrest in breast CSCs. Regulation of cell cycle G1/S phase transition is driven by complexes formed by CDK4 and cyclin D1.31, 32 Our data showed that adenosine induces cell cycle arrest via down‐regulation of CDK4 and cyclin D1. These data are consistent with published study, indicating that inhibition of CDK4 and cyclin D1 by adenosine resulted in induction of cell cycle arrest.13, 33 Several studies showed that activation of A3ARs induces cell cycle arrest via inhibition of cyclin D1 and CDK‐4.20, 34
Lamb et al.35 showed that cyclin D1 and CDK4 have a pivotal role in the regulation of mammosphere formation. Therefore, these data suggested the inhibitory effect of adenosine on mammosphere formation may be mediated by down‐regulation of cyclin D1 and CDK4 proteins.
Evasion of apoptosis is one of the most important mechanisms of resistance to chemotherapy in breast CSCs.36 Our data also indicated that adenosine induces apoptosis in breast CSCs. Therefore, the anti‐proliferative effect of adenosine was further examined by the expression of apoptotic regulatory proteins. Among apoptotic regulatory proteins, the Bcl‐2‐family proteins have a prominent role in apoptosis. The Bcl‐2 family proteins are comprised by both pro‐apoptotic (Bid, Bax and Bad) and anti‐apoptotic (Bcl‐2, Bcl‐XL and Mcl‐1) members.37 Our results showed that adenosine induces apoptosis by an increase in the ratio of Bax/Bcl‐2 proteins, consistent with previously study.13, 33 Several study have reported that activation of A3ARs induces apoptosis by down‐regulation of Bcl‐2 protein family.11, 38 Another study demonstrated that stimulation of A2BAR induces apoptosis via Bax/Bcl‐2 pathways.22 A recent study reported that activation A1AR and A2BAR induces apoptosis in CSCs by up‐regulation of Bax.19 Several studies have demonstrated that loss of mitochondrial membrane potential is associated with apoptosis.13, 20 Our results revealed that adenosine reduces mitochondrial membrane potential. This result collectively showed the role of mitochondrial pathways in the mechanism of adenosine‐mediated apoptosis in breast CSCs. Recently, many investigators have suggested the pivotal role of caspases in the process of apoptosis. Caspase‐6 is as a key executioner of caspase that has a crucial role in apoptosis.39 Our data also indicated an increase in caspase‐6 activity after treatment with adenosine. This finding suggests a role for caspase‐6 in the adenosine‐induced apoptosis in breast CSCs.
Finally, we investigated the signalling pathways likely implicated in the survival of CSCs by adenosine. It has been reported that ARs have a role in the regulation of ERK1/2 and Hh signalling pathways.14, 15 The inhibition of Hh and ERK1/2 signalling induces cell cycle arrest and apoptosis.17, 40 So, we investigated the hypothesis that adenosine induces growth inhibition and apoptosis via the ERK1/2 and Hh pathway in breast CSCs.
The Hh pathway has a critical role during the development of the embryo and the adult.41 In particular, in the mammary gland, Hh signalling pathway involved in stem cell self‐renewal and expression of stemness genes.18 Disorder in Hh signalling pathway in stem or progenitor cells can relate to the onset of a tumorigenic programme.42 The GLI‐1 transcription factors regulate the expression of a number of targets, such as cyclin D1 and Bcl‐2.43 Yang et al.44 indicated that inhibition of Hh‐Gli signalling reduces cell viability, spheroid formation and induces apoptosis in breast CSCs.
Our study showed that adenosine decreases the expression levels of Smo and GLI‐1 in breast CSCs in a dose‐dependent manner. This finding indicated that there was a correlation between adenosine and Hh signalling in breast CSCs. Wolff et al.14 showed that activation of ARs/PKA signalling inhibits Hh signalling. One of the signalling pathways of adenosine is mediated through GPCRs by the cAMP‐dependent pathway.15 A study showed that GPCRs coupled to cAMP regulate Hh signalling.45
Evidence of a correlation between HH‐GLI and ERK1/2 signalling pathways has been demonstrated in various tumour cells.39 ERK1/2 are major members of MAPK family that regulate a wide range of cellular activities and physiological processes.46 It has been shown that ERK1/2 pathway involved in tumorigenicity of CSCs.17 Our data showed that adenosine inhibits the phosphorylation of ERK1/2 in a dose‐dependent manner. A study indicated that anti‐apoptotic effect of adenosine is via mediating ERK1/2 pathway.47 Several studies have reported the activation of A3AR modulates cell proliferation by inhibition of ERK1/2 pathways.38, 48 Furthermore, it has been previously demonstrated that stimulation of A2BAR mediating the inhibition of ERK 1/2 phosphorylation.49 Recently, it was reported that both A1AR and A2BAR agonists inhibit ERK 1/2 phosphorylation in CSCs.19
In conclusion, this study for the first time showed that adenosine reduces CSCs population and inhibits the mammosphere formation in breast CSCs. Our data also showed that adenosine induces G1 cell cycle arrest in conjunction with a marked down‐regulation of cyclin D1 and CDK4, and concomitant apoptosis in a dose‐and time‐dependent manner through mitochondrial pathway activation of caspase‐6 in breast CSCs. These effects are likely mediated by inhibition of ERK1/2 and Hh signalling pathways.
Acknowledgements
This work was supported in side by Isfahan University of Medical Sciences (no. 9/907) and in side by golestan University of Medical Sciences (no. 35/246259).
Jafari SM, Joshaghani HR, Panjehpour M, Aghaei M, Zargar Balajam N. Apoptosis and cell cycle regulatory effects of adenosine by modulation of GLI‐1 and ERK1/2 pathways in CD44+ and CD24− breast cancer stem cells. Cell Prolif. 2017;50:e12345 10.1111/cpr.12345
References
- 1. Han L, Shi S, Gong T, et al. Cancer stem cells: therapeutic implications and perspectives in cancer therapy. Acta Pharm Sin B. 2013;3:65‐75. [Google Scholar]
- 2. O'Brien C, Kreso A, Jamieson C. Cancer stem cells and self‐renewal. Clin Cancer Res. 2010;16:3113‐3120. [DOI] [PubMed] [Google Scholar]
- 3. Cobaleda C, Cruz J, González‐Sarmiento R, et al. The emerging picture of human breast cancer as a stem cell‐based disease. Stem Cell Rev. 2008;4:67‐79. [DOI] [PubMed] [Google Scholar]
- 4. Kim YJ, Siegler EL, Siriwon N, Wang P. Therapeutic strategies for targeting cancer stem cells. J Cancer Metastasis Treat. 2016;8:234. [Google Scholar]
- 5. Hu Y, Fu L. Targeting cancer stem cells: a new therapy to cure cancer patients. Am J Cancer Res. 2012;2:340‐356. [PMC free article] [PubMed] [Google Scholar]
- 6. Guttilla IK, Phoenix KN, Hong X, et al. Prolonged mammosphere culture of MCF‐7 cells induces an EMT and repression of the estrogen receptor by microRNAs. Breast Cancer Res Treat. 2012;132:75‐85. [DOI] [PubMed] [Google Scholar]
- 7. Phillips TM, McBride WH, Pajonk F. The response of CD24−/low/CD44+ breast cancer–initiating cells to radiation. J Natl Cancer Inst. 2006;98:1777‐1785. [DOI] [PubMed] [Google Scholar]
- 8. Ledur PF, Villodre ES, Paulus R, et al. Extracellular ATP reduces tumor sphere growth and cancer stem cell population in glioblastoma cells. Purinergic Signal. 2012;8:39‐48. [DOI] [PMC free article] [PubMed] [Google Scholar]
- 9. Kaebisch C, Schipper D, Babczyk P, Tobiasch E. The role of purinergic receptors in stem cell differentiation. Comput Struct Biotechnol J. 2015;13:75‐84. [DOI] [PMC free article] [PubMed] [Google Scholar]
- 10. Di Virgilio F. Purines, purinergic receptors, and cancer. Cancer Res. 2012;72:5441‐5447. [DOI] [PubMed] [Google Scholar]
- 11. Abedi H, Aghaei M, Panjehpour M, Hajiahmadi S. Mitochondrial and caspase pathways are involved in the induction of apoptosis by IB‐MECA in ovarian cancer cell lines. Tumour Biol. 2014;35:11027‐11039. [DOI] [PubMed] [Google Scholar]
- 12. Borea PA, Gessi S, Merighi S, Varani K. Adenosine as a multi‐signalling guardian angel in human diseases: when, where and how does it exert its protective effects? Trends Pharmacol Sci. 2016;37:419‐434. [DOI] [PubMed] [Google Scholar]
- 13. Aghaei M, Karami‐Tehrani F, Panjehpour M, et al. Adenosine induces cell‐cycle arrest and apoptosis in androgen‐dependent and‐independent prostate cancer cell lines, LNcap‐FGC‐10, DU‐145, and PC3. Prostate. 2012;72:361‐375. [DOI] [PubMed] [Google Scholar]
- 14. Wolff F, Loipetzberger A, Gruber W, et al. Imiquimod directly inhibits Hedgehog signalling by stimulating adenosine receptor/protein kinase A‐mediated GLI phosphorylation. Oncogene. 2013;32:5574‐5581. [DOI] [PMC free article] [PubMed] [Google Scholar]
- 15. Antonioli L, Blandizzi C, Pacher P, Haskó G. Immunity, inflammation and cancer: a leading role for adenosine. Nat Rev Cancer. 2013;13:842‐857. [DOI] [PubMed] [Google Scholar]
- 16. Rimkus TK, Carpenter RL, Qasem S, Chan M, Lo HW. Targeting the sonic Hedgehog signaling pathway: review of smoothened and GLI inhibitors. Cancers. 2016;8:22. [DOI] [PMC free article] [PubMed] [Google Scholar]
- 17. Ciccarelli C, Vulcano F, Milazzo L, et al. Key role of MEK/ERK pathway in sustaining tumorigenicity and in vitro radioresistance of embryonal rhabdomyosarcoma stem‐like cell population. Mol Cancer. 2016;15:1. [DOI] [PMC free article] [PubMed] [Google Scholar]
- 18. Santini R, Vinci MC, Pandolfi S, et al. Hedgehog‐GLI signaling drives self‐renewal and tumorigenicity of human melanoma‐initiating cells. Stem Cells. 2012;30:1808‐1818. [DOI] [PubMed] [Google Scholar]
- 19. Daniele S, Zappelli E, Natali L, et al. Modulation of A1 and A2B adenosine receptor activity: a new strategy to sensitise glioblastoma stem cells to chemotherapy. Cell Death Dis. 2014;5:1539. [DOI] [PMC free article] [PubMed] [Google Scholar]
- 20. Nicoletti I, Migliorati G, Pagliacci MC, Grignani F, Riccardi C. A rapid and simple method for measuring thymocyte apoptosis by propidium iodide staining and flow cytometry. J Immunol Methods. 1991;139:271‐279. [DOI] [PubMed] [Google Scholar]
- 21. Aghaei M, Panjehpour M, Karami‐Tehrani F, Salami S. Molecular mechanisms of A3 adenosine receptor‐induced G1 cell cycle arrest and apoptosis in androgen‐dependent and independent prostate cancer cell lines: involvement of intrinsic pathway. J Cancer Res Clin Oncol. 2011;137:1511‐1523. [DOI] [PMC free article] [PubMed] [Google Scholar]
- 22. Hajiahmadi S, Panjehpour M, Aghaei M, Shabani M. Activation of A2b adenosine receptor regulates ovarian cancer cell growth: involvement of Bax/Bcl‐2 and caspase‐3. Biochem Cell Biol. 2015;93:321‐329. [DOI] [PubMed] [Google Scholar]
- 23. Hamzeloo‐Moghadam M, Aghaei M, Fallahian F, et al. Britannin, a sesquiterpene lactone, inhibits proliferation and induces apoptosis through the mitochondrial signaling pathway in human breast cancer cells. Tumor Biol. 2015;36:1191‐1198. [DOI] [PubMed] [Google Scholar]
- 24. Liu Y, Liu DL, Dong LL, et al. miR‐612 suppresses stem cell‐like property of hepatocellular carcinoma cells by modulating Sp1/Nanog signaling. Cell Death Dis. 2016;7:e2377. [DOI] [PMC free article] [PubMed] [Google Scholar]
- 25. Zhou H, Hu Y, Wang W, et al. Expression of Oct‐4 is significantly associated with the development and prognosis of colorectal cancer. Oncol Lett. 2015;10:691‐696. [DOI] [PMC free article] [PubMed] [Google Scholar]
- 26. He YC, Zhou FL, Shen Y, et al. Apoptotic death of cancer stem cells for cancer therapy. Int J Mol Sci. 2014;15:8335‐8351. [DOI] [PMC free article] [PubMed] [Google Scholar]
- 27. Takebe N, Miele L, Harris PJ, et al. Targeting Notch, Hedgehog, and Wnt pathways in cancer stem cells: clinical update. Nat Rev Clin Oncol. 2015;12:445‐464. [DOI] [PMC free article] [PubMed] [Google Scholar]
- 28. Hashemi M, Karami‐Tehrani F, Ghavami S, Maddika S, Los M. Adenosine and deoxyadenosine induces apoptosis in oestrogen receptor‐positive and ‐negative human breast cancer cells via the intrinsic pathway. Cell Prolif. 2005;38:269‐285. [DOI] [PMC free article] [PubMed] [Google Scholar]
- 29. Panjehpour M, Karami‐Tehrani F. Adenosine modulates cell growth in the human breast cancer cells via adenosine receptors. Oncol Res. 2007;16:575‐585. [DOI] [PubMed] [Google Scholar]
- 30. Fernandez‐Gallardo M, González‐Ramírez R, Sandoval A, Felix R, Monjaraz E. Adenosine stimulate proliferation and migration in triple negative breast cancer cells. PLoS ONE. 2016;11:e0167445. [DOI] [PMC free article] [PubMed] [Google Scholar]
- 31. Swanton C. Cell‐cycle targeted therapies. Lancet Oncol. 2004;5:27‐36. [DOI] [PubMed] [Google Scholar]
- 32. Dinarina A, Santamaria PG, Nebreda AR. Cell cycle regulation of the mammalian CDK activator RINGO/Speedy A. FEBS Lett. 2009;583:2772‐2778. [DOI] [PubMed] [Google Scholar]
- 33. Shirali S, Aghaei M, Shabani M, et al. Adenosine induces cell cycle arrest and apoptosis via cyclinD1/Cdk4 and Bcl‐2/Bax pathways in human ovarian cancer cell line OVCAR‐3. Tumor Biol. 2013;34:1085‐1095. [DOI] [PubMed] [Google Scholar]
- 34. Chung H, Jung JY, Cho SD, et al. The antitumor effect of LJ‐529, a novel agonist to A3 adenosine receptor, in both estrogen receptor–positive and estrogen receptor–negative human breast cancers. Mol Cancer Ther. 2006;5:685‐692. [DOI] [PubMed] [Google Scholar]
- 35. Lamb R, Lehn S, Rogerson L, et al. Cell cycle regulators cyclin D1 and CDK4/6 have estrogen receptor‐dependent divergent functions in breast cancer migration and stem cell‐like activity. Cell Cycle. 2013;12:2384‐2394. [DOI] [PMC free article] [PubMed] [Google Scholar]
- 36. Chang CH, Zhang M, Rajapakshe K, et al. Mammary stem cells and tumor‐initiating cells are more resistant to apoptosis and exhibit increased DNA repair activity in response to DNA damage. Stem Cell Reports. 2015;5:378‐391. [DOI] [PMC free article] [PubMed] [Google Scholar]
- 37. Yip KW, Reed JC. Bcl‐2 family proteins and cancer. Oncogene. 2008;27:6398‐6406. [DOI] [PubMed] [Google Scholar]
- 38. Merighi S, Benini A, Mirandola P, et al. A3 adenosine receptor activation inhibits cell proliferation via phosphatidylinositol 3‐kinase/Akt‐dependent inhibition of the extracellular signal‐regulated kinase 1/2 phosphorylation in A375 human melanoma cells. J Biol Chem. 2005;280:19516‐19526. [DOI] [PubMed] [Google Scholar]
- 39. Olsson M, Zhivotovsky B. Caspases and cancer. Cell Death Differ. 2011;18:1441‐1449. [DOI] [PMC free article] [PubMed] [Google Scholar]
- 40. Sun Y, Guo W, Ren T, et al. Gli1 inhibition suppressed cell growth and cell cycle progression and induced apoptosis as well as autophagy depending on ERK1/2 activity in human chondrosarcoma cells. Cell Death Dis. 2014;5:e979. [DOI] [PMC free article] [PubMed] [Google Scholar]
- 41. Saqui‐Salces M, Merchant JL. Hedgehog signaling and gastrointestinal cancer. Biochim Biophys Acta. 2010;1803:786‐795. [DOI] [PMC free article] [PubMed] [Google Scholar]
- 42. i Altaba AR, Sánchez P, Dahmane N. Gli and Hedgehog in cancer: tumours, embryos and stem cells. Nat Rev Cancer. 2002;2:361‐372. [DOI] [PubMed] [Google Scholar]
- 43. Rovida E, Stecca B. Mitogen‐activated protein kinases and Hedgehog‐GLI signaling in cancer: A crosstalk providing therapeutic opportunities? Semin Cancer Biol. 2015;35:154‐167. [DOI] [PubMed] [Google Scholar]
- 44. Yang N, Zhou TC, Lei X, et al. Inhibition of Sonic Hedgehog signaling pathway by thiazole antibiotic thiostrepton attenuates the CD44+/CD24‐stem‐like population and sphere‐forming capacity in triple‐negative breast cancer. Cell Physiol Biochem. 2016;38:1157‐1170. [DOI] [PubMed] [Google Scholar]
- 45. Waschek JA, Dicicco‐Bloom E, Nicot A, Lelievre V. Hedgehog signaling: new targets for GPCRs coupled to cAMP and protein kinase A. Ann N Y Acad Sci. 2006;1070:120‐128. [DOI] [PubMed] [Google Scholar]
- 46. Rattanasinchai C, Gallo KA. MLK3 signaling in cancer invasion. Cancers (Basel). 2016;8:51. [DOI] [PMC free article] [PubMed] [Google Scholar]
- 47. Germack R, Dickenson JM. Adenosine triggers preconditioning through MEK/ERK1/2 signalling pathway during hypoxia/reoxygenation in neonatal rat cardiomyocytes. J Mol Cell Cardiol. 2005;39:429‐442. [DOI] [PubMed] [Google Scholar]
- 48. Jajoo S, Mukherjea D, Watabe K, Ramkumar V. Adenosine A3 receptor suppresses prostate cancer metastasis by inhibiting NADPH oxidase activity. Neoplasia (New York, N.Y.). 2009;11:1132‐1145. [DOI] [PMC free article] [PubMed] [Google Scholar]
- 49. Bieber D, Lorenz K, Yadav R, Klotz KN. A2B adenosine receptors mediate an inhibition of ERK‐1/2 phosphorylation in the breast cancer cell line MDA‐MB‐231. Naunyn‐Schmiedebergs Arch Pharmacol. 2008;377:1‐98.18273661 [Google Scholar]


