

Abstract
Objectives
If screening to find effective drugs is possible, the inhibition of proliferation using existing drugs can be a practical strategy to control the drug resistance of cancer. Development of a system‐oriented strategy to find effective drugs was the main aim of this research.
Materials and methods
An algorithm (transcriptional regulated flux balance analysis [TRFBA]) integrating a generic human metabolic model with transcriptomic data was used to identify genes affecting the growth of drug‐resistant cancer cells. Drugs that inhibit activation of the target genes were found and their effect on the proliferation was experimentally evaluated.
Results
Experimental assessments demonstrated that TRFBA improves the prediction of cancer cell growth in comparison with previous algorithms. The algorithm was then used to propose the system‐oriented strategy to search drugs effective in limiting the growth rate of the cisplatin‐resistant A2780 epithelial ovarian cancer cell. Experimental evaluations resulted in the selection of azathioprine, terbinafine, hydralazine and sodium valproate that appropriately inhibit the proliferation of resistant cancer cells while minimally affecting normal cells. Furthermore, experimental data indicate that the selected drugs are synergistic and can be used in combination therapies.
Conclusions
The proposed strategy was successful to identify drugs effective on the viability of resistant cancer cells. This strategy can enhance the potency of treatments for drug‐resistant cancer cells and provides the possibility of using existing drugs.
1. INTRODUCTION
Acquired drug resistance is a major problem to achieving successful cancer treatment,1 and the development of drug resistance in cancer cells is accompanied by metabolic dysregulation and alteration2 that may be therapeutically targetable. In fact, an altered metabolism supports different behaviours of drug‐resistant cancer cells, and targeting cancer metabolism can be an approach to treating them. However, dysregulated metabolism in drug resistance has not been addressed in details and deserves further investigation.3 Metabolic changes caused by a resistant state can be specified using omic technologies, and genome‐scale metabolic network reconstructions (as a platform for interpreting omics data) can be used to study how changes affect the functional states of the network.4, 5 In fact, the global human metabolic networks and several algorithms for integration of omics data6, 7 have enabled systems biology approaches to study the metabolism of human diseases such as obesity, diabetes, inborn errors of metabolism and cancer. Specifically, metabolic models were used to reconstruct a generic metabolic model of cancerous cells,8 compare metabolism of drug‐resistant and ‐sensitive cancer cells,2 study metabolic differences between healthy and cancerous cells and within cancerous cells,9 and find therapeutic strategies.10, 11
Identifying new drugs is a difficult task which requires much time, research and development before any new compound can be commercialized.11 Thus, already available drugs may be applied for the treatment of drug resistance even though they are designed for other diseases. The use of existing drugs is very valuable because extensive information about both their therapeutic and side effects has already been discovered during the study for their approval. The therapeutic and side effects of a drug can be beneficial in treating cancer.12 Considering the time and cost required for drug development, it would be particularly exciting if a systematic method could be applied to reveal all of the applications of a drug especially for combating complex diseases such as cancer. The development of such a systematic method can be helpful, especially clinically in reducing the development of drug resistance and for use in personalized medicine. In this research, transcriptomic data and a generic human metabolic reconstruction were integrated to propose a systematic and system‐oriented method.
Over the years, various algorithms for integration of omics data and metabolic models have been presented that can be classified based on continuous or discrete restriction of reaction flux.13 Recently, an algorithm named TRFBA (transcriptional regulated flux balance analysis) has been presented that continuously restricts the rate of reaction(s) supported by a metabolic gene.14 This algorithm uses a constant parameter (C) to convert the expression levels to the upper bounds of the reactions. Implementation of TRFBA to estimate growth rates of Escherichia coli and Saccharomyces cerevisiae indicated a significant improvement in the quantitative prediction of growth in comparison with previously presented algorithms. Considering that the inhibition of cancer cell growth is the main aim of this research, TRFBA was selected to reconstruct cancer cell‐specific models. To evaluate the capability of TRFBA, a data set for NCI‐60 cancer cell lines was used and predictions of TRFBA were compared with two GIMME (Gene Inactivity Moderated by Metabolism and Expression)15 and PRIME (Personalized ReconstructIon of Metabolic models)16, 17 algorithms previously used in cancer studies. The parameter C was adjusted using the sensitivity analysis proposed in the original paper.
Cisplatin is known as one of the most widely used drugs for the treatment of ovarian cancers, but resistance to this drug occurs in many cases18 and relapse of disease with fully chemoresistant is observed for over 80% of treated patients.19 Hence, cisplatin‐resistant A2780 epithelial ovarian cancer as an important drug‐resistant cancer was selected for more investigation in this research. Growth of cisplatin‐resistant and ‐sensitive A2780 epithelial ovarian cancer cell lines was simulated using TRFBA to identify target genes. Given that C was set for the NCI‐60 data set, a housekeeping gene (HKG) with the highest level of expression stability was selected to calibrate the expression levels of ovarian cancer cells. The Drugbank database20 was screened to find inhibitors of the target genes. The ability of the identified drugs to prevent the growth of drug‐resistant cancer cells was experimentally evaluated.
2. MATERIALS AND METHODS
2.1. Model and computational methods
2.1.1. Genome‐scale model
The generic human metabolic network reconstruction Recon 2.0421 including 7440 reactions, 2140 genes and 5063 metabolites was used in this research. The model was integrated with gene expression data using TRFBA14 to construct cancer cell‐specific models. A set of metabolic models specific for the NCI‐60 cell lines was developed using gene expression data for each cancer cell line from Lee et al22 (GSE5846). Doubling times for the NCI‐60 cell lines were obtained from the website of the Developmental Therapeutics Program at NCI/NIH to determine the experimental growth rate. Mean expression of genes in five replicates for resistant and sensitive cells measured by Li et al23 (GSE15709) was used to reconstruct cisplatin‐resistant and ‐sensitive A2780 epithelial ovarian cancer models. If expression of a gene was measured more than once, the mean expression level was used. Calculations were made in MATLAB software using the COBRA Toolbox.24 The GLPK (GNU Linear Programming Kit) package was used to solve linear programming (LP) problems.
2.1.2. The linear form of TRFBA
Transcriptional regulated flux balance analysis adds new constraints to the classical flux balance analysis (FBA) method25 and integrates metabolic and transcriptional regulatory networks with expression data using a mixed integer linear programming (MILP) problem. The metabolic model should be represented in the without OR and irreversible form14 in this formulation. When expression levels of all genes for a cell line are known, the transcriptional regulatory network is not required and the MILP problem is converted to an LP problem.14 Linear form of TRFBA integrates a metabolic model with the expression data to construct a cell or condition specific model. Transcriptional regulated flux balance analysis in the linear form only adds a set of constraints to FBA using eqn (1).
| (1) |
where K j denotes the set of indices of reactions supported by metabolic gene j, v i is flux of reaction i, and E j is the expression level of jth gene. C is a constant parameter that converts the expression levels to the upper bounds of the reactions. The unit for C is mmol gDCW−1 hour−1 and this coefficient indicates the maximum rate supported by one unit of expression level of a gene. Inequality is used for eqn (1) because it is possible to have both post‐transcriptional and post‐translational regulation in a cell.
2.1.3. In silico simulation
The biomass reaction was used as an objective function to be maximized in all simulations. An RPMI (Roswell Park Memorial Institute)‐1640 medium was considered in all simulations.8 An upper bound of 1000 was considered for intercellular reactions, and lower bounds of −1000 and 0 were considered for intercellular reversible and irreversible reactions respectively.
Error rates for TRFBA predictions of growth for NCI‐60 cancer cell lines were compared with those of GIMME and PRIME. For each cell line, predicted and experimental growth rates were used to calculate the relative error.14 The GIMME implementation in the COBRA Toolbox was used. Gene expression cut‐off value was set to the 25th percentile of the given expression data,13 and the required fraction of the original objective value was set to 90% of the maximum growth rate as in the original publication. An implementation of PRIME was provided with the original publication.16 The algorithms were also implemented to predict the growth rate of cisplatin‐resistant and ‐sensitive A2780 epithelial ovarian cancer cells in a batch culture.
2.1.4. A system‐oriented strategy to find effective drugs
According to Figure 1, a two‐stage strategy was used to screen genes and drugs. The input data include a generic human metabolic model and calibrated expression data. Single gene deletion analysis using TRFBA was carried out to find the genes affecting the growth of cisplatin‐resistant and ‐sensitive cancer cells. In this analysis, the expression of each gene was set to zero, and then the growth rate was calculated using TRFBA. Genes that, upon removal, resulted in at least 1% growth reduction were determined to be target genes. Drugbank was checked for drugs that inhibit activation of the target genes. The drugs were prepared, and their capability to reduce the growth rate of cisplatin‐resistant cancer cell was experimentally examined using MTT assay.
Figure 1.
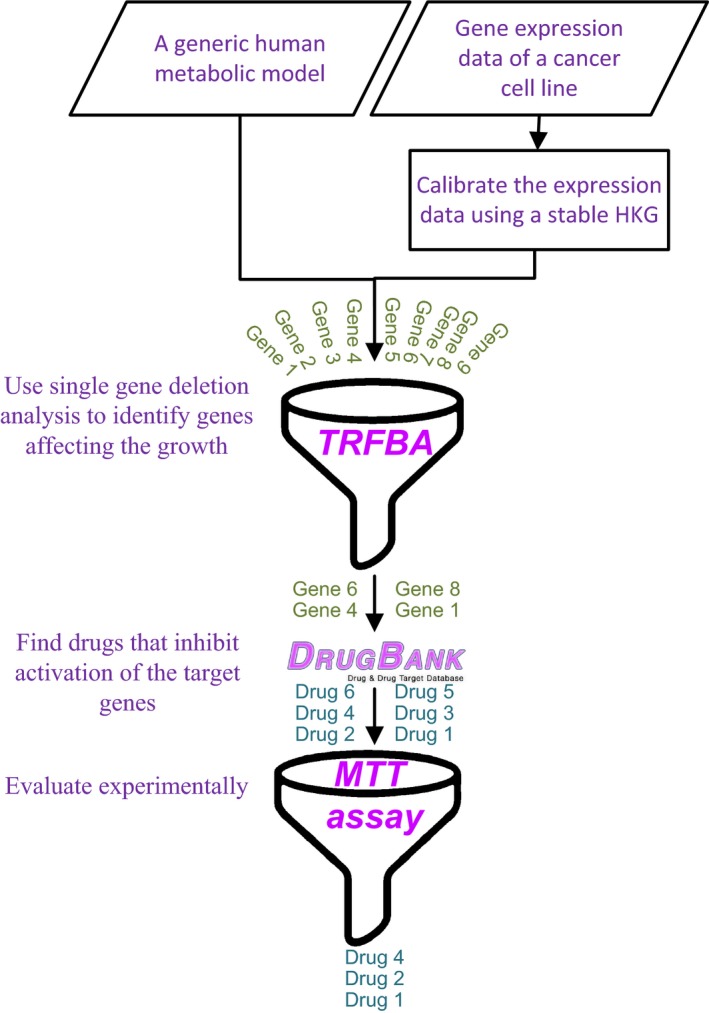
A two‐stage strategy to find drugs affecting the growth of cancer cells
2.2. Experimental materials and methods
2.2.1. Materials
RPMI‐1640 medium and fetal bovine serum (FBS) were purchased from Gibco. Trypsin/EDTA (Ethylenediaminetetraacetic acid) was purchased from Sigma‐Aldrich (St. Loius, MI, USA). Cisplatin‐sensitive (A2780) and ‐resistant (A2780‐cis) epithelial ovarian cancer cell lines were purchased from Pasteur Institute of Iran. Side effect of the drugs on proliferation rate of a sample normal cell (human dermal fibroblast [HDF]) was also evaluated to find more appropriate drugs. Human dermal fibroblast cell line was prepared from Royan institute. A2780, A2780‐cis and HDF cell lines were maintained in RPMI‐1640 supplemented with 10% FBS in a flask in an incubator kept at 37°C and 5% CO2.
2.2.2. Cell growth curves
Once the cell lines reached 80 to 90% of confluence, they were counted in a Neubauer chamber at 1:2 dilution with trypan blue dye exclusion. About 15 000 cells/well of each cell line were cultured on a 24‐well plate and number of cells was measured every day for 8 days. The growth rate for each cell line was determined by a non‐linear regression curves analysis.
2.2.3. Cell viability assay
The viability of cells (A2780, A2780‐cis and HDF cell lines) was determined in the presence of drugs by the MTT (Sigma‐Aldrich, USA) assay. Briefly, the number of 5000 cells/well were seeded into 96‐well plates and incubated at 37°C for 24 hours in a humidified atmosphere of 5% CO2. Then, the cells were incubated with freshly prepared drugs. They were incubated for 48 hours and then tested for viability. The viable cells with an active respiratory chain can reduce MTT and thereby form violet formazan crystals. After incubation with drugs, the medium was replaced with a 5:1 ratio of medium and MTT solution (5 mg mL−1 in PBS). Then, the supernatant was discharged and the insoluble formazan crystals were dissolved in dimethyl sulfoxide and absorbance was read at 545 nm. Cell viability was calculated as percent value relative to the blank group that was cultured in RPMI alone. Optimum concentration of each found drug resulted in maximum death of resistant cancer cells was determined to evaluate the maximum capability of each drug to control growth of resistant cancer cells. Furthermore, effect of the found drugs at these optimum concentrations on viability of sensitive cancer and HDF cells was determined for more investigation. It should be mentioned that the optimum concentration of cisplatin was determined for sensitive cells because effect of this drug on proliferation of resistant cells was not significant.
2.2.4. Combination therapy of drugs
The synergistic combination of drugs can reduce the frequency of acquired resistance. Furthermore, it can overcome toxicity and other adverse effects associated with high doses of a single drug.26 Thus, the synergistic effect of selected drugs was assessed. To evaluate the effect of drug combinations on proliferation, the concentration of each drug (except cisplatin) that resulted in a 20% death rate in cisplatin‐resistant cells was determined. For cisplatin, the concentration that resulted in a 20% death rate in cisplatin‐sensitive cells was determined. Then, each pair of drugs with the determined concentrations was used for treatment, and MTT assays were performed. If the death of the resistant cancer cell was more than 40%, the drug pair was identified as a synergistic pair proper for use in combination therapies. Furthermore, synergistic effect was quantified using the synergism quotient (SQ) defined as the ratio of the effect of the combined treatment divided by the sum of the two individual treatments.27, 28 A SQ greater than one indicates that there is a synergistic effect, while a SQ less than one indicates an antagonistic effect and SQ close to one indicates an additive effect.
3. RESULTS
3.1. Evaluation and validation
The capability of TRFBA to predict the growth rates of NCI‐60 cell lines was assessed and compared with GIMME and PRIME. For each cell line, the predicted and experimental growth rates were used to calculate error of the growth rate. Sensitivity of the error with respect to the C values was analysed to find the optimal value of C. Figure 2A depicts the average error and variations in the error of NCI‐60 cell lines. The variation is monotonic similar to the results for E. coli and S. cerevisiae data sets14 and the optimal value of C is 0.00014 mmol gDCW−1 hour−1. This optimal value was used to indicate the distribution of error in Figure 2B. This figure demonstrates that TRFBA and PRIME are much better approaches than GIMME for integrating expression data with Recon 2 to predict growth rates. TRFBA and PRIME continuously restrict reaction flux, while GIMME discretizes expression data into low‐ and high‐expressed data and deletes reactions based on expression level. It should also be mentioned that the distribution of error for TRFBA was more appropriate than that of PRIME, although growth rate measurements were used by PRIME to determine reactions significantly correlated to growth rate.
Figure 2.
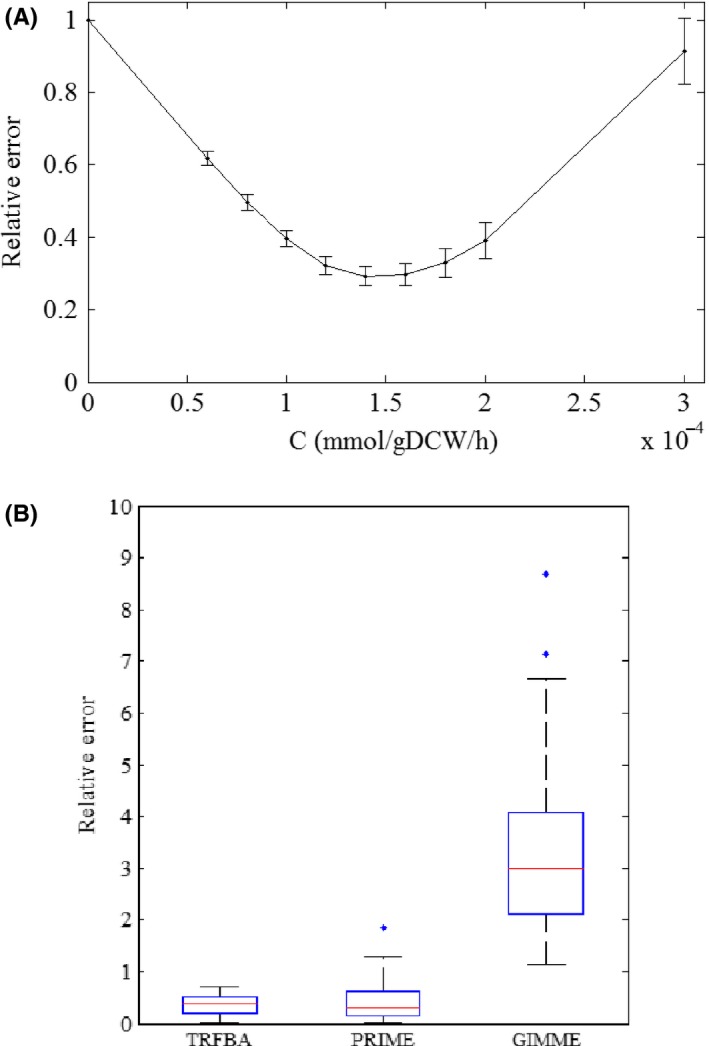
A) Sensitivity of the error with respect to the C values using NCI‐60 data set (Each average error and its variation represent the error distribution across all cell lines and the error bars represent the standard error of the mean) and B) Distribution of the relative error to predict growth rates of NCI‐60 cell lines (Each box plot represents the distribution of error for all NCI‐60 cell lines)
3.2. Growth prediction of the ovarian cancer cells
The experimental growth rates of ovarian cancer cells were determined based on the exponential curve fit of the cancer cell count against time (Figure S1). The results show that the growth rate of resistant cells is more than that of sensitive cells. The experimental data of Chan et al29 also demonstrated that the proliferation rate of cisplatin‐resistant A2780 cells is higher than that of sensitive cells. The capability of the three algorithms to predict the growth rates of two ovarian cancer cells was evaluated. Considering that the optimal value of C was determined using the expression data of NCI‐60 cell lines, calibration of the expression data for ovarian cancer cells was required. For this purpose, HKGs proposed for cancer cells in the literature were collected. These genes are internal standards that are involved in maintenance of basal cellular functions, and therefore, they are expected to be expressed in a constant level in all cells and conditions.30, 31 To select the most stable HKG, variations in expression level of HKGs were estimated by the standard deviation and the gene with the lowest variance over NCI‐60 cancer cell lines was selected to normalize the expression data of ovarian cancer cells. Table S1 demonstrates that SYMPK is the most stable gene. The average expression level of this gene for NCI‐60 cell lines was 91.31, while its expression for ovarian cancer cells was almost the same and equals to about 218.5. Hence, the expression levels of ovarian cancer cells were divided by 2.39 (218.5/91.31) to be calibrated. Considering the ovarian cancers as two samples, PRIME found no reaction correlated to growth rate and was therefore not applicable for predicting growth. In fact, PRIME required many more samples to reconstruct a cell‐specific model. Hence, the calibrated expression levels and experimental growth rates of ovarian cancer cells were added to the NCI‐60 data set and these 62 sets of information were used to determine growth‐associated reactions.
Table 1 demonstrates that PRIME and GIMME over‐predicted the growth rates of cancer cells and were unable to quantitatively estimate growth; however, predictions of PRIME were better than GIMME, and PRIME was able to predict more growth rate for resistant cells. The TRFBA prediction of growth for both resistant and sensitive cancer cells was comparable with the experimental data and this algorithm predicted the growth rates of resistant and sensitive cancer cells with relative error of 8 and 11%, respectively. In addition, TRFBA properly indicated that the growth rate of resistant cells is more than that of sensitive cells. These results indicate that TRFBA can properly control the uptake rates of other metabolites using expression data and can distinguish the differences between the expression data of two similar cancer cells. However, PRIME and GIMME do not have enough resolution power to appropriately recognize the effect of different expression data of ovarian cancer cells on growth.
Table 1.
Comparison of experimental and predicted growth rates for cisplatin‐resistant and ‐sensitive A2780 cells
| Cell line | Growth rate (h−1) | |||
|---|---|---|---|---|
| Experimental | TRFBA | PRIME | GIMME | |
| A2780‐cis | 0.024 | 0.026 | 0.051 | 0.084 |
| A2780 | 0.018 | 0.016 | 0.049 | 0.084 |
3.3. Finding effective drugs
The genes affecting the growth of ovarian cancer cells were identified using single gene deletion analysis by TRFBA. Inhibiting drugs effective on these genes were found from Drugbank and are presented in Table S2. It can be seen that some drugs were originally applied for the treatment of diseases other than cancer.
Among the found drugs, nine available drugs including aciclovir, azathioprine, terbinafine, capecitabine, hyralazine, nitisinone, orlistat, sodium valproate and vigabatrin in addition to cisplatin were used to treat ovarian cancer cell lines, and their effect on the cell viability of HDF was also analysed. Some initial experiments were carried out to determine effective concentration of the studied drugs (data not shown). The optimum concentration of each found drug that resulted in the maximum inhibition of resistant cancer cell growth was specified and presented in Table 2. The cisplatin concentration in Table 2 was determined for sensitive cancer cells because the effect of this drug on growth of A2780‐cis was not significant.
Table 2.
Optimum concentration required to inhibit cancer cell for each studied drug. The concentration of drugs (except cisplatin) was determined for resistant cancer cells. The concentration of cisplatin was determined for sensitive cancer cells
| Drug | Concentration (mmol L−1) |
|---|---|
| Aciclovir | 4 |
| Azathioprine | 2 |
| Terbinafine | 0.56 |
| Capecitabine | 4 |
| Hydralazine | 0.12 |
| Nitisinone | 1.2 |
| Orlistat | 0.02 |
| Sodium valproate | 0.016 |
| Vigabatrin | 8 |
| Cisplatin | 0.04 |
The results of MTT test on A2780, A2780‐cis and HDF cells using the optimum drug concentrations are shown in Figure 3 to evaluate the maximum capability of each drug to control growth of resistant cancer cells. Azathioprine, terbinafine, hydralazine and sodium valproate were found to be effective against the proliferation rates of resistant cells with cell viability of 47%, 54%, 44% and 72%. Furthermore, these drugs inhibit growth of sensitive cells and maximum death rate for HDF cells was 25%. Of these drugs, azathioprine is the only drug originally synthesized as a cancer drug. It hinders DNA synthesis by blocking the synthesis of purine, and thus inhibits the proliferation of cells.32 Terbinafine, hydralazine and sodium valproate were originally synthesized as anti‐fungal, anti‐hypertensive and epilepsy drugs, respectively, and they inhibit the activation of SQLE, AOC3 and SLC25A20 genes respectively.
Figure 3.
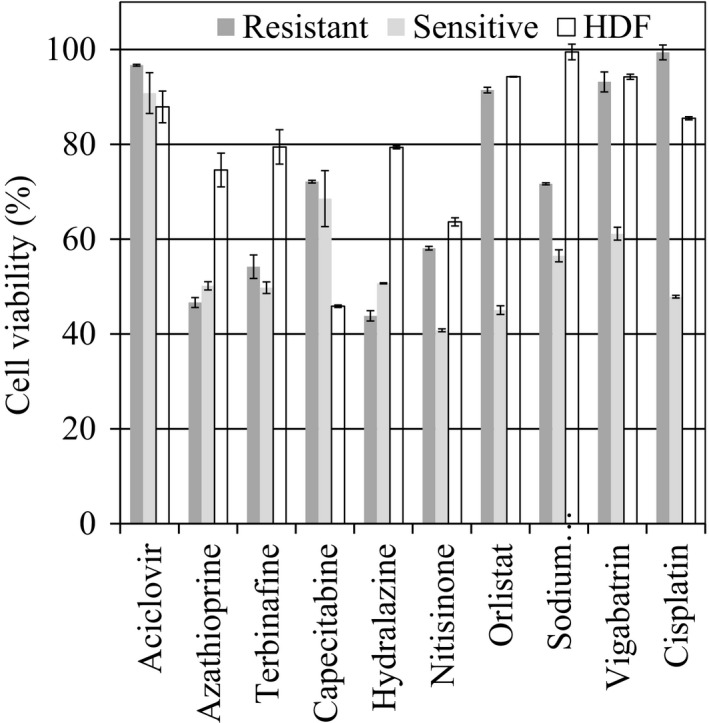
Viability of the sensitive, resistant and normal cells after 48 h of treatment using the optimum concentration of the drugs presented in Table 2
As expected, cisplatin reduced the viability of A2780 and HDF to 42% and 85.5%; its effect on A2780‐cis was negligible. Figure 3 demonstrates that TRFBA was able to find drugs that affect the viability of resistant cells at nearly the same rate as cisplatin affects sensitive cells, and their effect on the growth of HDF was comparable with that of cisplatin. Considering that TRFBA uses only a generic metabolic model and expression data, this is an important achievement for the treatment of drug resistance.
Capecitabine and nitisinone are also effective against the growth of ovarian cancer cells, but they strongly inhibit growth of HDF. Thus, they are not considered the first choice for chemotherapy. Similar to cisplatin, orilstat and vigabatrin only inhibit growth of sensitive cells. Aciclovir is the only predicted effective drug that has no significant effect on the growth of cancer cells.
3.4. Combination of the effective drugs
Four appropriate drugs (azathioprine, terbinafine, hydralazine and sodium valproate) as well as cisplatin were combined to examine their possible synergism to control the proliferation rate of resistant cancer cell. The concentrations of azathioprine, terbinafine, hydralazine and sodium valproate required to inhibit resistant cancer cell growth by 20% were 1, 0.09, 0.03 and 0.0015 mmol−1 respectively. These concentrations resulted in 25%, 22%, 24% and 21% death of sensitive cancer cell respectively. The concentration of 0.005 mmol−1 for cisplatin that resulted in 20% death of sensitive cancer cell was used. This concentration did not affect the growth of resistant cancer cell.
The results presented in Table 3 indicate that pairs of the five drugs have synergistic effect on the growth of resistant cells, while their impact on the viability of normal cells is not remarkable. The calculated SQs that are greater than one for A2780‐cis confirm the synergistic effect of the drugs. Furthermore, SQ of each combination for resistant cells is more than that for sensitive cells. All combinations of drugs are not synergistic on growth of the sensitive cells and three drug pairs including cisplatin and sodium valproate, azathioprine and hydralazine, and hydralazine and cisplatin indicate an additive effect.
Table 3.
Effect of binary combination of four appropriate drugs and cisplatin on the death and synergism quotient (SQ) for the three cell lines. Concentration of 1, 0.09, 0.03, 0.0015 and 0.005 mmol L−1 was used for azathioprine, terbinafine, hydralazine, sodium valproate and cisplatin respectively
| Drug 1 | Drug 2 | Cell death | SQ | |||
|---|---|---|---|---|---|---|
| A2780‐cis | A2780 | HDF | A2780‐cis | A2780 | ||
| Azathioprine | Terbinafine | 60 ± 1 | 69 ± 0.67 | 23 ± 0.64 | 1.5 | 1.5 |
| Hydralazine | Sodium valproate | 52 ± 0.5 | 68 ± 0.66 | 34 ± 0.6 | 1.3 | 1.5 |
| Azathioprine | Hydralazine | 52 ± 0.69 | 50 ± 0.77 | 22 ± 0.56 | 1.3 | 1 |
| Terbinafine | Hydralazine | 59 ± 0.57 | 62 ± 0.63 | 17 ± 0.67 | 1.475 | 1.35 |
| Terbinafine | Sodium valproate | 60 ± 0.5 | 65 ± 1 | 27 ± 2 | 1.5 | 1.5 |
| Azathioprine | Sodium valproate | 58 ± 0.94 | 64 ± 0.65 | 25 ± 0.3 | 1.45 | 1.39 |
| Cisplatin | Terbinafine | 48 ± 0.61 | 66 ± 0.67 | 22 ± 0.72 | 2.4 | 1.57 |
| Cisplatin | Azathioprine | 41 ± 0.69 | 65 ± 0.88 | 16 ± 0.58 | 2.05 | 1.44 |
| Cisplatin | Hydralazine | 33 ± 1 | 41 ± 0.51 | 14 ± 0.69 | 1.65 | 0.93 |
| Cisplatin | Sodium valproate | 34 ± 0.87 | 43 ± 0.35 | 9 ± 0.85 | 1.7 | 1.05 |
4. DISCUSSION
The integration of transcriptomic data into a generic metabolic model using TRFBA was employed to automatically reconstruct cancer cell‐specific models. Proposed method of data calibration using a stable HKG enabled the algorithm to use the optimal value of its parameters for all cell lines. The model was applied to find bottleneck genes for the growth of ovarian cancer cells that can be considered as drug targets. Screening for these targets indicated that inhibiting drugs were designed for some of these targets, even though they were originally synthesized for the treatment of diseases other than cancer. Experimental evaluations demonstrated that almost all of the predicted drugs inhibit cancer cell growth. The effect of four drugs on the viability of resistant cells is nearly the same as that of cisplatin on sensitive cells and their side effects on HDF growth is comparable with the cisplatin effect. They are also synergistic on growth of the resistant cells and can be applied in combination therapies to lower the doses of the drugs. More synergistic effect of drugs on resistant cells compared with sensitive cells was observed. This result demonstrates that the metabolism of sensitive cells is more robust and flexible and it is in accordance with the previous research of Motamedian et al.2 They compared metabolic models of cisplatin‐resistant and ‐sensitive A2780 cells using single and double gene deletion analyses and concluded that although using cisplatin does not result in the death of A2780‐cis cancer cells, but metabolism of these resistant cells is more vulnerable.
Among the studied drugs, only the effect of one drug on growth of ovarian cancer cells has been previously investigated. Empirical research of Yan and Zhang33 confirms the effect of sodium valproate on the growth of human ovarian cancer cell line HO8910. They concluded that sodium valproate has a potential role in inhibition and control of ovarian cancer cell line HO8910, and could be the basis of future ovarian cancer treatments. Furthermore, experimental reports presented by previous researchers confirm the inhibitory effect of non‐cancer drugs orlistate, sodium valproate and terbinafine on growth of other cancer cells. Kridel et al12 used an activity‐based proteomics strategy to simultaneously identify targets and screen for their inhibitors in prostate cancer. They found that orlistat has anti‐tumour activity. They proved that this drug halts proliferation of prostate cancer cells. Cinatl et al34 indicated that sodium valproate is able to abrogate human neuroblastoma cells growth in vivo and concluded that it may be useful in the treatment of neuroblastoma patients. Wang et al35 emphasized that none of treatment options for cholangiocarcinoma (CCA) including surgery, adjuvant radiotherapy, chemotherapy and ultimately liver transplantation has been shown to substantially improve the survival rate in patients with CCA. They treated CCA cells of different origins (TFK‐1, QBC939 and CCLP1) with sodium valproate and indicated that this drug inhibits the growth of human CCA in vitro and in vivo. Lee et al36 demonstrated for the first time that terbinafine can inhibit the proliferation of colon cancer cell line in vitro and in vivo. Chien et al37 indicated that terbinafine decreased cell number in cultured KB cell, a representative human oral squamous cell carcinoma (OSCC) cell line. There is not any report indicating the inhibitory effect of hydralazine and vigabatrin on growth of cancer cells. Hence, the strategy is able to find effective drugs that have not been previously used for cancer treatment. The drugs are Food and Drug Administration‐approved and their adverse effect has been evaluated; hence, they can be used for clinical treatment. This system‐oriented strategy can enhance the potency of treatments for drug‐resistant cancer cells and it can be applied effectively in personalized medicine if the gene expression data for a specific patient exists. It is of great importance in clinical treatments and provides the possibility of using existing drugs.
CONFLICT OF INTEREST
The authors declare that they have no conflict of interest.
Supporting information
Motamedian E, Taheri E, Bagheri F. Proliferation inhibition of cisplatin‐resistant ovarian cancer cells using drugs screened by integrating a metabolic model and transcriptomic data. Cell Prolif. 2017;50:e12370 10.1111/cpr.12370
Funding information
This research was supported by Iran National Science Foundation (INSF) under grant No. 93014510. The source code used in this research is freely available at http://sbme.modares.ac.ir.
REFERENCES
- 1. Harper M‐E, Antoniou A, Villalobos‐Menuey E, et al. Characterization of a novel metabolic strategy used by drug‐resistant tumor cells. FASEB Journal. 2002;16:1550‐1557. [DOI] [PubMed] [Google Scholar]
- 2. Motamedian E, Ghavami G, Sardari S. Investigation on metabolism of cisplatin resistant ovarian cancer using a genome scale metabolic model and microarray data. Iran J Basic Med Sci. 2015;18:267. [PMC free article] [PubMed] [Google Scholar]
- 3. Zhao Y, Butler EB, Tan M. Targeting cellular metabolism to improve cancer therapeutics. Cell Death Dis. 2013;4:e532. [DOI] [PMC free article] [PubMed] [Google Scholar]
- 4. Bordbar A, Palsson BO. Using the reconstructed genome‐scale human metabolic network to study physiology and pathology. J Intern Med. 2012;271:131‐141. [DOI] [PMC free article] [PubMed] [Google Scholar]
- 5. Kim HU, Sohn SB, Lee SY. Metabolic network modeling and simulation for drug targeting and discovery. Biotechnol J. 2012;7:330‐342. [DOI] [PubMed] [Google Scholar]
- 6. Zhang C, Hua Q. Applications of Genome‐Scale Metabolic Models in Biotechnology and Systems Medicine. Front Physiol. 2016;6: 413. [DOI] [PMC free article] [PubMed] [Google Scholar]
- 7. Fouladiha H, Marashi SA, Shokrgozar M. Reconstruction and validation of a constraint‐based metabolic network model for bone marrow‐derived mesenchymal stem cells. Cell Prolif. 2015;48:475‐485. [DOI] [PMC free article] [PubMed] [Google Scholar]
- 8. Folger O, Jerby L, Frezza C, Gottlieb E, Ruppin E, Shlomi T. Predicting selective drug targets in cancer through metabolic networks. Mol Syst Biol. 2011;7:501. [DOI] [PMC free article] [PubMed] [Google Scholar]
- 9. Agren R, Bordel S, Mardinoglu A, Pornputtapong N, Nookaew I, Nielsen J. Reconstruction of Genome‐Scale Active Metabolic Networks for 69 Human Cell Types and 16 Cancer Types Using INIT. PLoS Comput Biol. 2012;8:e1002518. [DOI] [PMC free article] [PubMed] [Google Scholar]
- 10. Agren R, Mardinoglu A, Asplund A, Kampf C, Uhlen M, Nielsen J. Identification of anticancer drugs for hepatocellular carcinoma through personalized genome‐scale metabolic modeling. Mol Syst Biol. 2014;10:721. [DOI] [PMC free article] [PubMed] [Google Scholar]
- 11. Facchetti G, Zampieri M, Altafini C. Predicting and characterizing selective multiple drug treatments for metabolic diseases and cancer. BMC Syst Biol. 2012;6:115. [DOI] [PMC free article] [PubMed] [Google Scholar]
- 12. Kridel SJ, Axelrod F, Rozenkrantz N, Smith JW. Orlistat is a novel inhibitor of fatty acid synthase with antitumor activity. Can Res. 2004;64:2070‐2075. [DOI] [PubMed] [Google Scholar]
- 13. Machado D, Herrgård M. Systematic evaluation of methods for integration of transcriptomic data into constraint‐based models of metabolism. PLoS Comput Biol. 2014;10:e1003580. [DOI] [PMC free article] [PubMed] [Google Scholar]
- 14. Motamedian E, Mohammadi M, Shojaosadati SA, Heydari M. TRFBA: an algorithm to integrate genome‐scale metabolic and transcriptional regulatory networks with incorporation of expression data. Bioinformatics. 2017;33:1057‐1063. [DOI] [PubMed] [Google Scholar]
- 15. Becker SA, Palsson BO. Context‐specific metabolic networks are consistent with experiments. PLoS Comput Biol. 2008;4:e1000082. [DOI] [PMC free article] [PubMed] [Google Scholar]
- 16. Yizhak K, Gaude E, Le Dévédec S, et al. Phenotype‐based cell‐specific metabolic modeling reveals metabolic liabilities of cancer. eLife. 2014;3:e03641. [DOI] [PMC free article] [PubMed] [Google Scholar]
- 17. Yizhak K, Le Dévédec SE, Rogkoti VM, et al. A computational study of the Warburg effect identifies metabolic targets inhibiting cancer migration. Mol Syst Biol. 2014;10:744. [DOI] [PMC free article] [PubMed] [Google Scholar]
- 18. Li M, Balch C, Montgomery J, et al. Integrated analysis of DNA methylation and gene expression reveals specific signaling pathways associated with platinum resistance in ovarian cancer. BMC Med Genomics. 2009;2:34. [DOI] [PMC free article] [PubMed] [Google Scholar]
- 19. Agarwal R, Kaye SB. Ovarian cancer: strategies for overcoming resistance to chemotherapy. Nat Rev Cancer. 2003;3:502‐516. [DOI] [PubMed] [Google Scholar]
- 20. Law V, Knox C, Djoumbou Y, et al. DrugBank 4.0: shedding new light on drug metabolism. Nucleic Acids Res. 2014;42:D1091‐D1097. [DOI] [PMC free article] [PubMed] [Google Scholar]
- 21. Thiele I, Swainston N, Fleming RM, et al. A community‐driven global reconstruction of human metabolism. Nat Biotechnol. 2013;31:419‐425. [DOI] [PMC free article] [PubMed] [Google Scholar]
- 22. Lee JK, Havaleshko DM, Cho H, et al. A strategy for predicting the chemosensitivity of human cancers and its application to drug discovery. Proc Natl Acad Sci. 2007;104:13086‐13091. [DOI] [PMC free article] [PubMed] [Google Scholar]
- 23. Li M, Balch C, Montgomery JS, et al. Integrated analysis of DNA methylation and gene expression reveals specific signaling pathways associated with platinum resistance in ovarian cancer. BMC Med Genomics. 2009;2:1. [DOI] [PMC free article] [PubMed] [Google Scholar]
- 24. Schellenberger J, Que R, Fleming RM, et al. Quantitative prediction of cellular metabolism with constraint‐based models: the COBRA Toolbox v2. 0. Nat Protoc. 2011;6:1290‐1307. [DOI] [PMC free article] [PubMed] [Google Scholar]
- 25. Orth JD, Thiele I, Palsson BØ. What is flux balance analysis? Nat Biotechnol. 2010;28:245‐248. [DOI] [PMC free article] [PubMed] [Google Scholar]
- 26. Fitzgerald JB, Schoeberl B, Nielsen UB, Sorger PK. Systems biology and combination therapy in the quest for clinical efficacy. Nat Chem Biol. 2006;2:458‐466. [DOI] [PubMed] [Google Scholar]
- 27. Neri P, Yasui H, Hideshima T, et al. In vivo and in vitro cytotoxicity of R‐etodolac with dexamethasone in glucocorticoid‐resistant multiple myeloma cells. Br J Haematol. 2006;134:37‐44. [DOI] [PubMed] [Google Scholar]
- 28. Tassone P, Neri P, Burger R, et al. Combination therapy with interleukin‐6 receptor superantagonist Sant7 and dexamethasone induces antitumor effects in a novel SCID‐hu In vivo model of human multiple myeloma. Clin Cancer Res. 2005;11:4251‐4258. [DOI] [PubMed] [Google Scholar]
- 29. Chan DW, Liu VW, Tsao GS, et al. Loss of MKP3 mediated by oxidative stress enhances tumorigenicity and chemoresistance of ovarian cancer cells. Carcinogenesis. 2008;29:1742‐1750. [DOI] [PubMed] [Google Scholar]
- 30. Eisenberg E, Levanon EY. Human housekeeping genes, revisited. Trends Genet. 2013;29:569‐574. [DOI] [PubMed] [Google Scholar]
- 31. Janssens N, Janicot M, Perera T, Bakker A. Housekeeping genes as internal standards in cancer research. Molecular Diagnosis. 2004;8:107‐113. [DOI] [PubMed] [Google Scholar]
- 32. Dave VK, Vickers C. Azathioprine in the treatment of muco‐cutaneous pemphigoid. Br J Dermatol. 1974;90:183‐186. [DOI] [PubMed] [Google Scholar]
- 33. Yan H‐C, Zhang J. Effects of sodium valproate on the growth of human ovarian cancer cell line HO8910. Asian Pac J Cancer Prev. 2012;13:6429‐6433. [DOI] [PubMed] [Google Scholar]
- 34. Cinatl J Jr, Cinatl J, Driever PH, et al. Sodium valproate inhibits in vivo growth of human neuroblastoma cells. Anticancer Drugs. 1997;8:958‐963. [DOI] [PubMed] [Google Scholar]
- 35. Wang B, Yang R, Wu Y, et al. Sodium valproate inhibits the growth of human cholangiocarcinoma in vitro and in vivo. Gastroenterol Res Pract. 2013;2013:374593. [DOI] [PMC free article] [PubMed] [Google Scholar]
- 36. Lee WS, Chen RJ, Wang YJ, et al. In vitro and in vivo studies of the anticancer action of terbinafine in human cancer cell lines: G0/G1 p53‐associated cell cycle arrest. Int J Cancer. 2003;106:125‐137. [DOI] [PubMed] [Google Scholar]
- 37. Chien MH, Lee TS, Kao C, Yang SF, Lee WS. Terbinafine inhibits oral squamous cell carcinoma growth through anti‐cancer cell proliferation and anti‐angiogenesis. Mol Carcinog. 2012;51:389‐399. [DOI] [PubMed] [Google Scholar]
Associated Data
This section collects any data citations, data availability statements, or supplementary materials included in this article.
Supplementary Materials