

Abstract
Objectives
Graphene oxide (GO), the derivative of graphene with unique properties, has attracted much attention for applications in dental implants. The aim of this study was, by two biomimetic cell culture methods, to investigate the quantitative relationship between the concentration of pristine GO nanosheets and their cellular behaviours towards bone marrow‐derived mesenchymal stem cells (BMSCs).
Materials and methods
The cells were firstly characterized according to their morphology, self‐renewal capabilities and multipotency. Subsequently, adhesion density, proliferation, alkaline phosphatase activity and mineralization of BMSCs treated with various concentrations of GO were analysed. In addition, osteogenic‐related proteins were measured for further verification of the GO‐induced osteogenic differentiation.
Results
Pristine GO nanosheets inhibited the proliferation of BMSCs at a high concentration of 10 μg/mL during the first 3 days with two seeding methods and facilitated proliferation of BMSCs at a low concentration of 0.1 μg/mL after 5 days with a sequential‐seeding method compared to a co‐seeding method. Analogously, osteogenic differentiation was promoted when BMSCs were treated with 0.1 μg/mL of GO. Both the proliferation and differentiation showed concentration‐dependent behaviour. Interestingly, Wnt/β‐catenin signalling pathway appeared to be involved in osteogenic differentiation induced by pristine GO nanosheets.
Conclusions
Pristine GO nanosheets at a concentration of 0.1 μg/mL provide benefits to promote BMSCs proliferation and osteogenesis under a sequential‐seeding method, contributing to the use of GO for dental implantation.
1. INTRODUCTION
Graphene is a two‐dimensional hexagonal network with a flat monolayer of carbon atom which is formed by strong triangular σ‐bonds of sp2 hybridized orbitals.1 Due to its unique structure and properties, graphene and its derivatives, graphene oxide (GO) and reduced graphene oxide, have recently attracted significant interest for potential biomedical applications such as tissue engineering,2, 3 drug delivery,4, 5 anti‐bacterial efficiency,6, 7 cancer targeting8, 9 and biological imaging.10, 11 In particular, abundant functional groups, such as hydroxyl, epoxy, carboxylic acid and other carbonyl groups, located at the edge and plane of GO, make it easier to be functionalized.12, 13 The potential of graphene for accelerating the differentiation of bone marrow‐derived mesenchymal stem cells (BMSCs) was first reported in bone tissue engineering.14 Subsequently, graphene and its derivatives have attracted much interest for applications in tissue‐engineered bone regeneration. Meanwhile, correlative research mentioned that both GO and graphene could enhance the osteogenesis of mesenchymal stem cells because of their ability to absorb some proteins and small molecules from an osteogenic‐induced medium (OIM). Interestingly, due to the strong electrostatic interaction produced by oxygen‐containing groups, GO could absorb more osteogenesis‐related factors containing dexamethasone and ascorbic acid than could graphene.15 Moreover, the addition of 3 wt% GO to a chitosan 3D scaffold greatly improved the composite mechanical properties for bone tissue engineering.16 Additionally, GO has been reported to enhance anti‐microbial activities against a bacterial model (Escherichia coli) for membrane and oxidative stress.17 These appealing properties of GO make it a promising material for surface modification or guide bone regeneration in dental implantology.
The use of implant‐supported dentures to recover the dental structure and function of stomatognathic system for the rehabilitation of completely and partially edentulous patients has become popular.18 It has been demonstrated that the short‐ and long‐term success of dental implants is highly correlated with osseointegration. According to numerous researchers, mesenchymal stem cells (MSCs) have emerged as one of the most promising therapeutic candidates to promote osseointegration in vitro and in vivo. The majority of studies on guiding the osteogenesis of MSCs were involved in the growth factor inducers including proteins, small molecules and mixed supplements, all of which often need weeks and even months of differentiation to mature osteoblasts.19, 20 Early osseointegration plays a crucial role in determining the therapeutic efficacy of dental implants as well as meeting the demands of patients and clinicians. Nevertheless, as one of the stem cell therapies, growth factor inducers alone cannot guide the osteogenesis of MSCs rapidly and efficiently. Therefore, it is essential to explore more efficient techniques. Attractively, GO has proven to be capable of inducing MSCs differentiation into osteoblasts.21, 22, 23 Before one can take advantage of their desirable properties for dental implants, it is important to verify how GO affects cellular behaviours, especially the direct behaviours of BMSCs. Although several studies have tested the effects of GO‐related materials on MSC behaviours, the results varied.24, 25, 26 In this study, we focused on the concentrations of pristine GO nanosheets directly applied to BMSCs and the consequent cellular behaviours.
Cellular behaviours are dependent on the interactions between materials and cells. Previous works have studied the cell‐to‐cell/‐materials interactions via sequential‐seeding and co‐seeding methods.27, 28, 29, 30 We were interested in applying similar techniques to explore the proliferation and osteogenic differentiation of BMSCs treated with pristine GO nanosheets. Sequential‐seeding involves culturing BMSCs for 6 hours until their adhesion to the plastic substrate, followed by exposure to GO nanosheets. Co‐seeding represents the simultaneous seeding of BMSCs with GO nanosheets. These two approaches imitate the analogous situations in vivo: the interaction between pristine GO nanosheets and established cells (sequential‐seeding)/ migrating cells (co‐seeding) within the extracellular matrix.
This study begins to explore the cellular behaviours of Sprague‐Dawley (SD) rat BMSCs towards pristine GO nanosheets by two biomimetic cell culture methods. As a first step, we prepared pristine GO nanosheets in a cell medium with/without chemical inducers and evaluated the adhesion density and proliferation of BMSCs with the aforementioned two methods. Then, alkaline phosphatase (ALP) activity and calcium deposits were examined for assessment of osteogenic differentiation. Lastly, osteogenic‐related proteins were investigated for further verification of the GO‐induced promotion of osteogenic differentiation. We hypothesized that 0.1 μg/mL of pristine GO nanosheets is the optimum concentration for promoting the proliferation and osteogenic differentiation of SD rat BMSCs. The optimum concentration of pristine GO nanosheets confirmed in this study provided valuable guidelines for the design of biomaterials for potential clinical translation.
2. MATERIALS AND METHODS
2.1. Preparation and characterization of the GO/culture medium
Pristine GO nanosheets (Nanjing XFNANO Materials Tech Co., Ltd, Nanjing, China) were dispersed in tri‐distilled water to prepare GO suspension with the concentrations of 0.02 and 0.1 mg/mL, and then dispersed ultrasonically for 4 hours. All specimens were sterilized by ultraviolet light for 30 minutes prior to being added to the culture medium. Suitable volumes of GO suspension were added to OIM (Cyagen Biosciences Inc., Guangzhou, China) and DMEM/F12 (Gibco, Thermo Fisher Scientific, Inc., Waltham, MA, USA) containing 10% fetal bovine serum (FBS; Gibco, Thermo Fisher Scientific, Inc.) and 1% penicillin/streptomycin (P/S; Gibco) to prepare specific concentrations of medium: 0.01, 0.1, 1 and 10 μg/mL. Culture medium without GO was included as the control group. Hereafter, DMEM/F12 with 10% FBS and 1% P/S was denoted as DMEM; OIM and DMEM containing GO were denoted as GO/OIM and GO/DMEM, respectively. The morphology of pristine GO nanosheets was confirmed by transmission electron microscopy (TEM; JEM 1400, Tokyo, Japan) at an accelerating voltage of 120 kV.
2.2. BMSCs isolation, culture and characterization
The whole bone marrow culture method was used to isolate BMSCs from the femur and tibia of two 2‐week‐old male SD rats.31, 32 All experimental procedures were approved by the Research Ethics Committee of Sun Yat‐sen University. Briefly, the rat was euthanized by cervical dislocation, after which the femur and tibia were isolated. The distal and proximal ends of the bones were dissected and the whole bone marrow was flushed out of the bone cavity and harvested using DMEM. The harvested cells were filtered through a 200‐grid strainer for the removal of cell aggregates and tissue debris. The filtered cells were cultured in a humidified 5% CO2 incubator at 37°C to 80%‐90% confluence. Subsequently, BMSCs were digested and passaged for the removal of unattached haematopoietic cells. Only the early passages (P3‐5) of BMSCs were used for the in vitro experiments with pristine GO nanosheets.
The characterization of BMSCs was performed according to the standards of the Mesenchymal and Tissue Stem Cell Committee of the International Society for Cellular Therapy.33 Morphology of BMSCs at P3 and P8 was observed by means of an inverted microscope (Zeiss, Oberkochen, Germany). BMSCs were seeded at 2×10⁵ cells/well in six‐well plates and cultured overnight. Afterwards, OIM and adipogenic‐induced medium (Cyagen Biosciences Inc., Guangzhou, China) was applied to induce osteogenic and adipogenic differentiation of BMSCs. Alizarin red and oil red O staining was used separately for evaluation of the formation of calcium deposits and lipid droplets.
2.3. Sequential‐seeding and co‐seeding methods
Two biomimetic methods were performed for study of the cellular behaviours of BMSCs treated with pristine GO nanosheets in vitro. For the sequential‐seeding method, BMSCs were seeded at 2×10⁵ cells/well in six‐well plates with DMEM for 6 hours until their adhesion to plastic substrate, after which the DMEM was replaced with 2 mL GO/DMEM at various concentrations, whilst, for the co‐seeding method, BMSCs were seeded concurrently with 2 mL GO/DMEM. Every 2‐3 days, a 1.5‐mL quantity of medium was replaced with the same volume of fresh DMEM, and the remaining 0.5 mL of medium was allowed to remain to keep GO nanosheets at the bottoms of the wells.
2.4. Adhesion density and cytoskeleton
The morphology and details of BMSCs treated with GO by two methods were observed by confocal laser scanning microscopy (Zeiss). In brief, BMSCs were seeded at 1×10⁴ cells/ laser‐scanning confocal Petri dish and then treated with GO/DMEM at different final concentrations (0, 0.01, 0.1, 1 and 10 μg/mL) by the aforementioned two methods. After different treatments for 3 days, cells were washed gently with phosphate‐buffered saline (PBS; Hyclone, Logan, UT, USA) for three times and fixed in 4% paraformaldehyde at room temperature for 30 minutes, then permeabilized with 0.1% Triton X‐100 (Beyotime Institute of Biotechnology, Haimen, China) for 10 minutes. Subsequently, the treated cells were incubated with 200 μL Actin‐Tracker Green solutions (1:40; Beyotime Institute of Biotechnology) and protected from light for 30 minutes. Lastly, DAPI (Beyotime Institute of Biotechnology) was applied to stain nuclei. Representative images were taken by confocal laser scanning microscopy.
2.5. Proliferation assay
BMSCs proliferation was tested with a colourimetric cell proliferation protocol according to Cell Counting Kit‑8 (CCK‐8; Dojinodo, Tokyo, Japan). Cells were seeded in 96‐well plates at 3000 cells/well, then treated with GO/DMEM at different final concentrations (concentration of 0, 0.01, 0.1, 1 and 10 μg/mL) by the two methods described above. After the indicated time points for 1, 3, 5 and 7 days of incubation, cells were washed twice with PBS, 10 μL of CCK‐8 solution and 100 μL DMEM were added to each well, and a blank group contained an equal amount of CCK‐8. Cells with CCK‐8 solution and DMEM were incubated for 2 hours. The OD value for each well at 450 nm was detected by a microplate reader (Tecan, Männedorf, Switzerland).
2.6. ALP activity assay
BMSCs were seeded at 5×10⁴ cells/well in 24‐well plates and then treated with GO/DMEM and GO/OIM at concentrations of 0, 0.01 and 0.1 μg/mL for 3 and 7 days. ALP activity was performed according to the manufacturer's instructions (Nanjing Jiancheng Bioengineering Institute, Nanjing, China). In brief, 1 mL of post‐culture medium was collected for detection of the ALP activity secreted by BMSCs. The remaining cells underwent lysis in RIPA buffer (KeyGen BioTECH, Nanjing, China) supplemented with 1% protease inhibitor cocktail (CWBIO, Beijing, China) for the extraction of total protein. The concentration of protein was measured with a BCA protein assay kit (CWBIO). The collected medium and the total protein were used to test the ALP activities in accordance with the manufacturer's protocols.
2.7. Calcium deposition assay
Calcium deposits were quantitatively evaluated via alizarin red staining. BMSCs were sequentially seeded at 2×10⁵ cells/well in six‐well plates and incubated with GO/DMEM and GO/OIM for 21 days. Cells were washed three times with PBS and then fixed with 4% paraformaldehyde at room temperature for 30 minutes. After being washed with ultrapure water, cells were stained with alizarin red for 60 minutes. The microscopic images were obtained by means of an inverted microscope. Then, specimens were treated with 10% cetylpyridinium chloride solution for 20 minutes. The absorbance at 562 nm was tested by a microplate reader.
2.8. Protein extraction and Western blot
BMSCs were seeded at 2×10⁵ cells/well in the six‐well plates and then treated with prescribed concentrations of GO/OIM for 14 days. Cells underwent lysis in RIPA buffer containing 1 mmol/L of PMSF, and then the protein concentration was measured by means of a BCA assay kit. The extracted protein was diluted with 5X loading buffer and boiled for 10 minutes. Protein was separated by 8% SDS‐PAGE (CWBIO) and transferred to polyvinylidene difluoride membranes (EMD Millipore, Billerica, MA, USA). The membranes were blocked with 5% non‐fat milk in TBST (10 mmol/L TrisHCl, 50 mmol/L NaCl, 0.25% Tween 20) for 1 hour at room temperature and incubated with the primary antibodies against runt‐related transcription factor‐2 (Runx2), β‐catenin and GAPDH (1:1000; Cell Signalling Technology, Inc., Danvers, MA, USA) at 4°C overnight. Subsequently, the membrane was washed in TBST and incubated with secondary antibody for 1.5 hours at room temperature. The target proteins were detected by the enhanced chemiluminescent detection system (Millipore).
2.9. Statistical analysis
All experiments were run in triplicate. The GraphPad Prism version 6.0 program was used for statistical analysis of the data. Representative data are presented as means±standard deviation (SD). Cell proliferation and ALP activity comparisons were performed by two‐way analysis of variance (ANOVA). Mineralization and Western blot quantification was performed by one‐way ANOVA. All the analyses were followed by Tukey's multiple comparisons test for determination of the statistical significance. P values<.05 were considered significant.
3. RESULTS
3.1. The morphology of pristine GO nanosheets
The morphology of pristine GO nanosheets after being ultrasonically treated in tri‐distilled water was observed by TEM (Figure 1A), and optical images can be seen in Figure 1B. The morphology of pristine GO nanosheets showed two‐dimensional irregularly shaped flakes with the diameters of under 500 nm. The optical images showed that GO nanosheets were dispersed homogeneously into tri‐distilled water.
Figure 1.
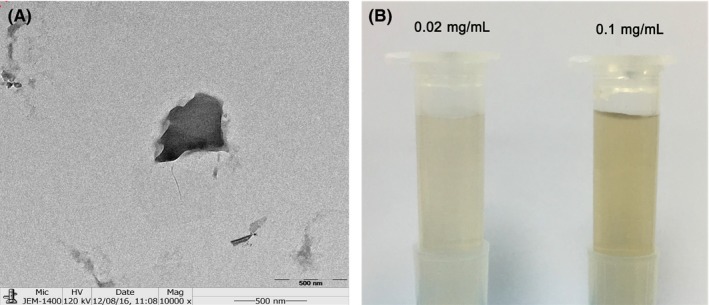
Characterization of pristine graphene oxide (GO) nanosheets and GO suspension. (A) Morphology of pristine GO nanosheets with TEM. (B) GO suspension with concentrations of 0.02 and 0.1 mg/mL, recorded by means of a digital camera
3.2. Characterization of BMSCs
The morphology of the BMSCs was visualized under inverted microscopy (Figure 2A) and was found to be different between cells at P3 and P8 after 5 days' incubation. Cells at P3 exhibited typical fibroblast‐like morphology, featuring small cell bodies with a few thin and long cell processes, which were maintained by the cells during the period of in vitro culture. Cells at P8 presented an abnormal morphology which appeared to be cellular senescence. Similarly, self‐renewal capability of cells at P3 was stronger than that of cells at P8. In addition, differentiation of BMSCs was performed with both osteogenic‐ and adipogenic‐induced media. The calcium deposits and lipid droplets after induced culture were observed by inverted microscopy (Figure 2B), by which BMSCs were confirmed to possess the ability of differentiation into osteoblasts and chondrocytes.
Figure 2.
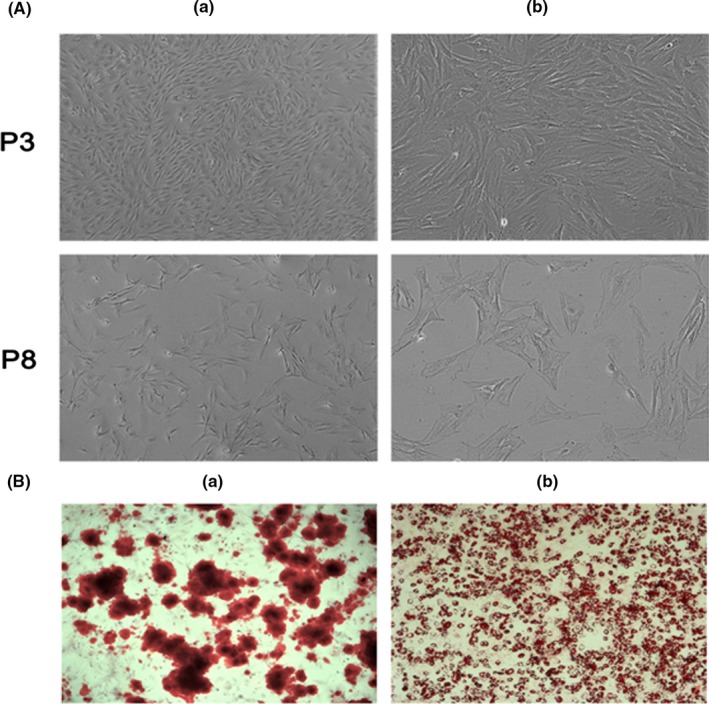
Characterization of bone marrow‐derived mesenchymal stem cells (BMSCs) (P3 and P8) morphology after 5 days of culture. (a) Low and (b) high magnification, as visualized by (A) inverted microscopy. (B) Microscopic images of BMSCs when stained with (a) alizarin red and (b) Oil Red O for the presence of calcium deposits and lipid droplets by successful differentiation into osteoblasts and adipocytes, respectively, in in vitro culture
3.3. Adhesion density, cytoskeleton and proliferation of BMSCs
The adhesion density and cytoskeleton of BMSCs, cultured with GO through both the above seeding methods, were characterized by confocal laser scanning microscopy (Figure 3). During the first 72 hours, under co‐seeding method, adhesion density of BMSCs was reduced after incubation with 1 and 10 μg/mL of GO when compared with that of the control group, and surviving cells exhibited abnormal morphology after co‐seeding with GO (Figure 3A). For the sequential‐seeding method, cells cultured with 0.01 and 0.1 μg/mL of GO exhibited healthy morphology and grew to confluence. At 1 and 10 μg/mL, the cell morphology was similar to that of the co‐seeding group. Cells treated with high concentrations of GO became smaller and shrinkage (Figure 3B). The effect of GO on the proliferation of BMSCs was determined by a CCK‐8 assay. For the two prescribed seeding methods, GO/DMEM at 10 μg/mL inhibited cell growth compared with the control group (Figure 4). Interestingly, GO/DMEM at 0.1 μg/mL significantly promoted the proliferation of cells for the sequential‐seeding method (Figure 4A,B), whilst GO/DMEM at 1 μg/mL inhibited cell growth significantly for the co‐seeding method (Figure 4C,D).
Figure 3.
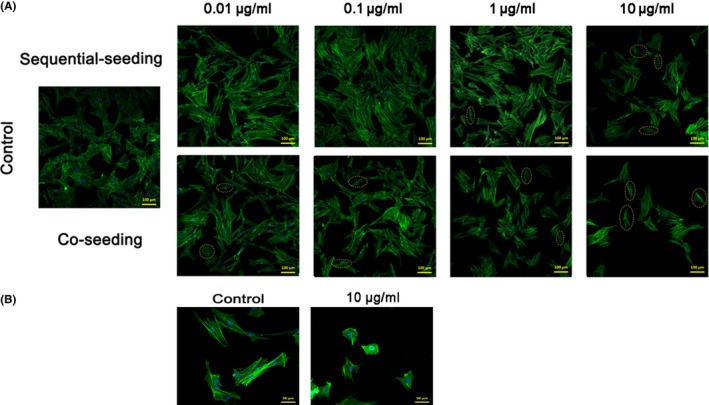
Adhesion density of bone marrow‐derived mesenchymal stem cells (BMSCs) that were sequentially seeded and co‐seeded into GO/DMEM at concentrations of 0.01~10 μg/mL and morphology of BMSCs treated with/without GO. (A) Confocal laser scanning images of BMSCs at low magnification show adhesion density after 72 h of incubation. The control group had no pristine GO nanosheets. Sample cells with abnormal morphology are circled with a dashed yellow line. (B) The high‐magnification images show the morphology of BMSCs after 72 h of incubation with and without pristine GO nanosheets. Blue stains nuclei and green stains cytoskeleton
Figure 4.
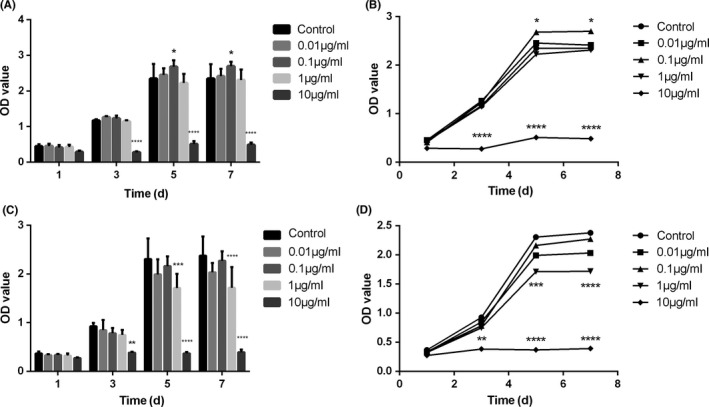
The proliferation of bone marrow‐derived mesenchymal stem cells treated with different final concentrations (0, 0.01, 0.1, 1 and 10 μg/mL) of GO/DMEM with sequential‐seeding (A, B) and co‐seeding methods (C, D) after 1, 3, 5 and 7 days. *P<.05, **P<.01, ***P<.001 and ****P<.0001 vs the control group (n=5)
3.4. The effect of ALP activity of BMSCs treated with GO
ALP activity after 3 and 7 days with GO/DMEM and GO/OIM is shown in Figure 5. The post‐cultured GO/DMEM was collected for the detection of ALP activity secreted by BMSCs for both the prescribed seeding methods. There were no significant differences in ALP activity among the three concentrations of GO/DMEM (Figure 5A,B), indicating that GO alone could not affect the ALP generation, further inducing osteogenic differentiation. The BMSCs treated with GO/OIM (0, 0.01 and 0.1 μg/mL) then underwent lysis for the detection of ALP activity within cells. As compared with the control groups, ALP activity increased significantly in the 0.1 μg/mL groups (Figure 5C).
Figure 5.
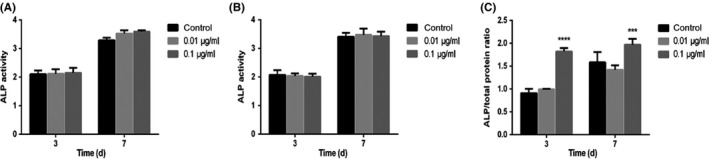
The effect of GO on ALP activity after 3 and 7 days' differentiation. Post‐cultured GO/DMEM was collected for the detection of ALP activity secreted by BMSCs with (A) sequential seeding and (B) co‐seeding methods. (C) The ALP activity within BMSCs treated with GO/OIM was measured. ***P<.001 and ****P<.0001 vs the control group
3.5. Mineralized matrix formation
The BMSCs culture surface stained positively for extracellular matrix in the presence of GO/DMEM and GO/OIM was measured after 21 days (Figure 6). No distinct differences among these three groups were found when BMSCs were cultured with GO/DMEM (Figure 6A). Whereas a higher level of mineralization with GO/OIM was observed after 21 days in the other groups compared with that in the control group (Figure 6B). Quantitative analysis showed that GO significantly promoted the mineralized matrix formation, and the level of mineralization in 0.1 μg/mL groups was significantly higher than that in 0.01 μg/mL groups (Figure 6C). These results indicated the potential effects of GO on osteogenic differentiation of BMSCs and the effects related to the concentration of pristine GO nanosheets.
Figure 6.
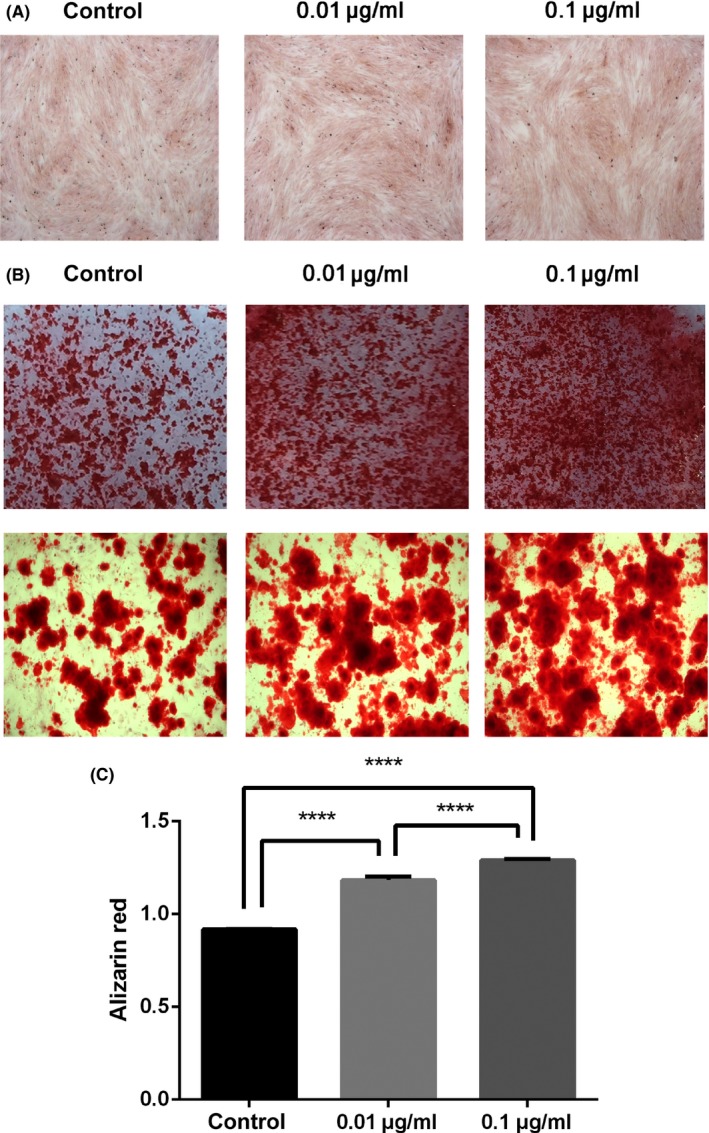
Mineralization of BMSCs treated with GO/DMEM and GO/OIM. (A) Alizarin red staining after culture with GO/DMEM for 21 days. (B) Optical photos and microscopic images showed the formation of calcium deposits after culture with GO/OIM for 21 days. (C) 10% cetylpyridinium chloride solution was used for the quantification of alizarin red staining. ****P<.0001
3.6. Osteogenic‐related protein expression
To assess the effect of GO on the osteogenic differentiation of BMSCs, we analysed Runx2 and β‐catenin expression at the protein level after 14 days of osteogenic‐induced culturing. Analysis of our data showed that the expression of Runx2 was distinctly higher in 0.01 and 0.1 μg/mL groups than in the control group. It was indicated that the addition of GO to OIM improved Runx2 expression in BMSCs. As for β‐catenin, the results showed that β‐catenin expression increased significantly when BMSCs were treated with GO/OIM compared to control group (Figure 7). Moreover, both the Runx2 and β‐catenin protein expressions were increased in 0.1 μg/mL group vs the 0.01 μg/mL group.
Figure 7.
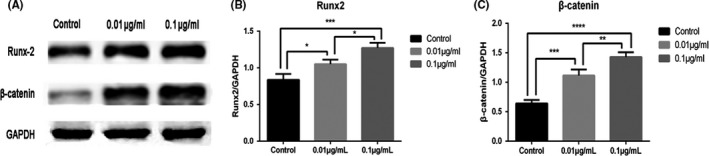
Expression profiles of osteogenic‐related proteins for differentiation of BMSCs in GO/OIM after 14 days. (A) Representative Western blot scans of each protein. (B, C) ImageJ software was used for semiquantitative analyses of Runx2 and β‐catenin expression. *P<.05, **P<.01, ***P<.001 and ****P<.0001
4. DISCUSSION
In recent years, the exploration of biomaterial osteoinduction has become a major dental implant research focus. Graphene oxide, the novel biomaterial, has been widely researched in biological applications because of its good biocompatibility and hydrophilicity, large specific surface area, abundant oxygen containing functional groups, high mechanical strength and ease of functional modification.34, 35, 36 As we know, GO substrate and GO/materials composites have exhibited excellent capability to improve the osteogenic differentiation of BMSCs. Therefore, we proposed to gain new insights by studying the cellular behaviours of BMSCs towards pristine GO nanosheets using two biomimetic methods for the first time. The present study demonstrated that the cellular behaviours of BMSCs towards pristine GO nanosheets depended on GO concentration and in vitro culture methods. Particularly, 0.1 μg/mL of GO could improve the adhesion density and proliferation of BMSCs with the sequential‐seeding method. The ALP activity, mineralization and osteogenic‐related proteins could be promoted by 0.1 μg/mL of GO with chemical inducers. Thus, the optimum concentration of 0.1 μg/mL was revealed, for pristine GO nanosheets, to improve the cellular behaviours of BMSCs.
BMSCs have been recognized as promising therapeutic cells for osseointegration which plays a critical role in the success of dental implants. Tooth loss is always accompanied by the presence of insufficient bone volume. Recent advancements in bone tissue engineering techniques have made it possible to provide new regenerative treatment, including autologous stem cell transplantation.37 Most research had focused on the reaction between dental implant materials and well‐established BMSCs in vitro and in vivo. However, it is important to explore how transplantation cells in our body react to the use of biomaterials. In this regard, two in vitro biomimetic methods were used to imitate similar in vivo scenarios: sequential‐seeding (the interaction between GO and established cells) and co‐seeding (the interaction between GO and migrating cells).
The effects of GO on adhesion density and the proliferation of BMSCs depended on GO concentration and in vitro culture methods. With the co‐seeding method, adhesion density and proliferation of BMSCs were inhibited when cultured with GO/DMEM at concentrations of 1 and 10 μg/mL as compared with the control group, because BMSCs were likely to have more direct contact with pristine GO nanosheets during co‐seeding, when the cells had not yet adhered to the plastic substrates and not yet become well‐established, which might have made the BMSCs more vulnerable to GO nanosheets. A correlative conclusion, drawn by Sawai et al.,38 was that contact frequency between cells and biomaterials affected the cell viability. In an earlier study, the co‐seeding method tended to cause cells death, and low concentrations of biomaterials could promote the proliferation of cells with the sequential‐seeding method when BMSCs were exposed to magnesium oxide, which was in agreement with our results.30 In this study, with the sequential‐seeding method, proliferation of BMSCs was significantly higher than in the control group after 5 days when cultured with 0.1 μg/mL of GO. Moreover, the BMSCs with sequentially seeded 1 μg/mL of GO showed cell proliferation similar to that of the control group during the prescribed time points. The cell morphology became smaller and shrinkage when incubation with 1 and 10 μg/mL of GO, which might result from the oxidative stress induced by a high concentration of GO.39, 40 These results indicated that BMSCs cultured with sequential‐seeding method were less vulnerable than those cultured with co‐seeding method, and that GO at 0.1 μg/mL was beneficial for proliferation and osteogenesis, because BMSCs growth was improved. Thus, only 0.01 and 0.1 μg/mL of GO were applied to investigate osteogenic differentiation.
In view of the above conclusions, the early process of osteogenic differentiation can be measured by an ALP activity assay, which is recognized as an early marker for osteogenesis.41 From the results, there was no significant difference between the two biomimetic methods or among the aforementioned concentrations of GO when BMSCs were cultured by GO/DMEM without any chemical inducers after 3 and 7 days, which suggested that GO alone could not promote the osteogenic differentiation of BMSCs and the culture methods might affect adhesion density and proliferation in only the early period. Results of mineralization were in conformity with this suggestion. This finding was consistent with previously established data, reported by Lee et al.,15 that MSCs cultured on GO were more osteogenic and deposited more minerals under chemical inducers compared with those without chemical inducers. There were some discrepancies with early work. Vinicius et al.42 reported that GO alone cultured with dental pulp stem cells could up‐regulate the expression of several osteoblastic‐related genes. The differences in GO characterization, including synthetic method, oxidation‐state, electrostatic and hydrogen bonding, might account for these discrepancies.15, 39 In contrast, ALP activity significantly increased when BMSCs were cultured with 0.1 μg/mL of GO/OIM after 3 and 7 days. These results indicated that 0.1 μg/mL appeared to be the optimum concentration of GO for BMSCs differentiation into osteoblasts. Subsequently, the sequential‐seeding method and GO/OIM were applied for evaluation of the mineralization and osteogenic‐related proteins of BMSCs.
Bone formation followed the cellular hierarchy, which initiates from the differentiation of BMSCs into osteoprogenitor cells and then preosteoblasts and osteoblasts, and further into matrix maturation and matrix mineralization.43 From the results of alizarin red staining, matrix mineralization formation was markedly increased after GO was used as the osteogenic inducer. Moreover, BMSCs with 0.1 μg/mL of GO exhibited distinctly stronger capability of mineralization compared with those with 0.01 μg/mL of GO, suggesting that pristine GO nanosheets treatment could improve osteogenesis, and the effect was concentration‐dependent. For further verification of the GO‐induced enhanced osteogenic activity, the expression levels of several osteogenic‐related proteins were investigated. Runx2 is essential for osteogenic differentiation and skeletal generation, acting as regulatory factors involved in bone formation.44, 45 According to Runx2 protein expression results, the aforementioned conclusion that 0.1 μg/mL of GO improved osteogenic differentiation of BMSCs was confirmed. Interestingly, GO treatment resulted in up‐regulation of β‐catenin protein expression, which is the key component of the canonical Wnt signalling pathway. It was generally known that Wnt/β‐catenin pathway plays an essential role in osteogenesis and homeostasis through up‐regulation of Runx2.46, 47 Therefore, the acceleration of bone formation and regeneration in BMSCs after treatment by pristine GO nanosheets appeared to be related to activation of the Wnt/β‐catenin signalling pathway, which needs further study.
Thus, our in vitro results have demonstrated that the sequential‐seeding method was beneficial for adhesion density and the proliferation of BMSCs when treated with 0.1 μg/mL of GO. We speculated that GO could promote osteogenic differentiation through activation of Wnt/β‐catenin signalling pathway, and that the effect of osteogenesis was concentration‐dependent. However, further research is necessary to determine the exact mechanisms whereby full advantages can be taken of pristine GO nanosheets for dental implant applications.
5. CONCLUSION
This article reports, for the first time, the use of two in vitro biomimetic culture methods (sequential‐seeding and co‐seeding) to affect the cellular behaviours of BMSCs towards pristine GO nanosheets. GO at a concentration of 0.1 μg/mL facilitated BMSCs proliferation up to 7 days in vitro when sequentially seeded. Pristine GO nanosheets alone cultured with BMSCs could not improve ALP activity and mineralization under both prescribed culture methods. Moreover, osteogenic‐related protein measurement showed that GO with chemical inducers might promote osteogenic differentiation and that 0.1 μg/mL appeared to be the optimum concentration. These results propose pristine GO nanosheets as a potential surface modification or guide bone regeneration biomaterial for improving osseointegration in dental implantation.
ACKNOWLEDGEMENTS
This study was supported by the National Natural Science Foundation of China (No. 81472526), the Guangdong Science and Technology Project (No. 2016A020216007) and the Natural Science Foundation of Guangdong Province (No. 2014A030313126).
CONFLICT OF INTEREST STATEMENT
There are no competing financial interests among the authors.
Wei C, Liu Z, Jiang F, Zeng B, Huang M, Yu D. Cellular behaviours of bone marrow‐derived mesenchymal stem cells towards pristine graphene oxide nanosheets. Cell Prolif. 2017;50:e12367 10.1111/cpr.12367
REFERENCES
- 1. Novoselov KS, Geim AK, Morozov SV, et al. Electric field effect in atomically thin carbon films. Science. 2004;306:666‐669. [DOI] [PubMed] [Google Scholar]
- 2. Park S, Mohanty N, Suk JW, et al. Biocompatible, robust free‐standing paper composed of a TWEEN/Graphene composite. Adv Mater. 2010;22:1736. [DOI] [PubMed] [Google Scholar]
- 3. Ning L, Xuemin Z, Qin S, et al. The promotion of neurite sprouting and outgrowth of mouse hippocampal cells in culture by graphene substrates. Biomaterials. 2011;32:9374‐9382. [DOI] [PubMed] [Google Scholar]
- 4. La W, Park S, Yoon H, et al. Delivery of a therapeutic protein for bone regeneration from a substrate coated with graphene oxide. Small. 2013;9:4051‐4060. [DOI] [PubMed] [Google Scholar]
- 5. La W, Jin M, Park S, et al. Delivery of bone morphogenetic protein‐2 and substance P using graphene oxide for bone regeneration. Int J Nanomed. 2014;91:107‐116. [DOI] [PMC free article] [PubMed] [Google Scholar]
- 6. Hu W, Peng C, Luo W, et al. Graphene‐based antibacterial paper. ACS Nano. 2010;4:4317‐4323. [DOI] [PubMed] [Google Scholar]
- 7. Peng J, Lin J, Chen Z, et al. Enhanced antimicrobial activities of silver‐nanoparticle‐decorated reduced graphene nanocomposites against oral pathogens. Mat Sci Eng C‐Mater. 2017;71:10‐16. [DOI] [PubMed] [Google Scholar]
- 8. Yang K, Zhang S, Zhang G, Sun X, Lee S, Liu Z. Graphene in mice: ultrahigh in vivo tumor uptake and efficient photothermal therapy. Nano Lett. 2010;10:3318‐3323. [DOI] [PubMed] [Google Scholar]
- 9. Akhavan O, Ghaderi E, Emamy H. Nontoxic concentrations of PEGylated graphene nanoribbons for selective cancer cell imaging and photothermal therapy. J Mater Chem. 2012;22:20626‐20633. [Google Scholar]
- 10. Guo N, Hu W, Jiang T, et al. High‐quality infrared imaging with graphene photodetectors at room temperature. Nanoscale. 2016;8:16065‐16072. [DOI] [PubMed] [Google Scholar]
- 11. Chen J, Liu C, Zeng G, et al. Indocyanine green loaded reduced graphene oxide for in vivo photoacoustic/fluorescence dual‐modality tumor imaging. Nanoscale Res Lett. 2016;11:85. [DOI] [PMC free article] [PubMed] [Google Scholar]
- 12. Park S, Ruoff RS. Chemical methods for the production of graphenes. Nat Nanotechnol. 2009;4:217‐224. [DOI] [PubMed] [Google Scholar]
- 13. Liu F, Seo TS. A controllable self‐assembly method for large‐scale synthesis of graphene sponges and free‐standing graphene films. Adv Funct Mater. 2010;20:1930‐1936. [Google Scholar]
- 14. Nayak TR, Andersen H, Makam VS, et al. Graphene for controlled and accelerated osteogenic differentiation of human mesenchymal stem cells. ACS Nano. 2011;5:4670‐4678. [DOI] [PubMed] [Google Scholar]
- 15. Lee WC, Lim CH, Shi H, et al. Origin of enhanced stem cell growth and differentiation on graphene and graphene oxide. ACS Nano. 2011;5:7334‐7341. [DOI] [PubMed] [Google Scholar]
- 16. Dinescu S, Ionita M, Pandele AM, et al. In vitro cytocompatibility evaluation of chitosan/graphene oxide 3D scaffold composites designed for bone tissue engineering. Bio‐Med Mater Eng. 2014;24:2249‐2256. [DOI] [PubMed] [Google Scholar]
- 17. Liu S, Zeng TH, Hofmann M, et al. Antibacterial activity of graphite, graphite oxide, graphene oxide, and reduced graphene oxide: membrane and oxidative stress. ACS Nano. 2011;5:6971‐6980. [DOI] [PubMed] [Google Scholar]
- 18. Marcelo CG, Filie Haddad M, Gennari Filho H, Marcelo Ribeiro Villa L, Dos Santos DM, Aldieris AP. Dental implant fractures – aetiology, treatment and case report. J Clin Diagn Res. 2014;8:300‐304. [DOI] [PMC free article] [PubMed] [Google Scholar]
- 19. Pittenger MF, Mackay AM, Beck SC, et al. Multilineage potential of adult human mesenchymal stem cells. Science. 1999;284:143‐147. [DOI] [PubMed] [Google Scholar]
- 20. Treiser MD, Yang EH, Gordonov S, et al. Cytoskeleton‐based forecasting of stem cell lineage fates. Proc Natl Acad Sci USA. 2010;107:610‐615. [DOI] [PMC free article] [PubMed] [Google Scholar]
- 21. Luo Y, Shen H, Fang Y, et al. Enhanced proliferation and osteogenic differentiation of mesenchymal stem cells on graphene oxide‐incorporated electrospun poly(lactic‐co‐glycolic acid) nanofibrous mats. ACS Appl Mater Inter. 2015;7:6331‐6339. [DOI] [PubMed] [Google Scholar]
- 22. Nair M, Nancy D, Krishnan AG, Anjusree GS, Vadukumpully S, Nair SV. Graphene oxide nanoflakes incorporated gelatin‐hydroxyapatite scaffolds enhance osteogenic differentiation of human mesenchymal stem cells. Nanotechnology. 2015;26:161001. [DOI] [PubMed] [Google Scholar]
- 23. Park KO, Lee JH, Park JH, et al. Graphene oxide‐coated guided bone regeneration membranes with enhanced osteogenesis: spectroscopic analysis and animal study. Appl Spectrosc Rev. 2016;51:540‐551. [Google Scholar]
- 24. Makharza S, Cirillo G, Bachmatiuk A, et al. Size‐dependent nanographene oxide as a platform for efficient carboplatin release. J Mater Chem B. 2013;1:6107‐6114. [DOI] [PubMed] [Google Scholar]
- 25. Talukdar Y, Rashkow JT, Lalwani G, Kanakia S, Sitharaman B. The effects of graphene nanostructures on mesenchymal stem cells. Biomaterials. 2014;35:4863‐4877. [DOI] [PMC free article] [PubMed] [Google Scholar]
- 26. Park J, Kim B, Han J, et al. Graphene oxide flakes as a cellular adhesive: prevention of reactive oxygen species mediated death of implanted cells for cardiac repair. ACS Nano. 2015;9:4987‐4999. [DOI] [PubMed] [Google Scholar]
- 27. Sales VL, Mettler BA, Lopez‐Ilasaca M, Johnson JA Jr, Mayer JE. Endothelial progenitor and mesenchymal stem cell‐derived cells persist in tissue‐engineered patch in vivo: application of green and red fluorescent protein‐expressing retroviral vector. Tissue Eng. 2007;13:525‐535. [DOI] [PubMed] [Google Scholar]
- 28. Honda MJ, Tsuchiya S, Sumita Y, Sagara H, Ueda M. The sequential seeding of epithelial and mesenchymal cells for tissue‐engineered tooth regeneration. Biomaterials. 2007;28:680‐689. [DOI] [PubMed] [Google Scholar]
- 29. Ji YL, Tuleuova N, Jones CN, Ramanculov E, Zern MA, Revzin YA. Directing hepatic differentiation of embryonic stem cells with protein microarray‐based co‐cultures. Integr Biol‐UK. 2009;1:460‐468. [DOI] [PubMed] [Google Scholar]
- 30. Wetteland CL, Nguyen NT, Liu H. Concentration‐dependent behaviors of bone marrow derived mesenchymal stem cells and infectious bacteria toward magnesium oxide nanoparticles. Acta Biomater. 2016;35:341‐356. [DOI] [PubMed] [Google Scholar]
- 31. Hu Y, Tang XX, He HY. Gene expression during induced differentiation of sheep bone marrow mesenchymal stem cells into osteoblasts. Genet Mol Res. 2013;12:6527‐6534. [DOI] [PubMed] [Google Scholar]
- 32. Wu Y, Xia L, Zhou Y, Xu Y, Jiang X. Icariin induces osteogenic differentiation of bone mesenchymal stem cells in a MAPK‐dependent manner. Cell Proliferat. 2015;48:375‐384. [DOI] [PMC free article] [PubMed] [Google Scholar]
- 33. Dominici M, Le Blanc K, Mueller I, et al. Minimal criteria for defining multipotent mesenchymal stromal cells. The International Society for Cellular Therapy position statement. Cytotherapy. 2006;8:315‐317. [DOI] [PubMed] [Google Scholar]
- 34. Sasidharan A, Panchakarla LS, Chandran P, et al. Differential nano‐bio interactions and toxicity effects of pristine versus functionalized graphene. Nanoscale. 2011;3:2461‐2464. [DOI] [PubMed] [Google Scholar]
- 35. Jiayu L, Yu‐Shi H, Chi C, et al. Self‐supporting graphene hydrogel film as an experimental platform to evaluate the potential of graphene for bone regeneration. Adv Funct Mater. 2013;23:3494‐3502. [Google Scholar]
- 36. Bortz DR, Garcia Heras E, Martin‐Gullon I. Impressive fatigue life and fracture toughness improvements in graphene oxide/epoxy composites. Macromolecules. 2012;45:238‐245. [Google Scholar]
- 37. Park K, Koak J, Kim S, Heo S. Wettability and cellular response of UV light irradiated anodized titanium surface. J Adv Prosthodont. 2011;3:63‐68. [DOI] [PMC free article] [PubMed] [Google Scholar]
- 38. Sawai J, Kojima H, Igarashi H, et al. Antibacterial characteristics of magnesium oxide powder. World J Microbiol Biotechnol. 2000;16:187‐194. [Google Scholar]
- 39. Zhang W, Yan L, Li M, et al. Deciphering the underlying mechanisms of oxidation‐state dependent cytotoxicity of graphene oxide on mammalian cells. Toxicol Lett. 2015;237:61‐71. [DOI] [PubMed] [Google Scholar]
- 40. Zhao L, Duan G, Yang Z, et al. Particle size‐dependent antibacterial activity and murine cell cytotoxicity induced by graphene oxide nanomaterials. J Nanomater. 2016; Article ID 6709764. [Google Scholar]
- 41. Garcia AJ, Reyes CD. Bio‐adhesive surfaces to promote osteoblast differentiation and bone formation. J Dent Res. 2005;84:407‐413. [DOI] [PubMed] [Google Scholar]
- 42. Rosa V, Xie H, Dubey N, et al. Graphene oxide‐based substrate: physical and surface characterization, cytocompatibility and differentiation potential of dental pulp stem cells. Dent Mater. 2016;32:1019‐1025. [DOI] [PubMed] [Google Scholar]
- 43. Long MW. Osteogenesis and bone‐marrow‐derived cells. Blood Cells Mol Dis. 2001;27:677‐690. [DOI] [PubMed] [Google Scholar]
- 44. Yang D, Okamura H, Nakashima Y, Haneji T. Histone demethylase Jmjd3 regulates osteoblast differentiation via transcription factors Runx2 and Osterix. J Biol Chem. 2013;288:33530‐33541. [DOI] [PMC free article] [PubMed] [Google Scholar]
- 45. Pan K, Sun Q, Zhang J, et al. Multilineage differentiation of dental follicle cells and the roles of Runx2 over‐expression in enhancing osteoblast/cementoblast‐related gene expression in dental follicle cells. Cell Proliferat. 2010;43:219‐228. [DOI] [PMC free article] [PubMed] [Google Scholar]
- 46. Takada I, Kouzmenko AP, Kato S. Wnt and PPARgamma signaling in osteoblastogenesis and adipogenesis. Nat Rev Rheumatol. 2009;5:442‐447. [DOI] [PubMed] [Google Scholar]
- 47. Arioka M, Takahashi‐Yanaga F, Sasaki M, et al. Acceleration of bone development and regeneration through the Wnt/beta‐catenin signaling pathway in mice heterozygously deficient for GSK‐3beta. Biochem Biophys Res Commun. 2013;440:677‐682. [DOI] [PubMed] [Google Scholar]