

Abstract
Objectives
The transfer of melanosomes from melanocytes to neighbouring keratinocytes is critical to protect the skin from the deleterious effects of ultraviolet A (UVA) and ultraviolet B (UVB) irradiation; however, the initial factor(s) that stimulates melanosome transfer remains unclear. In this study, we investigated the induction of retinal‐dependent calcium (Ca2+) influx in melanocytes (MCs) by UVA or UVB irradiation and the effect of transient receptor potential cation channel subfamily M member 1 (TRPM1) (melastatin1)‐related Ca2+ influx on melanosome transfer.
Materials and methods
Primary human epidermal MCs were exposed to physiological doses of UVB or UVA light and loaded with a calcium indicator Fluo‐4 dye. The change of intracellular calcium of MCs was monitored using a two‐photon confocal fluorescence microscopy. MCs were co‐cultured with human epidermal keratinocytes (KCs) in the absence or presence of voriconazole (a TRPM1 blocker) or calcium chelators. MCs were also transfected with TRPM1 siRNA for silencing the expression of TRPM1 gene. The melanosome transfer in the co‐cultured cells was quantitatively analysed using flow cytometry and was further confirmed by immunofluorescent double‐staining. The protein levels and distributions of TRPM1, OPN3 and OPN5 in MCs were measured by Western blotting or immunofluorescent staining.
Results
The retinal‐dependent Ca2+ influx of UVA‐exposed melanocytes differed greatly from that of UVB‐exposed melanocytes in the timing‐phase. The protein expression of TRPM1 in mono‐ and co‐cultured MCs was dose‐dependently up‐regulated by UVA and UVB. TRPM1 siRNA‐mediated knockdown and the blockage of TRPM1 channel using a putative antagonist (voriconazole) significantly inhibited melanosome transfer in co‐cultures following UVA or UVB exposure.
Conclusions
The distinct time‐phases of Ca2+ influx in MCs induced by UVA or UVB contribute to the consecutive stimulation of melanosome transfer, thereby providing a potent photoprotection against harmful UV radiation.
Abbreviations
- DT
delayed tanning
- IPD
immediate pigment darkening
- KCs
keratinocytes
- MCs
melanocytes
- MITF
microphthalmia‐associated transcription factor
- OPN3
opsin‐3
- OPN5
opsin‐5
- PBS
phosphate‐buffered saline
- TRPM1
transient receptor potential cation channel subfamily M member 1
- UVA
ultraviolet A
- UVB
ultraviolet B
1. INTRODUCTION
In spite of the fact that human skin is considerably photoprotected against ultraviolet (UV) irradiation, both cell types that reside in the epidermis, keratinocytes (KCs) and melanocytes (MCs) are highly sensitive to UV‐induced DNA damage.1, 2, 3, 4 As such, MCs play a decisive role in photoprotection by synthesizing and storing melanin pigments within membrane‐bound organelles termed melanosomes, and by their transfer of those pigmented organelles from MCs to neighbouring KCs.2, 5, 6 Following exposure to ultraviolet A (UVA) (280‐320 nm) or ultraviolet B (UVB) (320‐400 nm), normal human skin produces a similar visible skin tan; however, only tans induced by UVB and not those induced by UVA provide a substantive protection against DNA damage caused by subsequent UV exposure.7, 8, 9 Despite much data currently supporting the assumption that human MCs show an intrinsic vulnerability in fighting against photocarcinogenesis following exposure to UVA,7, 10 there is very little known about the exact mechanism(s) underlying UV‐induced tanning per se. It has been speculated that UVA causes immediate pigment darkening (IPD) of the skin within hours via the photo‐oxidation and/or re‐distribution of existing melanin.11, 12 However, UVB induces delayed tanning (DT) of the skin that lasts a few weeks, in which de novo melanin synthesis is induced.10, 13 Emerging evidence has demonstrated that retinal‐dependent calcium [Ca2+] influx drives early melanin synthesis in human melanocytes.14 TRPM1 (transient receptor potential cation channel subfamily M member 1, melastatin‐1) is involved in that process.15, 16 In this study, we investigate the changes of retinal‐dependent Ca2+ influx in MCs exposed to UVA or UVB, further examining the effects of TRPM1 siRNA‐mediated knockdown or pharmacological blockage of TRPM1 on melanosome transfer.
2. MATERIALS AND METHODS
2.1. Cell cultures, co‐culture and UVA/UVB radiation
Primary human epidermal MCs and human epidermal KCs were isolated from juvenile foreskin tissues (skin phototype III/IV) as previously described with a minor modification.17 MCs and KCs were cultured with complete Medium 254 and EpiLife medium respectively (all from Cascade Biologics, Portland, OR, USA). All cells used in our experiments were from passages 2 to 4. In some experiments, HaCaT KCs were also grown in complete EpiLife medium. To establish the co‐culture system, primary KCs or HaCaT KCs were first seeded in six‐well culture plates, allowing the cells to attach the bottom of the wells. MCs were then added on the surface of the KCs at a ratio of 1:10 or 1:20. The co‐cultures were changed to fresh complete EpiLife medium to keep both types of cells growing in good condition. To induce melanosome transfer, cells in co‐cultures were exposed to UVA or UVB radiation using a high‐dose targeted phototherapy system (Daavlin, Bryan, OH, USA) with a maximum wavelength at 311 or 350 nm respectively. The dosage of UV radiation used is indicated in the figures. Cell culture plates were wrapped with aluminium foil for sham‐irradiated controls.
2.2. Immunofluorescent assay
Primary MCs were seeded in six‐well culture plates containing coverslips. After attachment, the cells were irradiated with UVA and/or UVB at the doses indicated. The cells were immediately fixed in 4% paraformaldehyde in phosphate‐buffered saline (PBS) for 30 minute at room temperature, permeabilized with 0.3% Triton X‐100 in PBS for 15 minute and then blocked for 1 hour at 37°C using a blocking buffer including 10% normal goat serum. The primary antibodies, including anti‐TRPM1 (ab72154, Abcam, Cambridge, MA, USA), anti‐OPN3 (SAB4501013, Sigma‐Aldrich, St Louis, MO, USA) and anti‐OPN5 (SAB2700204, Sigma‐Aldrich), were diluted to 1:200 in blocking buffer and were placed on the cells at 4°C overnight. After the incubation, cells on coverslips were washed three times in PBS. The cells were then incubated with goat anti‐rabbit IgG (H + L) conjugated with Alexa‐488 secondary antibody (Invitrogen, Carisbad, CA, USA) for 1 hour at 37°C. For immunofluorescent double‐staining, the co‐cultured cells were incubated with the mixture of two primary antibodies, anti‐tyrosinase antibody conjugated with PE (goat IgG, sc‐7833PE, Santa Cruz Biotechnology, Santa Cruz, CA, USA) and anti‐pan cytokeratin antibody conjugated with FITC (mouse IgG, sc‐8018FITC, Santa Cruz Biotechnology). Nuclei were stained using 4′6′‐diamidino‐2‐phenylindole (DAPI) solution. Imaging was performed using an FV1200 (Olympus, Tokyo, Japan) confocal microscope.
2.3. Calcium imaging
MCs were grown in four‐well Lab‐Tek chamber slides and were then incubated for 15 minute at room temperature in Ringer's solution with 2 μM Fluo‐4 (Molecular Probes‐Invitrogen, Eugene, OR, USA) and 250 μM sulfinpyrazone (Sigma‐Aldrich), followed by incubation in the dark for 15 minute with 10 μM all‐trans retinal (Sigma‐Aldrich). Imaging was performed in modified Ringer's extracellular solution containing: 150 mM NaCl, 1.8 mM CaCl2, 1.2 mM MgCl2, 10 mM D‐glucose, 25 mM HEPEs, pH 7.4 and 310 mOsm/L. The cells were irradiated with UVA or UVB at the doses indicated. Fluorescence images were acquired every 2 second, and Fluo‐4 fluorescence intensities were quantified as ΔF/F0(t) = [Fcell(t) − F baseline]/F baseline.18
2.4. Melanosome transfer assay using flow cytometry analysis
Co‐cultures of MCs and KCs were established and maintained in complete EpiLife medium.19, 20 Cells in co‐culture were treated with the indicated compounds for 30 minute prior to UVA or UVB irradiation. For the melanosome transfer assay, the cells were harvested and washed with cold PBS, fixed in 1% paraformaldehyde for 10 minute, washed with PBS containing 0.2% Triton X‐100 for 10 minute, and then incubated with primary antibodies for 1 hour at room temperature. MCs and KCs were immunostained with an anti‐tyrosinase antibody conjugated with PE (sc‐7833PE, Santa Cruz Biotechnology, Santa Cruz, CA, USA) and an anti‐pan cytokeratin antibody conjugated with FITC (sc‐8018FITC, Santa Cruz Biotechnology) respectively. Stained cells were analysed by flow cytometry. A total of 10 000 events were collected on the BD FACS Calibur Flow Cytometer (BD Biosciences, San Jose, CA, USA) equipped with CellQuest Pro software for each sample. The percentage of cells positive for both cytokeratin and tyrosinase represents melanosome transfer efficacy.20, 21
2.5. Real‐time quantitative RT‐PCR (qPCR) and RT‐PCR
The total RNA was isolated from mono‐ or/co‐cultured cells. PCR was performed in triplicate with SYBR Green PCR core reagents (Applied Biosystems, Foster City, CA). About 50 ng of cDNA, 1 μM of forward and reverse primers for TRPM1 (forward primer 5′‐AAATCAATATCCAACCAGGTG‐3′, reverse primer 5′‐CGATCCCGTTCCTCTTGGTC‐3′) or (forward primer 5′‐TGGCGGATATTCCAATAAAGC‐3′, reverse primer 5′‐GTGGGAGTTGTTGAGCACAGAG‐3′) were used to produce amplicons of 176 bp and 430 bp, respectively, for qPCR and RT‐PCR. β‐actin (ACTB) was used as endogenous internal control (forward primer 5′‐AGCGAGCATCCCCCAAAGTT‐3′, reverse primer 5′‐GGGCACGAAGGCTCATCATT‐3′) with a product size of 285 bp. Real‐time PCR was performed using ABI 7500 and cycle parameters: denaturation at 95°C for 10 minute, followed by 40 cycles of 95°C for 30 second, 55°C for 30 second and 72°C for 30 second. The purity of product was checked by dissociation curve analysis as well as running the samples on 1% agarose gel. Data are shown as Ct values after normalization with ACTB.
2.6. siRNA‐induced TRPM 1 mRNA knockdown
Small interfering RNA (siRNA) duplexes targeting TRPM1 (Cat#: sc‐43936) and a non‐targeting scramble control (Cat#: sc‐37007) were purchased from Santa Cruz Biotechnology (Santa Cruz, CA, USA). MCs were seeded in six‐well plates. TRPM1 siRNA or the scramble control reagent was mixed with siRNA transfection medium (Cat#: sc‐36868, Santa Cruz) and dropped onto the cells according to the manufacturer's instruction. Efficiency of TRPM1 knockdown by these siRNAs was tested using RT‐PCR and Western blotting respectively.16
2.7. Western blotting
The cells were harvested and washed in PBS and lysed in extraction buffer containing 1% Nonidet P‐40, 0.01% SDS and a protease inhibitor cocktail (Roche, Indianapolis, IN, USA). Protein contents were determined using a BCA assay kit (Pierce, Rockford, IL, USA). Equal amounts of each protein extract (20 μg per lane) were resolved using 10% SDS polyacrylamide gel electrophoresis (SDS‐PAGE). The blotting membranes were incubated with a primary antibody, or with an anti‐tubulin antibody (Santa Cruz Biotechnology) at a dilution of 1:1000, for 1 hour at room temperature. The following primary antibodies were used: anti‐TRPM1 (ab72154, Abcam, 1:1500), anti‐OPN3 (SAB4501013, 1:1000, Sigma‐Aldrich) and anti‐OPN5 (SAB 2700204, 1:1000, Sigma‐Aldrich). The membranes were then washed and incubated with horseradish‐peroxidase‐conjugated anti‐rabbit IgG (Pierce) at a dilution of 1:2000 for 1 hour at room temperature. Membranes were then washed again and specific bands were visualized using a chemiluminescent reaction (ECL; Amersham, Piscataway, NJ, USA). The intensity of each band was quantified using ImageJ software (NIH, Bethesda, MD, USA) and was normalized against tubulin.
2.8. Statistical analysis
Data are expressed as means ± SEM. Student's t test and one‐way analysis of variance (ANOVA) were used to compare the mean intensities of Western blot bands and the mean percentages of cells positive for tyrosinase and pan cytokeratin were assessed by flow cytometry. P < .05 was considered statistically significant. All statistical analyses were performed using GraphPad Prism (San Diego, CA, USA).
3. RESULTS
3.1. Assessment of melanosome transfer using flow cytometry combined with immunofluorescent double‐staining
After co‐culture for 12 hour, the efficiency of melanosome transfer was quantitatively measured using flow cytometry.20, 21 As shown in Figure 1B, only 19% ± 9% of the cell population was double‐labelled with anti‐tyrosinase and anti‐pan‐keratin antibodies in the co‐culture, indicating that melanosome uptake by KCs was kept at a very low level without UV irradiation. Considering that cytokeratin 16 has been reported to express in normal human MCs,22 we also performed an immunofluorescent double‐staining technique using the same anti‐pan cytokeratin antibody to further verify the result of flow cytometry assay (Figure 1A). It was noteworthy that the primary antibody against pan cytokeratin only reacted with cytokeratin 4, 5, 6, 8, 10, 13 and 18 according to the manufacture's instruction.
Figure 1.
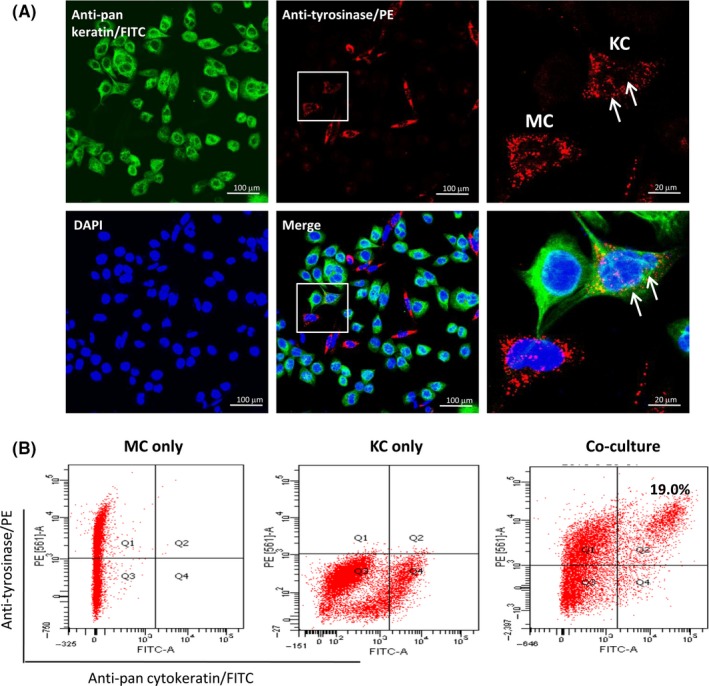
Quantitative assessments for melanosome transfer in MC‐KC co‐culture. (A) Human primary MCs and primary KCs were co‐cultured on coverslips at a ratio of 1:10 for 24 h. The co‐cultured cells were incubated with the mixture of two primary antibodies, including anti‐tyrosinase antibody conjugated with PE and anti‐pan cytokeratin antibody conjugated with FITC. Cell nuclei were then stained using DAPI solution. Higher magnifications of the boxed areas in the middle panel are shown on the right, white arrows indicate the representative image of melanosome transfer that the tyrosinase‐positive particles (red) are existed in cytokeratins‐positive cells (green). Scale bar: 100 μm. (B) Flow cytometry assay was performed to quantitatively analyse melanosome transfer rate using the same antibodies that were used for immunofluorescent double‐staining. The number of melanosome‐containing KCs was shown in the upper right quadrant. MCs only (in the upper left quadrant) and KCs only (in the lower right quadrant) were used as controls
3.2. Induction of retinal‐dependent Ca2+ influx in MCs by UVA or UVB contributes to the stimulation of melanosome transfer
The Ca2+ influx of MCs in the absence or presence of 10 μM all‐trans retinal following exposure to UVA or UVB was recorded using two‐photon calcium imaging. Figure 2 shows that a single dose of 3 J/cm2 UVA resulted in an early Ca2+ influx in MCs (spanning from 5 to 12 minute, with a peak intensity at 7.5 minute) (Figure 2A), while exposure to 20 mJ/cm2 UVB induced a delayed Ca2+ influx in MCs (spanning from 10 to 30 minute, with a peak intensity at 12.5 minute) (Figure 2D). We also noted that neither wavelength of UV induced a detectable calcium signal in MCs in the absence of retinal. It is plausible that epidermal KCs per se are able to synthesize all trans‐retinal that is involved in this induction of retinal‐dependent Ca2+ influx.23 Next, we evaluated the efficacies of melanosome transfer in MC‐KC co‐cultures at two time‐points (10 and 30 minute) following UVA/UVB irradiation using flow cytometry combined with immunofluorescent double‐staining. As shown in the Figure 3A, UVA exerted a strong induction on melanosome transfer at 10 minute post‐radiation to compare with UVB (63.3% ± 6.0% vs 54.0 ± 4.5, P < .05). In contrast, at 30 minute post‐irradiation, UVA was dramatically lower than UVB in stimulating melanosome transfer (40.5 ± 4.5 vs 63.2 ± 4.5, P < .01). Finally, we examined the effect of sequential exposure of same co‐cultured melanocytes to UVA and UVB on melanosome transfer as compared to UVB alone. The result (Figure 3D) showed that the sequential exposure (3 J/cm2 UVA and 5 mJ/cm2 UVB) was much more potent than UVB alone in stimulation on melanosome transfer.
Figure 2.
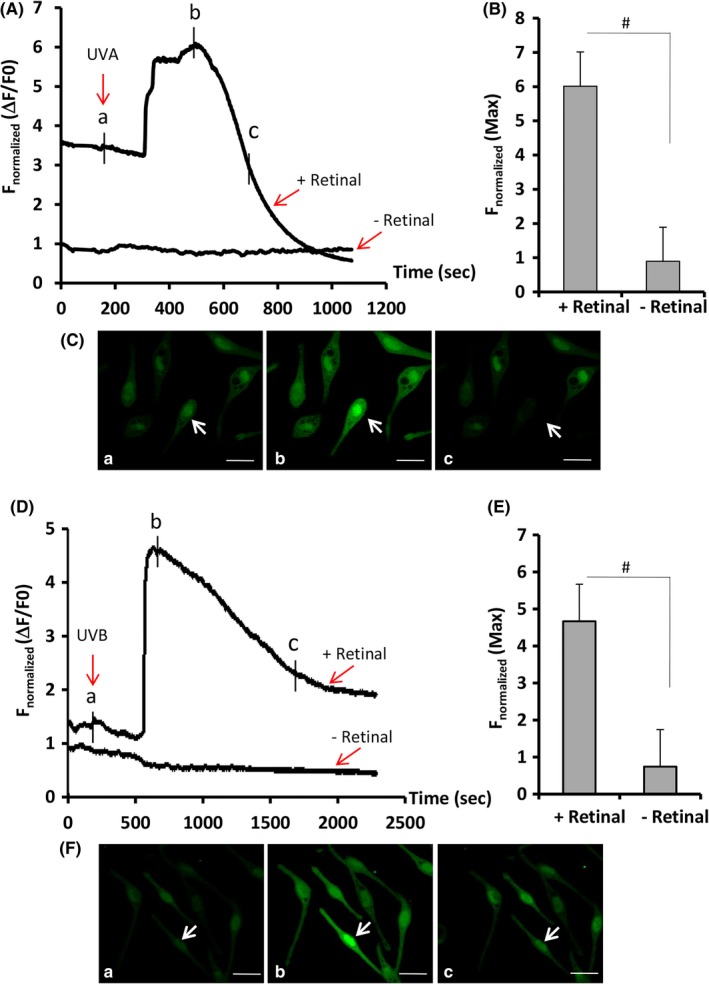
Ca2+ influx profiles of human MCs in response to ultraviolet A (UVA) or ultraviolet B (UVB). Human primary MCs grown in chamber slides were loaded with 2 μM Fluo‐4 AM dye, and cytosolic Ca2+ was monitored using a two‐photon confocal microscopy as described in the Materials and Methods. The fluorescence intensity of Fluo 4‐loaded MCs in response to 3 J/cm2 UVA (A‐C) or 20 mJ/cm2 UVB (D‐F) was recorded in the presence or absence of 10 μM all‐trans retinal. After exposure to UVA or UVB, the images of intracellular Ca2+ changes in representative cells (indicated by a white arrow) captured at a time in A and D (denoted by a, b, and c) are shown in the bottom panels (C and F). Changes of fluorescence intensity were calculated and normalized for 10 cells in each experiment (A and D). Bar graphs show the mean of normalized maximum fluorescence intensities from three independent experiments with at least 10 cells counted per experiment. # P < .01
Figure 3.
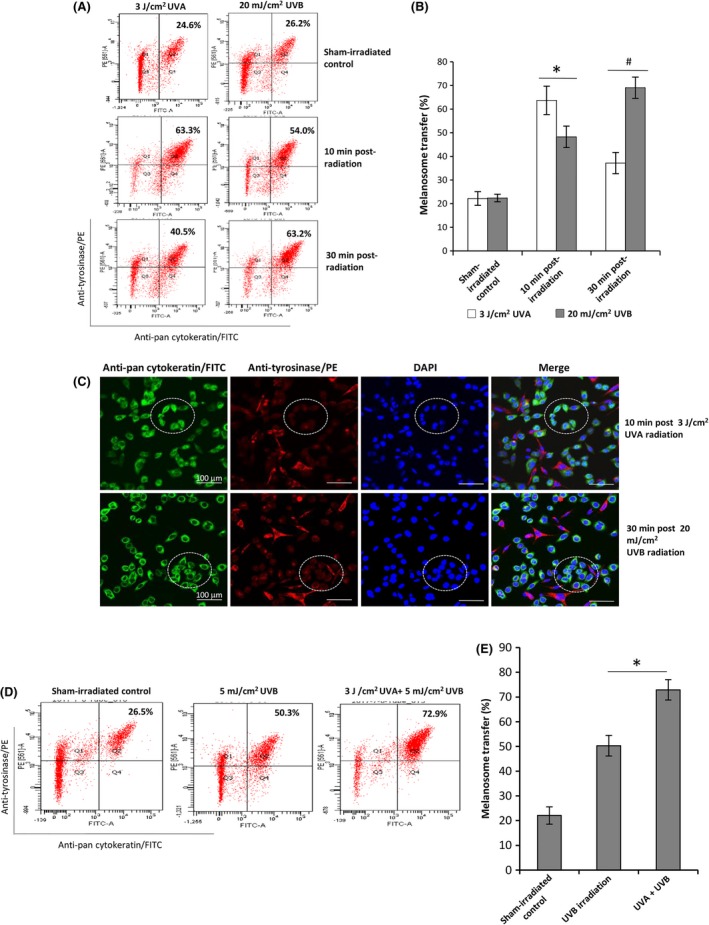
Induction of melanosome transfer in MC‐KC co‐culture by UVA or UVB. Co‐cultures of MCs and KCs at a ratio of 1:20 were established and then exposed to 3 J/cm2 UVA or 20 mJ/cm2 UVB irradiation (A‐C). The cell co‐culture plates wrapped with aluminium foil were used for sham‐irradiated control. After 10 or 30 min of post‐irradiation, the cells in co‐cultures were harvested for flow cytometry analyses, as described in the Figure 1. Meanwhile, the co‐cultured cells were exposed to 5 mJ/cm2 UVB or were sequentially exposed to 3 J/cm2 UVA and 5 mJ/cm2 UVB. After 30 min post‐irradiation, the cells were harvested for flow cytometry analysis. Representative fluorescence dot‐plots from flow cytometry analyses are shown in (A and D). Representative images of melanosome transfer are shown in the middle panel (C). The white circled areas in the images indicate melanosome uptake by KCs. Bar graphs (B and E) show the means ± SEM of melanosome transfer efficiency from three independent experiments. *P < .05, # P < .01
3.3. TRPM1‐related Ca2+ influx drives melanosome transfer following UVA or UVB exposure
TRPM1 (melastatin‐1) is found primarily in melanin‐producing cells and regulated by the microphthalmia‐associated transcription factor (MITF)15. First, we determined the mRNA levels of TRPM1 in MCs at various time‐points (0, 10, 30, 60 minute, 12 hour and 24 hour) after UV irradiation using qPCR technique (Figure 4A). TRPM1 transcript was up‐regulated at 10 minute following UVA irradiation. The significant up‐regulation of TRPM1 transcript in MCs was noted at 24 hour after both UVA and UVB irradiation. The Western blotting data also showed that the level of TRPM1 protein was increased in the mono‐ and co‐cultured melanocytes after UVA (3‐30 J/cm2) and UVB (5‐20 mJ/cm2) irradiation. In comparison with mono‐cultured cell model, co‐culture was much better than mono‐cell culture for inducing TRPM1 protein expression, especially in response to UVB (Figure 4B). Immunofluorescent staining indicated that an increased expression of TRPM1 was condensed in the tips of MC dendrites, especially after UVB radiation (Figure 4D). In addition, we also explored the potential mechanisms underlying the regulation of TRPM1‐related Ca2+ influx on melanosome transfer using a panel of tool compounds, such as calcium chelators13, a TRPM1 blocker (voriconazole)24, a G protein inhibitor (suramin) and a phospholipase C (PLC) antagonist (U73122).14 The intracellular and extracellular Ca2+ ions in MC‐KC co‐cultures were removed using treatment with 20 μM Bapta‐AM plus 2 μM thapsigargin and with 1.5 mM EGTA respectively.14 As expected, the efficiencies of melanosome transfer were markedly reduced in response to UVA or UVB (Figure 5). It was also evident that 100 μM voriconazole, a potent TRPM1 channel blocker, dramatically inhibited melanosome transfer in co‐cultures exposed to both types of UV radiation (Figure 6). Finally, we also examined the roles of G protein‐ and PLC‐mediated pathways in the regulation of melanosome transfer. The data showed that UV‐induced melanosome transfer was significantly suppressed by treatment with 50 μM suramin and by 9 μM U73122 (Figure 6).
Figure 4.
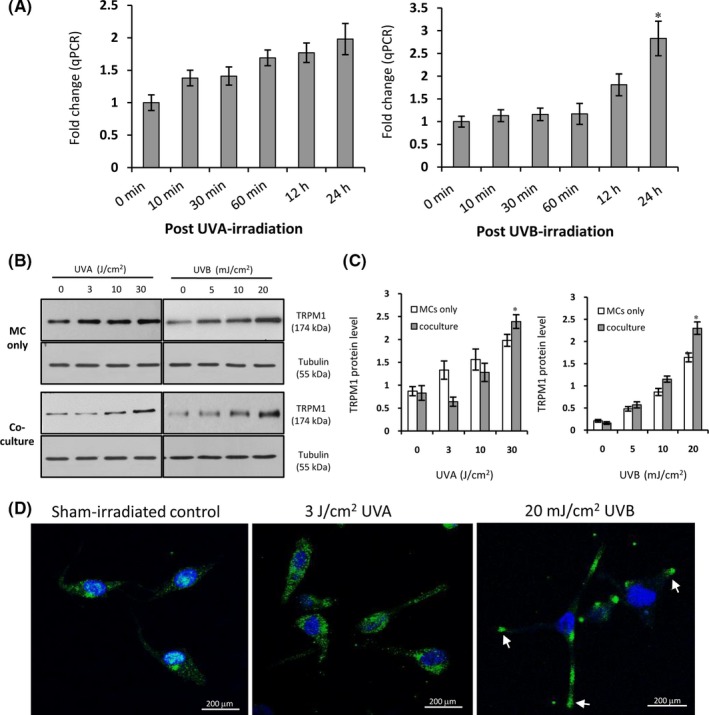
Expression profiles of TRPM1 in mono‐ and co‐cultured MCs in response to UVA or UVB. (A) Human primary MCs were seeded in six‐well plates, the cells were further exposed to UVA (3 J/cm2) or UVB (20 mJ/cm2). The total RNA was isolated from the exposed cells at various time‐points (0, 10, 30, 60 min; 12, 24 h) after UV irradiation. The qPCR was performed for measuring TRPM1 mRNA levels. The results were normalized to the house‐keeping gene ACTB. *P < .05. (2) The mono‐ and co‐cultured MCs were exposed to UVA (0, 3, 10, 30 J/cm2) or UVB (0, 5, 10, 20 mJ/cm2) radiation. The cells were harvested after 24 h post‐irradiation. Protein loading variation was determined by immunoblotting with an anti‐tubulin antibody. Representative blots are shown in (B). The histogram (C) shows the densitometric quantification of data with means ± SEM of three independent experiments. *P < .05. (D) MCs grown on coverslips were immunostained with an anti‐TRPM1 antibody, and the slides were counter‐stained with DAPI to identify nuclei (blue). Staining was observed using an Olympus FV1200 confocal fluorescence microscope. White arrows indicate the condensation of TRPM1 protein in the tips of the dendrites of MCs. Scale bar: 200 μm
Figure 5.
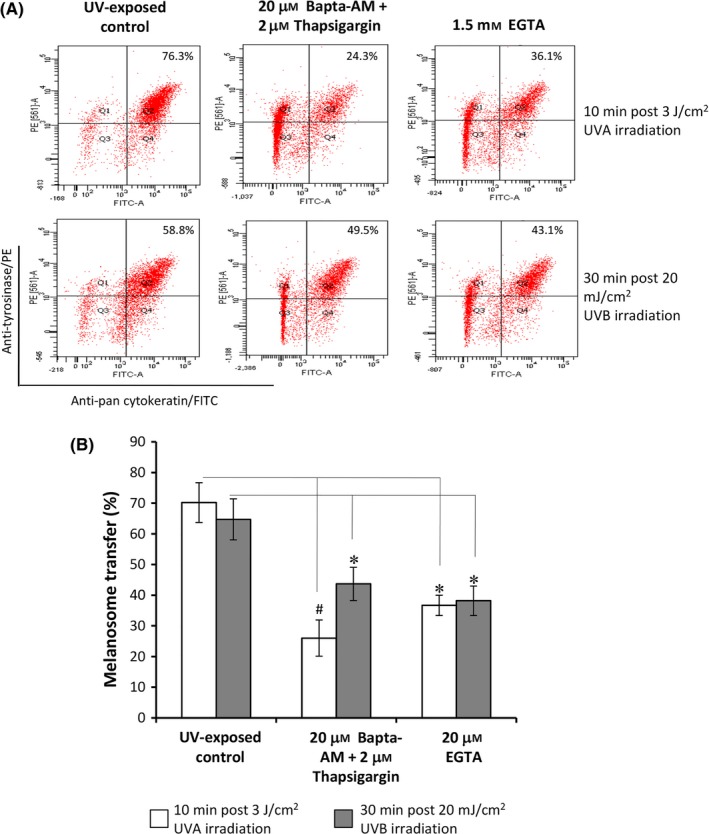
Effects of extracellular and intracellular Ca2+ on melanosome transfer. Co‐cultures of MCs and HaCaT KCs were established as described in the Figure 1. Cells in co‐culture were pre‐treated with 20 μM Bapta‐AM plus 2 μM thapsigargin or with 1.5 mM EGTA, respectively, to remove intracellular and extracellular Ca2+ ions, and then were exposed to 3 J/cm2 UVA or 20 mJ/cm2 UVB radiation. The cells exposed to UV radiation without chemical pre‐treatment were used for UV‐exposed control. After exposure, the cells in co‐culture were harvested at the indicated times post‐irradiation for flow cytometry analyses. Representative fluorescence dot‐plots from flow cytometry analyses are shown (A). The data (B) of melanosome transfer efficacy represent means ± SEM from three independent experiments. *P < .05, # P < .01
Figure 6.
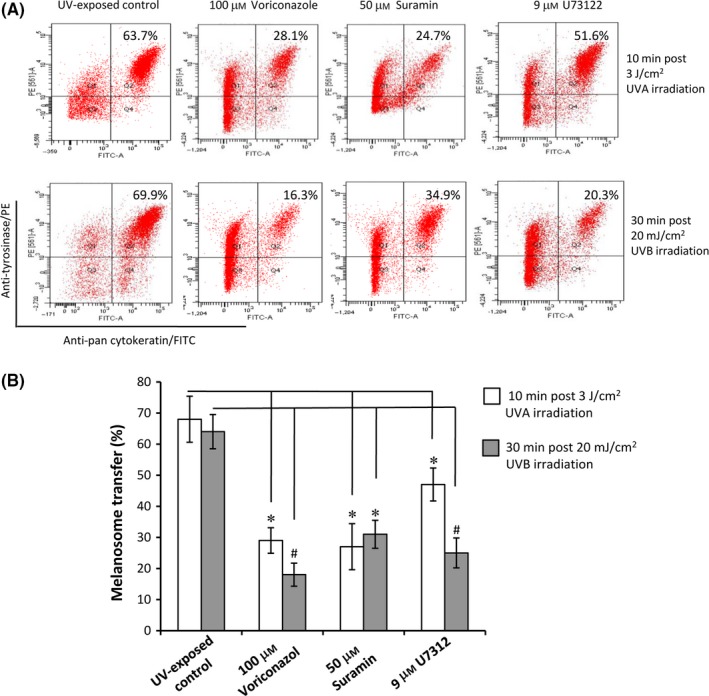
Effects of a TRPM1 blocker and relevant signal molecules on melanosome transfer. Co‐cultures of MCs and HaCaT KCs were established as described in the Figure 1. Cells in co‐culture were pre‐treated with 100 μM voriconazole (a TRPM1 blocker), 50 μM suramin (a G protein inhibitor) or 9 μM U73122 (a PLC antagonist). The cells exposed to UV radiation without chemical pre‐treatment were used for UV‐exposed control. After UVA or UVB irradiation, cells in co‐culture were harvested at the indicated times for flow cytometry analyses. Representative fluorescence dot‐plots from flow cytometry analyses are shown (A). The data (B) of melanosome transfer efficiency represent means ± SEM from three independent experiments. *P < .05, # P < .01
3.4. siRNA‐induced TRPM1 mRNA knockdown in co‐cultured MCs inhibits melanosome transfer following UVA or UVB exposure
Human MCs were transfected with TRPM1 siRNA for silencing TRPM1 mRNA expression, as shown in Figure 7A. The melanosome transfer was dramatically inhibited in TRPM1 siRNA‐transfected MCs co‐cultured with KCs as compared to the scramble control (Figure 7C). This result indicated that TRPM1 channel protein plays an important role in the process of melanosome transfer. Based on the observation that retinal is required for Ca2+ influx in UV‐exposed MCs,25 we examined the expression levels of OPN3 and OPN5, the members of light‐sensitive protein family,25, 26, 27 in mono‐ and co‐cultured MCs exposed to UVA or UVB radiation using Western blotting and immunofluorescent staining (Figure S1). The expression level of OPN5 seemed to increase a little more in a dose‐dependent manner in UVB‐exposed cells than in UVA‐exposed cells (Figure S1). The observed increase of OPN5 protein may partially explain the enhanced retinal‐dependent Ca2+ influxes contributing to drive melanosome transfer after UV radiation.
Figure 7.
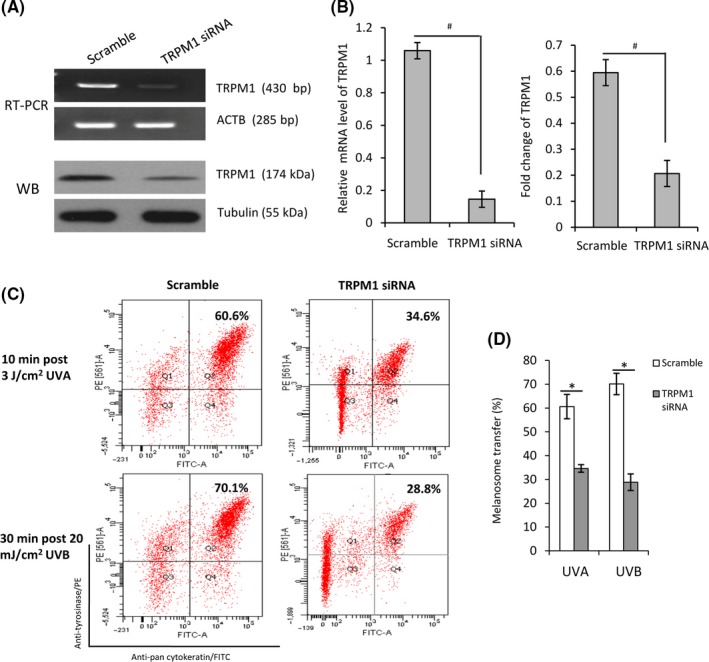
Effect of miRNA‐mediated TRPM1 knockdown on melanosome transfer. The MCs were transfected with TRPM1 siRNA and the scramble control for 48 h. Efficiency of TRPM1 knockdown by these siRNAs was tested using Western blotting and RT‐PCR respectively (A). The histogram (B) shows the densitometric quantification of data with means ± SEM of three independent experiments. TRPM1 siRNA‐transfected MCs were co‐cultured with KCs as described in Figure 1. The co‐cultured cells were further exposed to 3 J/cm2 UVA and 20 mJ/cm2 UVB. The cells were harvested at the indicated time after UV radiation for flow cytometry analysis. Representative fluorescence dot‐plots from flow cytometry analyses are shown in (C). The histogram (D) shows the means ± SEM of fluorescence intensities from three independent experiments. *P < .05, # P < .01
4. DISCUSSION
It has been known for decades that the transfer of melanosomes from MCs to neighbouring KCs and their subsequent distribution throughout the epidermis are especially critical to protect the skin from the deleterious effects of UVA and UVB radiation; however, the exact mechanism involved in the melanosome transfer process has yet to be clarified.28, 29, 30 Over the last few years, several lines of evidence suggest that two presumptive modes, shedding‐phagocytosis and melanocore exocytosis‐endocytosis, might be the dominant mechanism to operate intercellular melanosome transfer.29, 31 In this study, we used a simple flow cytometry‐based protocol to analyse the co‐cultured cells with the double‐positive immunolabelling using anti‐tyrosinase and anti‐pan cytokeratin antibodies, by which to estimate the melanosome transfer rate. It is worthy to be mentioned that this protocol we used is unable to score the transfer events that might have occurred by the melanocore exocytosis‐endocytosis mode, in which the remnants of tyrosinase‐positive melanosome membrane within recipient keratinocytes are possibly absent. Here we show for the first time that the induction of retinal‐dependent Ca2+ influx in MCs by UVA or UVB radiation contributes to the stimulation of melanosome transfer. In agreement with the previous observation of Wicks et al,14 all‐trans retinal is required to evoke such Ca2+ influx in MCs following UV exposure (Figure 2). We have also noted that the expression level of OPN5, a light‐sensitive protein that is bound to retinal chromophore to behave as a photo‐sensor via its trans‐to‐cis isomerization, is induced slightly more in UVB‐exposed MCs than in UVA‐exposed MCs, but no significant change of OPN3 was found in UV‐exposed or unexposed MCs (Figure S1). Although the role of these opsins has not yet concluded, these findings seem to be of considerable interest.
Our data indicate that the maximum Ca2+ influx in MCs is induced by UVA at 7.5 minute post‐exposure, whereas the peak induced by UVB is at 12.5 minute post‐exposure (Figure 2). These distinct response profiles of Ca2+ influx in MCs to UVA or UVB may provide a persistent impetus for driving melanosome transfer. A previous study using whole human genome microarray analyses indicated that only UVB can stimulate nascent melanin synthesis via the up‐regulation of various pigment‐related genes, such as tyrosinase, tyrosinase‐related protein 1 and dopachrome tautomerase, as well as MITF, but no such increase is elicited by UVA.13 Although the stimulation of melanosome transfer elicited by UVA is similar to that elicited by UVB (Figure 3), MCs are unable to provide the sufficient amount of newly synthesized melanosomes as UVA has little or no stimulating effect on melanogenesis, which may partially explain why the UVA tan contributes essentially no photoprotection against oxidative DNA damage.7 Importantly, the results from this study demonstrate that the blockage of TRPM1 channel using a putative antagonist, voriconazole (a triazole antifungal agent),32 significantly inhibits melanosome transfer in co‐cultures exposed to UVA or to UVB, possibly through the inhibition of TRPM1‐related Ca2+ influx (Figure 6). In the future, the controlled clinical studies to prove this assumption that TRPM1 blockers (such as voriconazole) act as a new skin lightening agent are warranted.
CONFLICT OF INTEREST
The authors declare that there is no conflict of interest regarding the publication of this paper.
AUTHORS’ CONTRIBUTIONS
Q.‐M Hu carried out all irradiations with UVA and UVB as well as FACS analysis for melanosome transfer. W.‐J Yi carried out immunofluorescent double‐staining. M.‐Y Su and S Jiang carried out Western blotting and primary cell culture. S.‐Z Xu discussed the results and commented on the manuscript. T.‐C Lei designed the studies, analysed the data and wrote the paper.
Supporting information
ACKNOWLEDGEMENTS
This work was supported by grants from the National Natural Science Foundation of China (NSFC Grants 81371717 and 81573028). We give special acknowledgement to Prof. Qingning Su (Bioengineering Research Center, Shenzhen University, Guangdong, China) for assistance in calcium imaging experiment. The authors also thank Dr. Vincent J. Hearing (DASS Manuscript, Haymarket, VA, USA) for valuable discussion and editing of the manuscript.
Hu Q‐M, Yi W‐J, Su M‐Y, Jiang S, Xu S‐Z, Lei T‐C. Induction of retinal‐dependent calcium influx in human melanocytes by UVA or UVB radiation contributes to the stimulation of melanosome transfer. Cell Prolif. 2017;50:e12372 10.1111/cpr.12372
REFERENCES
- 1. Cooper KL, Yager JW, Hudson LG. Melanocytes and keratinocytes have distinct and shared responses to ultraviolet radiation and arsenic. ToxicolLett. 2014;224:407‐415. [DOI] [PMC free article] [PubMed] [Google Scholar]
- 2. Brenner M, Hearing VJ. The protective role of melanin against UV damage in human skin. Photochem Photobiol. 2008;84:539‐549. [DOI] [PMC free article] [PubMed] [Google Scholar]
- 3. Seebode C, Lehmann J, Emmert S. Photocarcinogenesis and skin cancer prevention strategies. Anticancer Res. 2016;36:1371‐1378. [PubMed] [Google Scholar]
- 4. Marrot L, Meunier JR. Skin DNA photodamage and its biological consequences. J Am Acad Dermatol. 2008;58(5 Suppl. 2):S139‐S148. [DOI] [PubMed] [Google Scholar]
- 5. Chung H, Jung H, Lee JH, et al. Keratinocyte‐derived laminin‐332 protein promotes melanin synthesis via regulation of tyrosine uptake. JBiol Chem. 2014;289:21751‐21759. [DOI] [PMC free article] [PubMed] [Google Scholar]
- 6. Weiner L, Fu W, Chirico WJ, et al. Skin as a living coloring book: how epithelial cells create patterns of pigmentation. Pigment Cell Melanoma Res. 2014;27:1014‐1031. [DOI] [PMC free article] [PubMed] [Google Scholar]
- 7. Miyamura Y, Coelho SG, Schlenz K, et al. The deceptive nature of UVA tanning versus the modest protective effects of UVB tanning on human skin. Pigment Cell Melanoma Res. 2011;24:136‐147. [DOI] [PMC free article] [PubMed] [Google Scholar]
- 8. Noonan FP, Zaidi MR, Wolnicka‐Glubisz A, et al. Melanoma induction by ultraviolet A but not ultraviolet B radiation requires melanin pigment. Nat Commun. 2012;3:884. [DOI] [PMC free article] [PubMed] [Google Scholar]
- 9. Premi S, Wallisch S, Mano CM, et al. Photochemistry. Chemiexcitation of melanin derivatives induces DNA photoproducts long after UV exposure. Science. 2015;347:842‐847. [DOI] [PMC free article] [PubMed] [Google Scholar]
- 10. Coelho SG, Yin L, Smuda C, et al. Photobiological implications of melanin photoprotection after UVB‐induced tanning of human skin but not UVA‐induced tanning. Pigment Cell Melanoma Res. 2015;28:210‐216. [DOI] [PMC free article] [PubMed] [Google Scholar]
- 11. Maeda K, Hatao M. Involvement of photooxidation of melanogenic precursors in prolonged pigmentation induced by ultraviolet A. J Invest Dermatol. 2004;122:503‐509. [DOI] [PubMed] [Google Scholar]
- 12. Hönigsmann H. Erythema and pigmentation. Photodermatol Photoimmunol Photomed. 2002;18:75‐81. [DOI] [PubMed] [Google Scholar]
- 13. Choi W, Miyamura Y, Wolber R, et al. Regulation of human skin pigmentation in situ by repetitive UV exposure: molecular characterization of responses to UVA and/or UVB. J Invest Dermatol. 2010;130:1685‐1696. [DOI] [PMC free article] [PubMed] [Google Scholar]
- 14. Wicks NL, Chan JW, Najera JA, et al. UVA phototransduction drives early melanin synthesis in human melanocytes. Curr Biol. 2011;21:1906‐1911. [DOI] [PMC free article] [PubMed] [Google Scholar]
- 15. Oancea E, Vriens J, Brauchi S, et al. TRPM1 forms ion channels associated with melanin content in melanocytes. Sci Signal. 2009;2:ra21. [DOI] [PMC free article] [PubMed] [Google Scholar]
- 16. Devi S, Kedlaya R, Maddodi N, et al. Calcium homeostasis in human melanocytes: role of transient receptor potential melastatin 1 (TRPM1) and its regulation by ultraviolet light. Am J Physiol Cell Physiol. 2009;297:C679‐C687. [DOI] [PMC free article] [PubMed] [Google Scholar]
- 17. Yoshimura K, Tsukamoto K, Okazaki M, et al. Effects of all‐trans retinoic acid on melanogenesis in pigmented skin equivalents and monolayer culture of melanocytes. J Dermatol Sci. 2001;27(Suppl. 1):S68‐S75. [DOI] [PubMed] [Google Scholar]
- 18. Bellono NW, Najera JA, Oancea E. UV light activates a Gαq/11‐coupled phototransduction pathway in human melanocytes. J Gen Physiol. 2014;143:203‐214. [DOI] [PMC free article] [PubMed] [Google Scholar]
- 19. Lei TC, Virador VM, Vieira WD, et al. A melanocyte‐keratinocyte coculture model to assess regulators of pigmentation in vitro. Anal Biochem. 2002;305:260‐268. [DOI] [PubMed] [Google Scholar]
- 20. Ma HJ, Zhao G, Zi SX, et al. Efficacy of quantifying melanosome transfer with flow cytometry in a human melanocyte‐HaCaT keratinocyte co‐culture system in vitro. ExpDermatol. 2010;19:e282‐e285. [DOI] [PubMed] [Google Scholar]
- 21. Choi HR, Park SH, Choi JW, et al. A simple assay method for melanosome transfer. Ann Dermatol. 2012;24:90‐93. [DOI] [PMC free article] [PubMed] [Google Scholar]
- 22. Bhawan J, Whren K, Panova I, et al. Keratin 16 expression in epidermal melanocytes of normal human skin. Am J Dermatopathol. 2005;27:476‐481. [DOI] [PubMed] [Google Scholar]
- 23. Rollman O, Wood EJ, Olsson MJ, et al. Biosynthesis of 3,4‐didehydroretinol from retinol by human skin keratinocytes in culture. Biochem J. 1993;293:675‐682. [DOI] [PMC free article] [PubMed] [Google Scholar]
- 24. Xiong WH, Brown RL, Reed B, et al. Voriconazole, an antifungal triazol that causes visual side effects, is an inhibitor of TRPM1 and TRPM3 channels. Invest Ophthalmol Vis Sci. 2015;56:1367‐1373. [DOI] [PMC free article] [PubMed] [Google Scholar]
- 25. Haltaufderhyde K, Ozdeslik RN, Wicks NL, et al. Opsin expression in human epidermal skin. Photochem Photobiol. 2015;91:117‐123. [DOI] [PMC free article] [PubMed] [Google Scholar]
- 26. Jiao J, Hong S, Zhang J, et al. Opsin3 sensitizes hepatocellular carcinoma cells to 5‐fluorouracil treatment by regulating the apoptotic pathway. Cancer Lett. 2012;320:96‐103. [DOI] [PubMed] [Google Scholar]
- 27. Ambrosi CM, Entcheva E. Optogenetic control of cardiomyocytes via viral delivery. Methods Mol Biol. 2014;1181:215‐228. [DOI] [PMC free article] [PubMed] [Google Scholar]
- 28. Kondo T, Hearing VJ. Update on the regulation of mammalian melanocyte function and skin pigmentation. Expert Rev Dermatol. 2011;6:97‐108. [DOI] [PMC free article] [PubMed] [Google Scholar]
- 29. Ando H, Niki Y, Ito M, et al. Melanosomes are transferred from melanocytes to keratinocytes through the processes of packaging, release, uptake, and dispersion. J Invest Dermatol. 2012;132:1222‐1229. [DOI] [PubMed] [Google Scholar]
- 30. Scott G, Deng A, Rodriguez‐Burford C, et al. Protease‐activated receptor 2, a receptor involved in melanosome transfer, is upregulated in human skin by ultraviolet irradiation. J Invest Dermatol. 2001;117:1412‐1420. [DOI] [PubMed] [Google Scholar]
- 31. Wu X, Hammer JA. Melanosome transfer: it is best to give and receive. CurrOpin Cell Biol. 2014;29:1‐7. [DOI] [PMC free article] [PubMed] [Google Scholar]
- 32. Kinoshita J, Iwata N, Ohba M, et al. Mechanism of voriconazole‐induced transient visual disturbance: reversible dysfunction of retinal ON‐bipolar cells in monkeys. Invest Ophthalmol Vis Sci. 2011;52:5058‐5063. [DOI] [PubMed] [Google Scholar]
Associated Data
This section collects any data citations, data availability statements, or supplementary materials included in this article.
Supplementary Materials