

SUMMARY
Mutation is the ultimate genetic source of evolution and biodiversity, but to what extent the environment impacts mutation rate and spectrum is poorly understood. Past studies discovered mutagenesis induced by antibiotic treatment or starvation, but its relevance and importance to long-term evolution is unclear because these severe stressors typically halt cell growth and/or cause substantial cell deaths. Here we quantify the mutation rate and spectrum in Saccharomyces cerevisiae by whole-genome sequencing following mutation accumulation in each of seven environments with relatively rapid cell growths and minimal cell deaths. We find the point mutation rate per generation to differ by 3.6-fold among the seven environments, generally increasing in environments with slower cell growths. This trend renders the mutation rate per year more constant than that per generation across environments, which has implications for neutral evolution and the molecular clock. Additionally, we find substantial among-environment variations in mutation spectrum such as the transition/transversion ratio and AT mutational bias. Other main mutation types including small insertion/deletion, segmental duplication/deletion, and chromosome gain/loss also tend to occur more frequently in environments where yeast grows more slowly. In contrast to these findings from the nuclear genome, the yeast mitochondrial mutation rate rises with the growth rate, consistent with the metabolic rate hypothesis. Together, these observations indicate that, environmental changes, which are ubiquitous in nature, influence not only natural selection but also the amount and type of mutations available to selection, and suggest that ignoring the latter impact as is currently practiced may mislead evolutionary inferences.
Keywords: fitness, genome sequencing, molecular clock, mutation accumulation, mutational bias, transition/transversion ratio
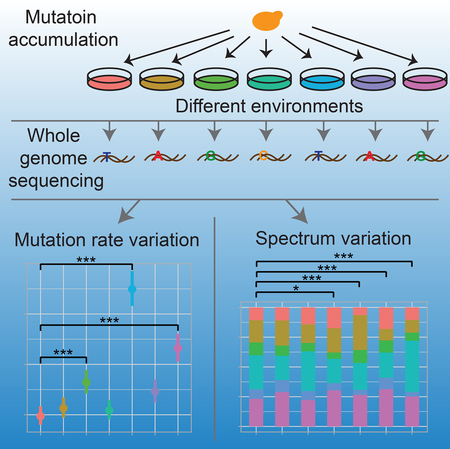
Graphical Abstract
Using whole-genome sequencing following mutation accumulation in each of seven media, Liu and Zhang report that yeast mutation rate and spectrum vary substantially even among different benign environments, which has important implications for both neutral and adaptive evolution.
INTRODUCTION
The classical evolutionary theory asserts that the rate of mutation occurring in an organism is independent of the environment of the organism [1, 2], a view that has been challenged by the observation of stress-induced mutagenesis (SIM) [3–5]. Specifically, it was discovered that the mutation rate in bacteria tends to rise when they are under antibiotic treatment, starvation, or other stresses [3]. A similar trend has also been reported from limited studies of eukaryotes [6–8]. While the molecular mechanisms of SIM are not fully understood, bacterial studies showed that they often involve the SOS response including the upregulation of error-prone DNA polymerases that leads to elevated mutagenesis [3, 9]. It is currently debated whether SIM is a consequence of relaxed selection for the accuracy of rarely used DNA polymerases, a pleiotropic byproduct of selection for increased stress tolerance, and/or a direct outcome of second-order selection for evolvability [10, 11]. Regardless, SIM may accelerate organismal adaptations to stressful environments [12–14] and hence has been of substantial interest to evolutionary biologists [15–18].
Notwithstanding, previous studies of SIM were typically conducted in environments that were so stressful that a substantial fraction of cells were killed and/or population growth was largely halted [3, 14, 19]. Conclusions drawn from such experiments have two caveats. First, mutation rates are likely overestimated in the presence of substantial cell death, because cell death increases the number of cell divisions needed to bring the population to the observed size, which renders the mutation rate per generation overestimated when this factor is ignored [20]. Indeed, a recent study showed that accounting for cell death either removes or greatly reduces the purported mutagenic effect of antibiotic treatment [20]. Second, the stress severity required to induce mutagenesis is unclear. If SIM occurs only under rare, severe stresses, its impact on long-term evolution would be limited. However, because the environment of virtually no species is constant for a long time, if the mutation rate of an organism varies to a sizeable extent even among different, benign environments, the evolutionary impact of the phenomenon would be much broader and a number of evolutionary theories or models that rely on the assumption of a constant mutation rate (e.g., the explanation of the molecular clock phenomenon) would require major revisions.
In addition to the impact on mutation rate, recent studies revealed varied impacts of different severe stresses on mutation spectrum. For instance, in six different nutrient starvations that all reduced the Escherichia coli growth rate by over 20 times, the mutation spectrum was found to vary substantially [19]. Nonetheless, this result was based on one to four reporter genes and its genomic generality remains unknown. It is also unknown how stressful the environment needs to be to induce such mutation spectrum changes and how widespread this phenomenon is, especially among eukaryotes.
To assess the impact of mild environmental changes on genome-wide mutation rate and spectrum, we performed mutation accumulation (MA) experiments in the unicellular eukaryotic model organism Saccharomyces cerevisiae in each of seven different environments where cell death is minimal and the population growth rate is >50% of that in the optimal condition. We then applied whole-genome sequencing (WGS) of MA lines to detect mutations. Our results show that the yeast mutation spectrum varies substantially among these environments and that the mutation rate is generally higher in environments where the growth is slower.
RESULTS
Growth rate declines faster during MA in environments where the initial growth is slower
We performed MA experiments in the diploid BY4743 strain of S. cerevisiae because diploids accumulate more mutations than haploids per generation [21] and because yeast is mostly in the diploid form in nature. Seven environments were used, including the nutrition rich yeast-extract-peptone-dextrose (YPD) medium that supports optimal growth of the BY4743 strain in lab. To introduce mild stressors, we switched the sugar source, switched the nitrogen source, or added various inorganic salts in YPD, resulting in the following six additional media: yeast-extract-peptone-xylose (YPX), yeast-extract-peptone-lactose (YPL), yeast-nitrogen-base-dextrose (YNB), YPD with 6 mM CuSO4, YPD with 100 mM LiCl, and YPD with 1 M NaCl (Table S1). Yeast growth rate and cell viability were respectively quantified in these seven media. Population growth rate per hour, a fitness proxy, varies significantly in the seven media (P < 10−4, ANOVA), although even the lowest rate is higher than 50% of the highest rate (blue bars in Figure 1A). Cell viability is uniformly high (P = 0.077, ANOVA) and is comparable to that in YPD (Figure 1B). There is no significant correlation between yeast growth rate and cell viability in these environments (Spearman’s ρ = −0.54, P = 0.24).
Figure 1. Growth rate and cell viability of yeast mutation accumulation (MA) lines in seven relatively benign environments.

(A) Population growth per hour before (blue) and after (red) MA in each environment. The data are presented as a bar plot for each bin. The lower and upper edges of a box represent the first (qu1) and third quartiles (qu3), respectively, while the horizontal line inside the box indicates the median (md). The whiskers extend to the most extreme values inside inner fences, md±1.5(qu3- qu1), and the dots represent values outside the inner fences (outliers).
(B) Cell viability in each environment, relative to that in YPD. Error bars represent the standard deviation. In panels (A) and (B), the six non-YPD environments are ordered from high to low growth rates on the X-axis.
(C) Negative correlation between the speed of growth rate decline in MA and the initial growth rate across environments. The speed of growth rate decline in MA is (growth rate before MA – growth rate after MA)/number of cell divisions. Because of the use of the growth rate before MA in both variables of the X- and Y-axes, the actual correlation could be even more negative than what is observed here. Spearman’s ρ and Pearson’s r are shown in the figure with corresponding P values.
See also Table S1.
A total of 168 parallel MA lines were established from the same ancestor, with 24 lines in each medium. MA was achieved by regular single-cell bottlenecks, known to minimize the influence of selection on spontaneous mutations [22]. To keep the number of cell divisions between bottlenecks roughly the same across media, single-cell bottlenecks were enforced every 24, 36, or 48 hours depending on the medium for a total of ~1000 cell divisions in each medium (Table S1). Two lines died out in the MA experiment probably due to lethal mutations, resulting in a total of 166 lines at the conclusion of the experiment. As expected, growth rate generally declined after MA (red bars in Figure 1A). The speed with which the growth rate declined per generation tends to be higher in the media where the initial growth rate before MA is lower (Figure 1C), hinting the possibility that the mutation rate per generation is higher in environments where cells grow more slowly.
Rates of all four main mutation types vary among environments
To identify the mutations that accrued in each MA line, we applied Illumina WGS on the ancestor (202× sequence coverage) as well as all 166 MA lines (average 95× coverage). In total, 1415 single nucleotide variations (SNVs), 259 small insertions/deletions (indels) shorter than 60 nucleotides, 18 segmental duplications/deletions longer than 1 kb, and 33 whole-chromosome gains/losses were identified (Table S2 and Data S1). Sanger sequencing confirmed all of the 18 randomly picked SNV and small indel mutations tested (Table S3; see STAR Methods). Two SNV-based parameters are commonly used to confirm the ineffectiveness of selection in MA experiments. First, 74% of SNVs in the yeast genome are expected to occur in genic regions if mutations are not subject to selection [21]. Indeed, the observed fraction does not deviate significantly from the expected value in any of the seven environments (all P > 0.2, binomial test followed by multiple testing correction; Figure S1A). Second, the expected fraction of nonsynonymous SNVs in yeast coding regions is 76% when coding mutations are not selected [21]. Again, no significant deviation from the above expectation is observed in any of the seven environments (all P > 0.1; Figure S1B). There is also no significant among-environment variation in the proportion of SNVs that are genic or the proportion of coding SNVs that are nonsynonymous (both P > 0.05, chi-squared test). These observations confirm that all mutations are effectively neutral during MA in any of the seven environments.
We found that all four main mutation types exhibit significant rate variations among the seven environments (P < 10−4 for each type; ANOVA). Specifically, the rate of SNV in YPD is 1.95×10⁻¹⁰ (95% CI: 1.60–2.34×10⁻¹⁰) per nucleotide per cell division, consistent with a previous estimate in yeast (1.67×10⁻¹⁰) [23] but significantly lower than another (2.89×10⁻¹⁰) [21], possibly due to the use of a different yeast strain in the latter study. The SNV rate varies by 3.57 times from 1.95×10⁻¹⁰ in YPD to 6.97×10⁻¹⁰ in LiCl (Figure 2A). In three (YNB, LiCl, and NaCl) of the six environments, the SNV rate is significantly greater than that in YPD (P < 10−4, Wilcoxon rank-sum test followed by Bonferroni correction for multiple testing; Figure 2A).
Figure 2. Rates of (A) SNV, (B) small indel, (C) segmental duplication/deletion, and (D) whole-chromosome gain/loss mutations differ in the seven environments.

The SNV rate is measured by the number of mutations per nucleotide per cell division, the small indel rate is measured by the number of mutations per nucleotide per cell division, the segmental duplication/deletion rate is measured by the number of mutations per cell division, and the whole-chromosome gain/loss rate is measured by the number of mutations per cell division. Error bars represent 95% confidence intervals predicted from the Poisson distribution of the number of mutations. Mutation rate variation among the seven environments is significant in each panel (P < 10−4, ANOVA). Difference in mutation rate between a medium and YPD is assessed by a Wilcoxon rank-sum test followed by Bonferroni correction for multiple testing (*, P < 0.05; **, P < 0.01; ***, P < 0.001). In all panels, the six non-YPD environments are ordered from high to low growth rates on the X-axis. See also Figure S1, Tables S2–S3, and Data S1.
The small indel rate ranges from 0.19×10⁻¹⁰ (in YPD) to 1.58×10⁻¹⁰ (in NaCl) per site per cell division in the seven environments, again showing the lowest value in YPD. Two environments (LiCl and NaCl) exhibited a significantly higher rate than that in YPD (P < 10−4, Wilcoxon rank-sum test followed by Bonferroni correction; Figure 2B). Furthermore, the insertion to deletion ratio differs among the environments (P < 0.0002, chi-squared test). This ratio is significantly higher than 1 in two environments (P < 10−4 in NaCl and P = 0.0018 in LiCl, binomial test), but is not significantly different from 1 in the other five environments tested separately or together (all P > 0.1, binomial test).
In addition to small-scale mutations, we identified two types of large-scale mutations based on changes in sequence coverage. There were 18 segmental duplications/deletions longer than 1 kb, including 17 mutations in LiCl and 1 mutation in YPD (Figure 2C). These mutations affected more nucleotides per event in LiCl (48–562 kb) than in YPD (4 kb). Furthermore, 16 whole-chromosome gains and 17 whole-chromosome losses were found, mostly in LiCl (18) and NaCl (8) (Figure 2D). There is no significant correlation between chromosome length and the rate of chromosome gain/loss (Pearson’s r = −0.46, P = 0.073). There is also no evidence that growth rate, SNV rate, or small indel rate differ between the MA lines with and without large-scale mutations in the same environment (all P > 0.05, Wilcoxon rank-sum test).
Mutation rates are higher in environments with lower initial growth rates
We found significant, negative correlations between the SNV rate, small indel rate, and whole-chromosome gain/loss rate in an environment and the initial yeast growth rate in the environment (Spearman’s ρ = −0.45, P < 10−4 for SNV; ρ = −0.41, P < 10−4 for small indel; ρ = −0.23, P = 2.8×10⁻³ for whole-chromosome gain/loss; Figure 3 and Table S4; see STAR Methods). The corresponding correlation is negative but not significant for the segmental duplication/deletion rate (ρ = −0.085, P = 0.28; Figure 3C). These results suggest that both small- and large-scale mutations occur more frequently in environments where yeast grows more slowly.
Figure 3. Correlation between initial growth rate and (A) SNV, (B) small indel, (C) segmental duplication/deletion, and (D) whole-chromosome gain/loss mutation rates across the seven environments.

Mutation rate units are the same as in Fig. 2. Each colored point represents the mean from all MA lines in the corresponding environment, whereas the horizontal and vertical error bars represent standard deviations of the growth rate and mutation rate among MA lines, respectively. The dashed line represents linear fitting on all 166 MA lines, while the grey shaded region shows the standard error predicted by the linear fitting. Spearman’s ρ and Pearson’s r and their associated P-values are based on all 166 MA lines. See also Figure S2 and Tables S4–S5.
For the SNV data, which contained the highest number of mutational events, we also fitted a linear model in which the mutational rate of an MA line is the dependent variable whereas the growth rate of the strain before MA is the independent variable. As expected, the effect of the growth rate on the mutation rate is significantly negative (P < 10−4). When we extended the model by adding a fixed categorical effect from each environment and an effect of interaction between environment and growth rate, the additional effects were not found to be significant (P > 0.3).
The most pronounced mutation rate elevations are observed in the LiCl and NaCl media. Nevertheless, even after the removal of the data from these two environments, the negative correlation between SNV rate and initial growth rate holds (ρ = −0.19, P = 0.035). But the corresponding correlation is no longer significant for any of the other three mutation types (all P > 0.1), likely because of the much reduced sample size.
The SNV mutation spectrum varies among the environments
There are six types of SNV, and their proportions vary significantly among the seven environments (P < 10−4, chi-squared test; Figure 4A). When compared with YPD, four environments (YPX, LiCl, YPL, and NaCl) show significantly different SNV spectrums (all P < 0.05 after Bonferroni correction; Figure 4A).
Figure 4. SNV mutation spectrums in the seven environments.

Mutation spectrum variation among the seven environments is significant in each panel (P < 10−3, chi-squared test). Differences in mutation spectrum, Ts/Tv ratio, or GC-to-AT/AT-to-GC ratio between a medium and YPD is assessed by a chi-squared test followed by Bonferroni correction for multiple testing (*, P < 0.05; **, P < 0.01; ***, P < 0.001). In all panels, the six non-YPD environments are ordered from high to low growth rates on the X-axis.
(A) Proportions of the six types of single nucleotide variation.
(B) The transition/transversion ratio (Ts/Tv).
(C) The ratio of the number of GC-to-AT mutations to that of AT-to-GC mutations.
The number of transitional mutations (i.e., between C and T and between G and A) relative to that of transversional mutations (i.e., all other mutations), or Ts/Tv, should be 0.5 under no mutational bias. But Ts/Tv is often greater than 0.5 or even 1 because transitions occur with a higher probability than transversions. Surprisingly, Ts/Tv varies among the seven environments examined (P < 10−4, chi-squared test; Figure 4B). Ts/Tv significantly exceeds 0.5 in three environments (CuSO4, YPX, and LiCl, all P < 0.001, binomial test followed by multiple testing correction) but is not significantly different from 0.5 in the other four environments (Figure 4B). Compared with that in YPD, Ts/Tv is significantly higher in LiCl (P < 10−4, chi-squared test followed by multiple testing correction; Figure 4B) but not significantly different in the other five environments.
Previous studies revealed a universal GC-to-AT mutational bias across divergent evolutionary lineages [24–26]. Although this bias is evident in all seven environments, the extent of the bias varies significantly among the environments (P = 3.5×10⁻⁴, chi-squared test). The number of GC-to-AT mutations, relative to the number of AT-to-GC mutations, ranges from 1.34 in YPX to 3.22 in NaCl (Figure 4C). Compared with that in YPD, the GC-to-AT/AT-to-GC mutation ratio is significantly higher in NaCl (P = 2.2×10⁻⁴, chi-squared test followed by multiple testing correction; Figure 4C) but not significantly different in the other five environments.
Expressions of error-prone DNA polymerases
As mentioned, SIM in E. coli has been shown to involve the upregulation of three error-prone DNA polymerases [9, 27]. To examine if the mutation rate variation revealed here in yeast is similarly attributable to the actions of error-prone DNA polymerases, we used quantitative reverse transcription polymerase chain reaction (RT-qPCR) to quantify the mRNA concentrations of six DNA polymerases, including three essential polymerases (POL1, POL2, and POL3), two error-prone polymerases (RAD30 and REV3), and one polymerase involved in double-strand break (DSB) repair (POL4). Under the premise that the mutation rate should rise with the amount of DNA replication catalyzed by error-prone polymerases relative to that catalyzed by essential polymerases, we measured the expression level of each nonessential polymerase by its mRNA level relative to the total mRNA level of the three essential polymerases. We found that each of the three nonessential polymerases has a significant among-environment expression variation (P < 10−4, ANOVA; Figure 5). Each of RAD30, REV3, and POL4 is significantly upregulated in one or two environments relative to the expression in YPD (Figure 5). But no significant Spearman’s or Pearson’s correlation was found between the expression level of any of these three nonessential polymerases and the mutation rate (SNV mutation rate, small indel mutation rate, or their sum) (P > 0.3). Compared with the clear correlation between the expression levels of error-prone DNA polymerases and the mutation rate found in E. coli under various concentrations of an antibiotic [14], our results do not provide sufficient evidence for the involvement of error-prone polymerases in the among-environment mutation rate variation in yeast.
Figure 5. The mRNA expression levels of the DSB-repair DNA polymerase POL4 and the error-prone DNA polymerases RAD30 and REV3, relative to the total expression level of the three essential DNA polymerases POL1, POL2 and POL3 in the seven environments.

Note that the expression levels are relative to those in YPD. The bar color represents the SNV mutation rate in the environment and the error bar represents the standard deviation. Difference in expression level between an environment and YPD is assessed by a t-test followed by Bonferroni correction for multiple testing (*, P < 0.05; **, P < 0.01). The six non-YPD environments are ordered from high to low growth rates on the X-axis.
Among-environment variation of the mitochondrial mutation rate supports the metabolic rate hypothesis
In many eukaryotes, the mutation rate in mitochondrial DNA is higher than that in nuclear DNA [28]. We identified 32 SNV and 70 indel mitochondrial mutations in the 166 MA lines (Table S2), yielding a mutation rate of 2.2×10⁻⁹ per site per cell division for SNV mutations and 4.9×10⁻⁹ per site per cell division for indel mutations, respectively. Both of these values are higher than the corresponding values in nuclear DNA (both P < 0.001, t-test). This elevated mitochondrial mutation rate is thought to be caused at least in part by the oxidative radicals generated in mitochondria [29], the amount of which presumably rises with the metabolic rate. Hence, it has been hypothesized that the mutation rate in mitochondria should correlate with the metabolic rate [30]. Using growth rate as a proxy for the metabolic rate, we here test this hypothesis. We found that both the mitochondrial SNV and indel mutation rates are positively correlated with the growth rate among the seven environments (ρ = 0.31, P < 10−4 for SNV, Figure 6A; ρ = 0.31, P < 10−4 for indel, Figure 6B). These results are consistent with the metabolic rate hypothesis on mitochondrial mutation rate, and are in stark contrast to the observation on nuclear mutation rate (Figure 3). Mitochondrial SNV mutations accumulated in our experiment were too few (Table S2) to allow studying the potential environmental impact on their spectrum.
Figure 6. Mitochondrial (MT) DNA mutation rate variation in the seven environments.

Error bars represent standard deviations. The dashed line represents a linear fitting on all 166 MA lines, while the grey shaded region shows the standard error from the linear fitting. Spearman’s ρ, Pearson’s r, and associated P-values based on all 166 MA lines are shown. Error bars represent standard deviations. The dashed line represents a linear fitting on all 166 MA lines, while the grey shaded region shows the standard error from the linear fitting. Spearman’s ρ, Pearson’s r, and associated P-values based on all 166 MA lines are shown.
(A) MT SNV rate per site per cell division.
(B) MT small indel rate per site per cell division.
DISCUSSION
By mutation accumulation in seven relatively benign environments followed by whole-genome sequencing, we discovered that yeast spontaneous mutation rate varies with the environment. For the mitochondrial DNA, the mutation rate is higher in environments where yeast grows faster, supporting the metabolic rate hypothesis of mitochondrial mutagenesis. For the nuclear DNA, the opposite trend is true. Below we focus on the nuclear DNA.
The among-environment fold-change in SNV mutation rate observed here (3.6-fold) is comparable to that in E. coli when the concentration of the antibiotic norfloxacin rises from 0 to 62.5 ng/ml, corresponding to cell viability decreasing from 100% to 5% [14], or that in E. coli upon nutrient (e.g., Fe, O, or N) starvation that slows the population growth to 5% of the normal rate [19]. The same can be said for small indels. Chromosome gains/losses do not exist in E. coli and large duplications/deletions in E. coli are primarily caused by a different mechanism (transposon activities), so they are not compared with the present yeast data. Thus, our data suggest that even relatively benign environmental changes influence the yeast mutation rate substantially.
To explore the mechanism behind the yeast mutation rate variation among different benign environments, we measured the expression levels of various DNA polymerases including error-prone polymerases. Although the expression levels of the error-prone polymerases RAD30 and REV3 and DSB-repair polymerase POL4 are found to vary significantly among the seven environments, we did not detect a significant correlation between their expression levels and mutation rates. While this negative result does not establish a role of these DNA polymerases in the observed mutation rate variation among environments, it cannot exclude this role either due to the limited statistical power as a result of the relatively small number of environments examined here. Nevertheless, we note that the expression variations of error-prone DNA polymerases among the seven environments studied here are much smaller than that previously observed in E. coli under different norfloxacin concentrations [14] (<50% difference in our study vs. ~400% difference in E. coli), despite that the mutation rate variations detected in the two studies are comparable. Future MA studies of more environments that are relatively benign, especially in mutants lacking error-prone DNA polymerases, may help clarify the role of these polymerases.
One potential explanation of the negative correlation between the yeast growth rate and mutation rate per generation is time-dependent (but replication-independent) mutagenesis. However, the correlation between the growth rate and mutation rate per year is still significantly negative (r = −0.169, P = 0.029 for SNVs; r = −0.318, P < 10−4 for small indels; r = −0.219, P = 0.0045 for chromosome gains/losses; and r = −0.159, P = 0.041 for segmental duplications/deletions). Time-dependent mutations mainly originate from unrepaired DNA lesions [31]. The number of time-dependent mutations per year should be higher in rapidly dividing cells, because slowly dividing cells have more time to repair lesions before cell division [31]. Our result is inconsistent with this prediction so is unlikely explained even partially by time-dependent mutations.
It was reported that reducing E. coli population density in liquid medium increases its mutation rate by threefold [32]. The same trend was also found in yeast [33]. Although the underlying mechanism of the negative correlation between population density and mutation rate has not been fully worked out, one wonders whether this correlation explains our observation of the among-environment mutation rate variation. To this end, we reanalyzed Krašovec et al.’s three yeast datasets that included the information of both population density and growth rate [33]. We found that the correlation between growth rate and mutation rate is more negative than that between population density and mutation rate (Figure S2). Furthermore, the partial correlation between growth rate and mutation rate after the control of population density remains negative in all three datasets and is significant in two of the datasets (Table S5). By contrast, the partial correlation between population density and mutation rate upon the control of growth rate becomes positive in all three datasets (Table S5). Thus, it appears that the negative correlation between population density and mutation rate can be explained by the negative correlation between growth rate and mutation rate, not the other way around.
Our finding of the environment dependency of mutagenesis, especially the negative correlation between growth rate (i.e., fitness) and mutation rate, has several implications for evolution. First, increased mutagenesis in stressful environments can accelerate organismal adaptations due to a heightened rate of appearance of beneficial mutations, as has been extensively discussed [15–18]. Our results suggest that this help from increased mutagenesis not only occurs under severe stresses but also in relatively benign but suboptimal environments, which presumably are frequently encountered by most organisms. Although the evolutionary origin of the negative correlation between fitness and mutation rate is debated [11], the result of the negative correlation is that environmental adaptations may be commonly facilitated by increased mutagenesis. Second, our results imply that the neutral mutation rate also varies among environments. Thus, in contrast to the canonical neutral model [34], environmental changes impact neutral evolution including the neutral substitution rate and spectrum. Third, our finding that mutation rate per generation decreases with the growth rate means that mutation rate per generation increases with the generation time, which could render the mutation rate per year less variable than that per generation among different environments. Indeed, the yeast mutation rate per year varies by 2.6 fold among the seven environments for SNVs, 5.0 fold for small indels, 25.7 fold for segmental duplications/deletions, and 25.3 fold for chromosome gains/losses (the lowest number of segmental duplications/deletions and chromosome gains/losses in an environment is set to be 0.5 if it is 0 to allow the computation of fold changes), all smaller than the corresponding variations per generation (3.6 fold for SNVs, 8.4 fold for small indels, 36.2 fold for segmental duplications/deletions, and 35.6 fold for chromosome gains/losses), although the among-environment variations in mutation rate per year remain significant (all P < 0.01, ANOVA). It will be interesting to study whether and to what extent the negative correlation between mutation rate per generation and growth rate, in conjunction with the nearly neutral theory [35, 36], helps explain the molecular clock phenomenon, which describes the approximate constancy of substitution rate per year instead of per generation in a given protein across evolutionary lineages [37].
Analogous to our finding that, for the same genotype considered, mutation rate in an environment tends to reduce with the fitness of the genotype in the environment, it has been reported in fruit flies that, in the same environment, the mutation rate of a genotype tends to decrease with the fitness of the genotype [38, 39]. In both phenomena, mutation rate reduces with the fitness, but it is unclear whether they have the same underlying mechanism and how this mechanism, whatever it is, is able to associate the mutation rate with fitness. More studies are needed to answer this fundamental question.
That the genome-wide mutation spectrum also varies among different benign environments is surprising. Because natural selection is often inferred by comparing the mutation spectrum, natural polymorphisms, and substitutions [26, 40, 41], our results suggest that, due to inevitable environmental changes in evolution, such inferences are likely less reliable than is currently thought. For instance, it becomes uncertain whether one can infer the action of natural selection on the basis of disparities between genomic features (e.g., nucleotide frequencies) observed and those expected from the mutation spectrum revealed by a laboratory MA experiment [26], because the condition used in an MA experiment cannot possibly represent fully the varying environment of a species. In addition, comparing mutation spectrums among species on the basis of MA followed by WGS becomes less meaningful if the environments used in the lab are different in the MA experiments of different species or do not represent their respective native environments.
In conclusion, our finding that yeast genome-wide mutation rate and spectrum vary among even relatively benign environments suggests that the environment not only affects natural selection but also the amount and type of genetic variations available to the selection. The natural environment of almost any species varies in many aspects, but the conditions examined here varied only in carbon source, nitrogen source, and inorganic salts. In the future, one should investigate additional common environmental variables such as the ambient temperature, which has already been suggested to impact mutagenesis [42, 43]. It will also be important to confirm our findings in other species and study to what extent the environment-dependency of mutagenesis impacts adaptations as well as neutral evolution.
STAR METHODS
CONTACT FOR REAGENT AND RESOURCE SHARING
Further information and requests for resources and reagents should be directed to and will be fulfilled by the Lead Contact, Jianzhi Zhang (jianzhi@umich.edu).
EXPERIMENTAL MODEL AND SUBJECT DETAILS
The strain used in this study is S. cerevisiae BY4743. The cells were propagated at 30°C in seven different solid media (Table 1) with detailed methods described below.
KEY RESOURCES TABLE
| REAGENT or RESOURCE | SOURCE | IDENTIFIER |
|---|---|---|
| Chemicals, Peptides, and Recombinant Proteins | ||
| Sodium Chloride | Fisher BioReagents | BP358–212 |
| Peptone | Fisher BioReagents | BP1420–2 |
| Yeast Extract | Fisher BioReagents | BP1422–500 |
| Agar | Fisher BioReagents | BP1423–500 |
| Yeast nitrogen base without amino acids and ammonium sulfate | Sigma | Y1251–1KG |
| D-Glucose | Fisher Chemical | D16–3 |
| Ammonium Sulfate | Fisher BioReagents | BP212R-1 |
| Lithium Chloride | Growcells | MRGF-1336 |
| Copper sulfate | Sigma | C1297–100G |
| Lactose Monohydrate | Fisher Chemical | L5–500 |
| D-(+)-Xylose | Sigma | X1500–500G |
| Critical Commercial Assays | ||
| RNeasy Mini Kit | QIAGEN | 74106 |
| MaterPure Yeast DNA Purification Kit | Lucigen | MPY80200 |
| SuperScript III First-Strand Synthesis System | Invitrogen | 18080051 |
| Power SYBR Green PCR Master Mix | Applied Biosystems | 4367659 |
| Q5 High-Fidelity 2X Mater Mix | New England BioLabs | M0492L |
| Nextera DNA Flex Library Prep | Illumina | 20018705 |
| Nextera DNA CD Indexes | Illumina | 20018708 |
| Deposited Data | ||
| List of all mutations identified in this study | This paper | Data S1 |
| Experimental Models: Organisms/Strains | ||
| S. cerevisiae: BY4743 | National Collection of Yeast Cultures | https://www.ncyc.co.uk/ |
| Oligonucleotides | ||
| PCR primers used for mutation verification | This paper | Table S3 |
| Software and Algorithms | ||
| Burrows-Wheeler Aligner | [45] | http://bio-bwa.sourceforge.net/bwa.shtml |
| Genome Analysis Toolkit | [46] | https://software.broadinstitute.org/gatk/ |
METHODS DETAILS
Establishment and propagation of MA lines
The commonly used diploid S. cerevisiae strain BY4743 was chosen for MA. A total of 168 MA lines were established from the same ancestral colony. These lines were propagated at 30°C in seven different solid media (Table S1), with 24 parallel lines per medium. All MA lines were passaged by single-cell colony transfers, where a randomly selected average-size colony was streaked onto a new plate. Selecting average-size colonies prevents the fixation of petite mutations. Plates from previous transfers were stored at 4°C to allow additional transfers if the first transfer was unsuccessful, which occurred 38 times (cells did not grow in 37 cases and fungal contamination in one case) in a total of ~10,000 transfers. Among the 38 incidents, two lines failed to recover from 4°C possibly due to the occurrence of cold sensitive mutations; these two lines were thus excluded from the study. Because the yeast growth rate varied in the seven media, we set different bottleneck intervals for different media to allow similar numbers of cell divisions between bottlenecks across media. This interval was 24 hours in YPD and CuSO4, 36 hours in YNB and YPX, and 48 hours in LiCl, YPL, and NaCl. We kept the total number of cell divisions in all MA lines to ~1000, corresponding to ~60 bottlenecks in each medium (Table S1).
In the preparation of the seven media, pH was adjusted in YNB to ~6 by adding 2.5 ml 1 M NaOH in 1 L medium. Without the adjustment, this medium would have been too acidic and not solidified well. The pH was ~5 in CuSO4 and YPX and ~6 in the other media. The mutation rate does not show significant elevations in the two media with relatively low pH when compared with that in YPD, suggesting that medium pH does not play an important role in our study.
Growth rate and cell viability
The conditions used in growth rate measurement were the same as those in the MA experiment. Specifically, to measure the yeast growth rate in a solid medium, we counted the number of cells in a single colony after growing for a certain amount of time (t = 24, 36, or 48 hours according to the media). In each estimate, one average-size colony was randomly chosen and the cells in the colony were collected in 1 μl of 1 M sorbitol under microscope. Cell number (N) was estimated using a hemocytometer and growth rate per hour (r) was calculated assuming exponential growth described by N = ert. It can be shown that the generation time g = ln2/r and the number of generations per day is 24/g=24r/ln2.
Cell viability is determined by counting colony-forming units (CFUs) as previously described [44]. Specifically, cells were first cultured in liquid YPD to control the number of cells to be plated onto each solid medium. Cells growing in liquid YPD at the mid-log phase were collected by centrifuge and washed with water. Cells were then resuspended in water and diluted to ~1000 cells per ml. We then plated 100 μl of the cell population (~100 cells) on each solid medium, followed by incubation at 30°C for 48 hours before CFU counting. Relative cell viability is the number of CFUs divided by average number of CFUs in YPD, averaged among six replicates per medium type.
DNA extraction, library construction, and genome sequencing
Genomic DNAs of the ancestor and all MA lines were extracted using MasterPure™ Yeast DNA Purification Kit (Lucigen; Cat. No. MPY80200). Sequencing libraries were constructed using Nextera DNA Flex Library Prep (Illumina; Cat. No. 20018705). Paired-end 2×150 sequencing reads were generated on Illumina Hiseq 4000 platform by Admera Health LLC (www.admerahealth.com/). The genome coverage was 202× for the ancestor and ranged from 66× to 155× for the 166 MA lines.
Identification of mutations
For each sample, the sequencing reads were mapped to the S. cerevisiae reference genome (version R64-2-1) by Burrows-Wheeler Aligner [45]; marking of duplicates and realignment around indels were carried out by Genome Analysis Toolkit (GATK) [46]. SNVs and small indels were called by GATK HaplotypeCaller. Variants were screened based on the following criteria after initial calling: (i) each variant must be supported by at least five reads, (ii) each variant must be supported by both forward and reverse reads, (iii) quality score is at least 50, and (iv) manual inspection confirms mis-alignments.
Segmental duplications/deletions and whole-chromosome gains/losses were determined based on the sequencing coverage following previous published methods [23]. In particular, an event is called if the sequencing depth of a chromosome or a segment of a chromosome differs by more than 35% from other chromosomes in the same sample.
To verify Illumina sequencing and variant calling, we randomly chose 11 SNVs and 7 small indels for confirmation by Sanger sequencing, and all of the Sanger sequencing results were consistent with the whole-genome resequencing data (Table S3).
RT-qPCR
Cells were collected after growing on each solid medium for ~16 generations. Total RNA was extracted using RNeasy Mini Kit (QIAGEN; LOT: 160019171). Reverse transcription was performed using SuperScript III First-Strand Synthesis System for RT-PCR (Invitrogen; LOT: 1903730) with random hexamers. Quantitative PCR reactions were run on QuantStudio 3 (Applied Biosystems) using Power SYBR Green PCR Master Mix (Applied Biosystems; PIN: 4367659). Expression levels relative to the total expression level of the three essential DNA polymerase genes were computed.
QUANTIFICATION AND STATISTICAL ANALYSIS
Statistical analyses in this work were carried out in R [47]. In the analysis of the correlation between growth rate and mutation rate in Figures 3 and 6, both Pearson’s and Spearman’s correlations were computed with N = 166 lines, as recommended [48]. This is because different MA lines from the same environment provide independent mutation rate estimates. The same approach was previously used in MA studies [39]. Generalized linear models were fitted using R.
DATA AND SOFTWARE AVAILABILITY
Raw sequencing reads generated in this study have been submitted to the NCBI sequence read archive (accession number PRJNA510430).
Supplementary Material
Data S1. List of all mutations identified in this study. Related to Figure 2.
Highlights.
Yeast nuclear mutation rate decreases with cell growth rate across environments
Yeast mitochondrial mutation rate rises with cell growth rate across environments
Yeast nuclear mutation spectrum vary among environments
ACKNOWLEDGEMENTS
We thank Wenfeng Qian, members of the Zhang lab, and three anonymous reviewers for valuable comments. This work was supported by the U.S. National Institutes of Health research grant GM120093 to J.Z.
Footnotes
Publisher's Disclaimer: This is a PDF file of an unedited manuscript that has been accepted for publication. As a service to our customers we are providing this early version of the manuscript. The manuscript will undergo copyediting, typesetting, and review of the resulting proof before it is published in its final citable form. Please note that during the production process errors may be discovered which could affect the content, and all legal disclaimers that apply to the journal pertain.
DECLARATION OF INTERESTS
The authors declare no competing interests.
REFERENCES
- 1.Luria SE, and Delbruck M (1943). Mutations of bacteria from virus sensitivity to virus resistance. Genetics 28, 491–511. [DOI] [PMC free article] [PubMed] [Google Scholar]
- 2.Lederberg J, and Lederberg EM (1952). Replica plating and indirect selection of bacterial mutants. J Bacteriol 63, 399–406. [DOI] [PMC free article] [PubMed] [Google Scholar]
- 3.Williams AB, and Foster PL (2012). Stress-induced mutagenesis. EcoSal Plus 5. doi: 10.1128/ecosalplus.7.2.3. [DOI] [PMC free article] [PubMed] [Google Scholar]
- 4.Cairns J, Overbaugh J, and Miller S (1988). The origin of mutants. Nature 335, 142–145. [DOI] [PubMed] [Google Scholar]
- 5.Cairns J, and Foster PL (1991). Adaptive reversion of a frameshift mutation in Escherichia coli. Genetics 128, 695–701. [DOI] [PMC free article] [PubMed] [Google Scholar]
- 6.Shor E, Fox CA, and Broach JR (2013). The yeast environmental stress response regulates mutagenesis induced by proteotoxic stress. PLoS Genet 9, e1003680. [DOI] [PMC free article] [PubMed] [Google Scholar]
- 7.Jiang C, Mithani A, Belfield EJ, Mott R, Hurst LD, and Harberd NP (2014). Environmentally responsive genome-wide accumulation of de novo Arabidopsis thaliana mutations and epimutations. Genome Res 24, 1821–1829. [DOI] [PMC free article] [PubMed] [Google Scholar]
- 8.Matsuba C, Ostrow DG, Salomon MP, Tolani A, and Baer CF (2013). Temperature, stress and spontaneous mutation in Caenorhabditis briggsae and Caenorhabditis elegans. Biol Lett 9, 20120334. [DOI] [PMC free article] [PubMed] [Google Scholar]
- 9.Napolitano R, JanelFBintz R, Wagner J, and Fuchs R (2000). All three SOSFinducible DNA polymerases (Pol II, Pol IV and Pol V) are involved in induced mutagenesis. EMBO J 19, 6259–6265. [DOI] [PMC free article] [PubMed] [Google Scholar]
- 10.Baer CF (2008). Does mutation rate depend on itself. PLoS Biol 6, e52. [DOI] [PMC free article] [PubMed] [Google Scholar]
- 11.MacLean RC, Torres-Barceló C, and Moxon R (2013). Evaluating evolutionary models of stress-induced mutagenesis in bacteria. Nat Rev Genet 14, 221–227. [DOI] [PubMed] [Google Scholar]
- 12.Swings T, Van den Bergh B, Wuyts S, Oeyen E, Voordeckers K, Verstrepen KJ, Fauvart M, Verstraeten N, and Michiels J (2017). Adaptive tuning of mutation rates allows fast response to lethal stress in Escherichia coli. Elife 6, e22939. [DOI] [PMC free article] [PubMed] [Google Scholar]
- 13.Hull RM, Cruz C, Jack CV, and Houseley J (2017). Environmental change drives accelerated adaptation through stimulated copy number variation. PLoS Biol 15, e2001333. [DOI] [PMC free article] [PubMed] [Google Scholar]
- 14.Long H, Miller SF, Strauss C, Zhao C, Cheng L, Ye Z, Griffin K, Te R, Lee H, Chen C-C, et al. (2016). Antibiotic treatment enhances the genome-wide mutation rate of target cells. Proc Natl Acad Sci USA 113, E2498–E2505. [DOI] [PMC free article] [PubMed] [Google Scholar]
- 15.Rando OJ, and Verstrepen KJ (2007). Timescales of genetic and epigenetic inheritance. Cell 128, 655–668. [DOI] [PubMed] [Google Scholar]
- 16.Elena SF, and de Visser JAG (2003). Environmental stress and the effects of mutation. J Biol 2, 12. [DOI] [PMC free article] [PubMed] [Google Scholar]
- 17.Ram Y, and Hadany L (2014). Stress-induced mutagenesis and complex adaptation. Proc Biol Sci 281, 20141025. [DOI] [PMC free article] [PubMed] [Google Scholar]
- 18.Tenaillon O, Denamur E, and Matic I (2004). Evolutionary significance of stress-induced mutagenesis in bacteria. Trends Microbiol 12, 264–270. [DOI] [PubMed] [Google Scholar]
- 19.Maharjan RP, and Ferenci T (2017). A shifting mutational landscape in 6 nutritional states: Stress-induced mutagenesis as a series of distinct stress input–mutation output relationships. PLoS Biol 15, e2001477. [DOI] [PMC free article] [PubMed] [Google Scholar]
- 20.Frenoy A, and Bonhoeffer S (2018). Death and population dynamics affect mutation rate estimates and evolvability under stress in bacteria. PLoS Biol 16, e2005056. [DOI] [PMC free article] [PubMed] [Google Scholar]
- 21.Sharp NP, Sandell L, James CG, and Otto SP (2018). The genome-wide rate and spectrum of spontaneous mutations differ between haploid and diploid yeast. Proc Natl Acad Sci USA 115, E5046–E5055. [DOI] [PMC free article] [PubMed] [Google Scholar]
- 22.Katju V, and Bergthorsson U (2018). Old trade, new tricks: insights into the spontaneous mutation process from the partnering of classical mutation accumulation experiments with high-throughput genomic approaches. Genome Biol Evol 11, 136–165. [DOI] [PMC free article] [PubMed] [Google Scholar]
- 23.Zhu YO, Siegal ML, Hall DW, and Petrov DA (2014). Precise estimates of mutation rate and spectrum in yeast. Proc Natl Acad Sci USA 111, E2310–E2318. [DOI] [PMC free article] [PubMed] [Google Scholar]
- 24.Hershberg R, and Petrov DA (2010). Evidence that mutation is universally biased towards AT in bacteria. PLoS Genet 6, e1001115. [DOI] [PMC free article] [PubMed] [Google Scholar]
- 25.Hildebrand F, Meyer A, and Eyre-Walker A (2010). Evidence of selection upon genomic GC-content in bacteria. PLoS Genet 6, e1001107. [DOI] [PMC free article] [PubMed] [Google Scholar]
- 26.Long H, Sung W, Kucukyildirim S, Williams E, Miller SF, Guo W, Patterson C, Gregory C, Strauss C, Stone C, et al. (2018). Evolutionary determinants of genome-wide nucleotide composition. Nat Ecol Evol 2, 237–240. [DOI] [PMC free article] [PubMed] [Google Scholar]
- 27.Galhardo RS, Do R, Yamada M, Friedberg E, Hastings P, Nohmi T, and Rosenberg S (2009). DinB up-regulation is the sole role of the SOS response in stress-induced mutagenesis in Escherichia coli. Genetics 182, 55–68. [DOI] [PMC free article] [PubMed] [Google Scholar]
- 28.Lynch M, Koskella B, and Schaack S (2006). Mutation pressure and the evolution of organelle genomic architecture. Science 311, 1727–1730. [DOI] [PubMed] [Google Scholar]
- 29.Balaban RS, Nemoto S, and Finkel T (2005). Mitochondria, oxidants, and aging. Cell 120, 483–495. [DOI] [PubMed] [Google Scholar]
- 30.Martin AP (1995). Metabolic rate and directional nucleotide substitution in animal mitochondrial DNA. Mol Biol Evol 12, 1124–1131. [DOI] [PubMed] [Google Scholar]
- 31.Gao Z, Wyman MJ, Sella G, and Przeworski M (2016). Interpreting the dependence of mutation rates on age and time. PLoS Biol 14, e1002355. [DOI] [PMC free article] [PubMed] [Google Scholar]
- 32.Krašovec R, Belavkin RV, Aston JA, Channon A, Aston E, Rash BM, Kadirvel M, Forbes S, and Knight CG (2014). Mutation rate plasticity in rifampicin resistance depends on Escherichia coli cell–cell interactions. Nat Commun 5, 3742. [DOI] [PMC free article] [PubMed] [Google Scholar]
- 33.Krašovec R, Richards H, Gifford DR, Hatcher C, Faulkner KJ, Belavkin RV, Channon A, Aston E, McBain AJ, and Knight CG (2017). Spontaneous mutation rate is a plastic trait associated with population density across domains of life. PLoS Biol 15, e2002731. [DOI] [PMC free article] [PubMed] [Google Scholar]
- 34.Kimura M (1983). The Neutral Theory of Molecular Evolution, (Cambridge University Press; ). [Google Scholar]
- 35.Ohta T (1992). The nearly neutral theory of molecular evolution. Annu Rev Ecol Syst 23, 263–286. [Google Scholar]
- 36.Ohta T (1993). An examination of the generation-time effect on molecular evolution. Proc Natl Acad Sci USA 90, 10676–10680. [DOI] [PMC free article] [PubMed] [Google Scholar]
- 37.Zuckerkandl E, and Pauling L (1965). Evolutionary divergence and convergence in proteins In Evolving Genes and Proteins., Bryson V and Vogel HJ, eds. (New York: Academic Press; ), pp. 97–166. [Google Scholar]
- 38.Sharp NP, and Agrawal AF (2012). Evidence for elevated mutation rates in low-quality genotypes. Proc Natl Acad Sci USA 109, 6142–6146. [DOI] [PMC free article] [PubMed] [Google Scholar]
- 39.Sharp NP, and Agrawal AF (2016). Low genetic quality alters key dimensions of the mutational spectrum. PLoS Biol 14, e1002419. [DOI] [PMC free article] [PubMed] [Google Scholar]
- 40.McDonald JH, and Kreitman M (1991). Adaptive protein evolution at the Adh locus in Drosophila. Nature 351, 652. [DOI] [PubMed] [Google Scholar]
- 41.Denver DR, Morris K, Streelman JT, Kim SK, Lynch M, and Thomas WK (2005). The transcriptional consequences of mutation and natural selection in Caenorhabditis elegans. Nat Genet 37, 544–548. [DOI] [PubMed] [Google Scholar]
- 42.Muller HJ (1928). The measurement of gene mutation rate in Drosophila, its high variability, and its dependence upon temperature. Genetics 13, 279–357. [DOI] [PMC free article] [PubMed] [Google Scholar]
- 43.Ogur M, Ogur S, and St John R (1960). Temperature dependence of the spontaneous mutation rate to respiration deficiency in Saccharomyces. Genetics 45, 189–194. [DOI] [PMC free article] [PubMed] [Google Scholar]
- 44.Kwolek-Mirek M, and Zadrag-Tecza R (2014). Comparison of methods used for assessing the viability and vitality of yeast cells. FEMS Yeast Res 14, 1068–1079. [DOI] [PubMed] [Google Scholar]
- 45.Li H, and Durbin R (2009). Fast and accurate short read alignment with Burrows–Wheeler transform. Bioinformatics 25, 1754–1760. [DOI] [PMC free article] [PubMed] [Google Scholar]
- 46.McKenna A, Hanna M, Banks E, Sivachenko A, Cibulskis K, Kernytsky A, Garimella K, Altshuler D, Gabriel S, and Daly M (2010). The Genome Analysis Toolkit: a MapReduce framework for analyzing next-generation DNA sequencing data. Genome Res 20, 1297–1303. [DOI] [PMC free article] [PubMed] [Google Scholar]
- 47.Team RC (2014). R: A language and environment for statistical computing. R Foundation for Statistical Computing, Vienna, Austria: 2013. [Google Scholar]
- 48.Motulsky H, and Christopoulos A (2004). Fitting Models to Biological Data Using Linear and Nonlinear Regression: A Practical Guide to Curve Fitting, (Oxford University Press; ). [Google Scholar]
Associated Data
This section collects any data citations, data availability statements, or supplementary materials included in this article.
Supplementary Materials
Data S1. List of all mutations identified in this study. Related to Figure 2.
Data Availability Statement
Raw sequencing reads generated in this study have been submitted to the NCBI sequence read archive (accession number PRJNA510430).