Abstract
A mechanism-based biomarker model of TNFα-response, including different external provocations of LPS challenge and test compound intervention, was developed. The model contained system properties (such as kt, kout), challenge characteristics (such as ks, kLPS, Km, LPS, Smax, SC50) and test-compound-related parameters (Imax, IC50). The exposure to test compound was modelled by means of first-order input and Michaelis–Menten type of nonlinear elimination. Test compound potency was estimated to 20 nM with a 70% partial reduction in TNFα-response at the highest dose of 30 mg·kg−1. Future selection of drug candidates may focus the estimation on potency and efficacy by applying the selected structure consisting of TNFα system and LPS challenge characteristics. A related aim was to demonstrate how an exploratory (graphical) analysis may guide us to a tentative model structure, which enables us to better understand target biology. The analysis demonstrated how to tackle a biomarker with a baseline below the limit of detection. Repeated LPS-challenges may also reveal how the rate and extent of replenishment of TNFα pools occur. Lack of LPS exposure-time courses was solved by including a biophase model, with the underlying assumption that TNFα-response time courses, as such, contain kinetic information. A transduction type of model with non-linear stimulation of TNFα release was finally selected. Typical features of a challenge experiment were shown by means of model simulations. Experimental shortcomings of present and published designs are identified and discussed. The final model coupled to suggested guidance rules may serve as a general basis for the collection and analysis of pharmacological challenge data of future studies.
Electronic supplementary material
The online version of this article (10.1007/s10928-019-09622-x) contains supplementary material, which is available to authorized users.
Keywords: Target biology, Kinetic-dynamic modelling, Challenge tests, Experimental design, Non-linear mixed effects modelling
Introduction
Tumour necrosis factor alpha (TNFα) is a pro-inflammatory cytokine associated with the pathogenesis of several immune-mediated diseases, such as rheumatoid arthritis and Crohn disease [1]. Since TNFα release is a typical response to a variety of inflammatory mediators, it became an important biomarker for various diseases mediated by inflammation [2]. Free TNFα is almost undetectable in blood of healthy organisms. However, pro-inflammatory challengers can induce TNFα expression and release of soluble TNFα after proteolytic cleavage of a precursor molecule by TNFα-converting enzyme TACE/ADAM-17 [7]. Experimentally, the effect of the inflammatory mediators is studied in vitro in whole blood assays or in vivo after intravenous administration of lipopolysaccharides LPS, where the challenger causes a rapid but transient release of TNFα [3, 6]. The in vivo LPS-challenge models are commonly utilized in drug discovery to identify and characterize anti-inflammatory drugs [4, 5]. However, experimental design will have a great impact on the results, particularly for drug-related pharmacodynamic parameters such as potency and efficacy [6]. In a typical in vivo LPS challenge experiment, only TNFα and test-compound concentrations are measured over time after a single LPS dose. The fact that the exposure to LPS concentrations is difficult to quantify causes a modelling problem. The question arises of how to define the stimulatory input of TNFα-response. Therefore, some of the current models use an LPS-stimulated biophase input [6].
Several models of LPS-induced TNFα-response have been proposed, including, to name just the most recent: (1) linearly stimulated turnover in combination with a series of transit compartments [6]; (2) a lag-time approach to pre-cursor-determined TNFα production [10, 12, 24]; (3) soluble TNFα with a time-dependent turnover rate [11, 12, 25]; (4) a quadratic function for TNFα production [26]; (5) an inhibitory Imax model of TNFα [27]; (6) a nonlinear FAA-driven stimulatory model with lag-time [28]. All of these models lack to a varying extent a quantitative description of delayed onset, saturable intensity and extended duration of LPS-induced TNFα-response following several dose levels of both LPS and test compound.
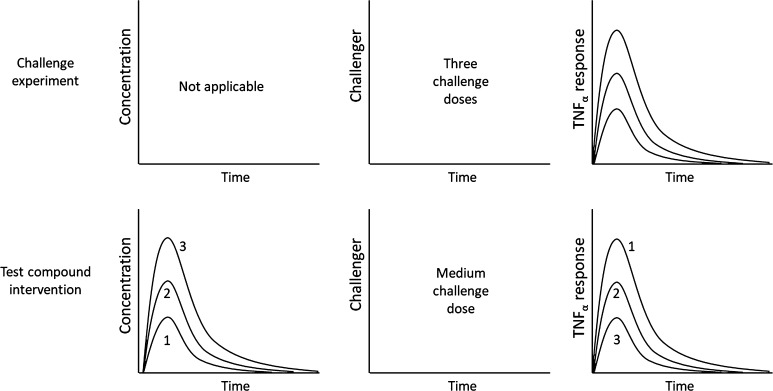
Three different LPS challenges (Study 1) and three inhibitory test-compound doses (Study 2) are investigated from a macro-pharmacological perspective using TNFα-response as a biomarker of target behavior (Fig. 1). Test-compound A is a selective inhibitor of phosphodiesterase (PDE) type 4 isoforms. The PDE4 isoforms have been shown to be involved in the LPS-induced TNFα release using genetic knockouts, and with the marketed pan-PDE4 inhibitors apremilast and roflumilast [30, 31].
Fig. 1.
Schematic presentation of the two studies incorporated into the analysis. Upper row: three LPS challenge doses (3, 30 and 300 µg·kg−1 of LPS) were given in Study 1 and the TNFα-response was measured. No time courses are available for LPS. Bottom row: the middle challenge dose (30 µg·kg−1 of LPS) was selected for three groups of rats that received 0.3, 3 and 30 mg·kg−1 of test-compound A in Study 2
The goal was therefore to identify the determinants of target biology related to TNFα turnover by means of pooling data from two preclinical studies in rats. This was done in order to answer the question: Will multiple LPS and test-compound provocations help in simultaneously characterizing TNFα system behavior, LPS challenge characteristics and test-compound properties, as suggested earlier. The analysis was tailored to derive a kinetic-dynamic model of TNFα-response, which has potential in discovery data analyses. Therefore, a meta-analysis was performed on available data from two separate studies on TNFα-response after multiple LPS and test compound interventions. For this purpose, a mixed-effects approach was a useful tool. Typically, if an accurate and precise estimate of the pharmacodynamic properties of a test compound is sought, time-series analyses of challenger- and biomarker-time data are necessary. Erosion of data, resulting in the single-point assessment of drug action after a challenge test, should be avoided. This is particularly relevant for situations where one expects time-curve shifts, functional adaptation, impact of disease, or hormetic concentration-response relationships to occur [6].
Materials and methods
Chemicals
Lipopolysaccharides (LPS) from Escherichia coli 0111:B4 was obtained from Sigma (Product number L4391; the same batch 036M4070V was used for both studies). The test-compound A was synthesized at Grunenthal, Aachen, Germany, and the purity of the batch used in this study was ≥ 95%. The physico-chemical properties of test compound A are presented in Table 1. Test-compound A was developed as an inhibitor of PDE4. The rat TNFα Quantikine ELISA kit was purchased from R&D systems (SRTA00, Batches P143557, P118837, and 339837). All other reagents and chemicals were of analytical grade and were obtained from standard vendors.
Table 1.
Physico-chemical properties of compound A
| Parameter | Value |
|---|---|
| Molecular weight | < 500 g·mol−1 |
| cLogP | < 2.5 |
| PSA | < 80 Å2 |
| Solubility | > 10 µmol·L−1 at pH 7.4 |
Animals
The studies were conducted in male Sprague–Dawley rats, approximately 210–260 g of body weight, purchased from Vital River Laboratory Animals Co. LTD. All rats were housed in groups under 12 h light/dark cycle with ad libitum access to food and water. During the study, animals were not fasted, but no food was provided prior to dosing until 3 h after drug dosing. All animals were handled in strict accordance with the Guide for the Care and Use of Laboratory Animals in an AAALAC-accredited facility. All animal studies were approved by an established Institutional Animal Care and Use Committee (IACUC).
Design of in vivo studies
LPS was dissolved in saline at 0.0006, 0.006, and 0.06 mg·mL−1 and 5 mL·kg−1 of the solutions were dosed intravenously via foot dorsal vein injection to give doses of 3, 30 and 300 µg·kg−1, respectively. Test-compound A was suspended in 1% HPMC (5 mPa s, Colorcon) and 0.5% Tween 80 (Sigma) in water at concentrations of 0.06, 0.6, and 6 mg·mL−1. Test-compound A was administered at a volume of 5 mL·kg−1 by oral gavage, resulting in doses of 0.3, 3 and 30 mg·kg−1, respectively.
Forty-eight normal male Sprague–Dawley rats were used in the LPS-induced TNFα-response model in the absence (Study 1) or presence (Study 2) of test-compound A (Fig. 1). The animals were randomly divided into eight groups (n = 6). In Study 1, four groups of animals were given increasing intravenous doses of LPS (0, 3, 30 and 300 μg·kg−1 LPS). In Study 2, four groups of animals received a fixed intravenous dose of LPS challenger of 30 μg·kg−1 and increasing oral doses of test compound (0, 0.3, 3 and 30 mg·kg−1 compound A). Test compound was administered two hours before the challenge with LPS. Blood samples were drawn for quantification of Test-compound A and TNFα before dosing of test compound (at − 2 h) and at − 1, 0, 0.5, 1, 1.5, 2, 3, and 4 h after LPS dosing (Fig. 2). Blood samples were collected into EDTA-2K tubes via tail vein or cardiac puncture for terminal bleeding. Samples were stored on ice and centrifuged at 2000×g for 5 min at 4 °C within 15 min after sampling. Each plasma sample was divided into two aliquots, one for LC-MS/MS analysis to measure test compound concentrations, and one for ELISA analysis to measure the biomarker TNFα concentrations. Until quantification, the plasma samples were stored at −70 °C after snap-freezing of plasma in dry ice.
Fig. 2.
Schematic presentation of the designs of Study 1 and 2. Arrows denote time of test-compound and LPS administration. Blood droplets denote harvesting of plasma samples for assessment of test-compound concentrations and TNFα-response, respectively. Test compound was only administered in Study 2 and no blood sample at − 1 h was taken in Study 1
Table 2 summarizes the experimental design of the two studies. Study 1 was conducted to characterize the dose-response-time relationships of the TNFα-release after LPS challenge and to define an appropriate LPS challenge dose. Study 2 investigated the inhibition of this response by Test-compound A using a fixed LPS challenge dose and three inhibitory test-compound doses. Full response time courses for TNFα were obtained and analyzed by modelling. The test-compound concentrations over time were measured as well, but the actual exposure to LPS could not be quantified due to the nature of LPS, which consists of a poorly defined mixture of different components of the bacterial cell wall.
Table 2.
Overview of experimental designs of the two individual studies
| Study | Challenge compound | Animal model | Test-compound | PD effect biomarker | Designs |
|---|---|---|---|---|---|
| 1 | LPS | Rat | – | TNFα | Three LPS challenge doses (3, 30 and 300 µg·kg−1); lacks challenger time course(s); no drug intervention |
| 2 | LPS | Rat | A | TNFα | One LPS challenge dose (30 µg·kg−1); lacks challenger time course(s); three test-compound intervention doses (0.3, 3 and 30 mg·kg−1) |
Bioanalytical methods
Quantification of TNFα concentrations by ELISA
TNFα concentrations in plasma were quantified with the rat TNFα Quantikine ELISA Kit (R&D Systems, SRTA00) according to the instructions provided in the kit, using seven calibrations standards ranging from 12.5 to 800 ng·L−1. The measured concentrations of the quality controls were all in the range as specified in the kit instruction and showed CV % < 20%. The lower limit of quantification (LLOQ) was 12.5 ng·L−1 and lower values were reported as “<LLOQ” and excluded from subsequent evaluation and parameter estimation.
Quantification of test-compound A concentrations by LC-MS/MS
For the quantification of the test compound, acetonitrile which contained dexamethasone as internal standard was added to plasma prepared from the blood samples for protein precipitation. Supernatants were injected onto a C18 reversed phase column for LC-MS/MS analysis. The UPLC separation was carried out using a gradient elution in H2O containing 0.025% formic acid/1 mM NH4OAc (mobile phase A) and methanol that contained 0.025% formic acid/1 mM NH4OAc (mobile phase B). The analytes were quantified on an API5500 mass spectrometer using multiple reaction monitoring with appropriate mass transitions. Each set of samples was run together with two calibration sets containing nine non-zero standard concentrations covering a range of range from 1 to 3000 nM. Quality controls of 3, 500, and 2400 nM were interspersed between the samples. The calculated concentrations of the calibration samples and quality controls were within ± 15% of the nominal values (20% at LLOQ) for at least 75% and 67% of the samples, respectively. Concentrations below 80% of the LLOQ (i.e. below 0.8 nM) were reported as “<LLOQ” and excluded from subsequent evaluation and parameter estimation.
Pharmacokinetic and pharmacodynamic models
Test compound kinetics
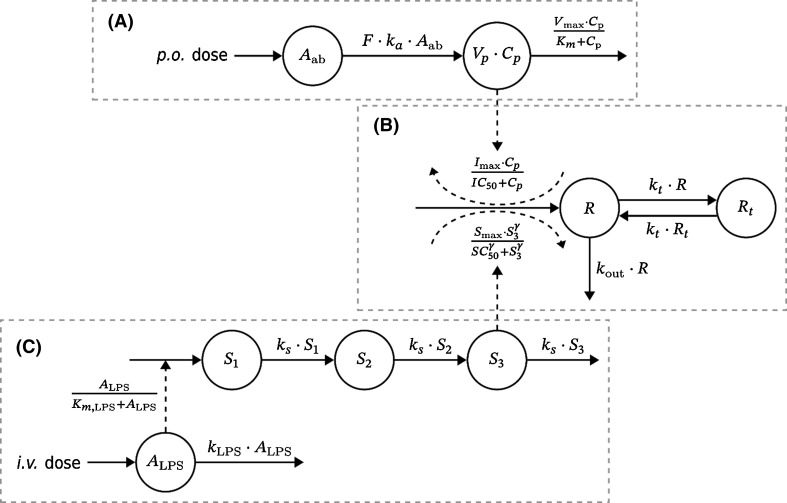
The impact of test compound on the TNFα-response is shown conceptually in Fig. 3a and b. The first-order loss of test compound from the gut is given by Eq. 1.
| 1 |
Fig. 3.
Schematic presentation of the kinetic and dynamic model. Solid lines symbolize mass transfer and dashed lines stand for control streams. Upper row A: Kinetic model of test compound disposition after oral administration. Here, Aab and Cp denote, respectively, amount and concentration in the gut and central plasma compartment. The volume of the latter is denoted by Vp. F and ka are the bioavailability and the absorption rate of the test compound. Vmax and Km are the maximum elimination and Michaelis–Menten constant. Middle row B: Turnover model for the TNFα-response. TNFα is divided into compartments R and Rt. Here, kt and kout denote the first-order transfer rate between compartments and elimination rate from the system. TNFα turnover is stimulated by LPS challenge from part C and inhibited by test compound kinetics from part A. Here, Imax is maximum inhibitory capacity of the test-compound and IC50 its potency, Smax is maximum stimulatory capacity, γ is a Hill exponent and SC50 is the potency of LPS challenge. Bottom row C: Model of LPS challenge. A first-order biophase ALPS describes LPS after intravenous administration with first-order elimination rate kLPS. LPS non-linearly stimulates a signal chain (S1 to S3) with Michaelis–Menten constant Km, and signal transfer—as well as elimination rate ks. A more detailed description of the principal parts of the model and their behavior are discussed in appendix
The plasma exposure to test compound was then described by a one-compartment model with first-order oral input and Michaelis–Menten elimination.
| 2 |
Aab denotes amount of test compound in the gut, Cp exposure to drug in plasma, ka the first-order absorption rate constant, Vmax maximum rate of elimination, Km the Michaelis–Menten constant, and Vp volume of distribution. The bioavailability F was set to unity.
LPS challenge model
The impact of the LPS challenge on the TNFα-response is shown conceptually in Fig. 3b and c. The intravenous LPS dose is injected into plasma as a bolus and cleared from plasma via first-order elimination.
| 3 |
The level of LPS in plasma triggers a series of transduction compartments with a saturable process ALPS / (Km, LPS + ALPS). The S3 signal acts on the build-up of TNFα-response via stimulatory action (S(S)3). The transduction of LPS-induced signal from S1 through S3 is given by Eq. 4.
| 4 |
ALPS is LPS amount in the biophase and S1 to S3 are a chain of transduction compartments which act as signaling compartments. LPS is thought to be eliminated with rate constant kLPS. Signal S1 is stimulated non-linearly by LPS with Michaelis–Menten constant Km. Rate constant ks describes transfer of signal across S1 to S3 and loss from system.
TNFα turnover model
Figure 3b shows conceptually the TNFα turnover R and the impact of both the LPS challenge and the test compound kinetics on the TNFα-response. The dynamics of TNFα-response is divided into a central R and a peripheral Rt pool governed by a first-order inter-compartmental rate constant kt, in order to capture the post-peak bi-phasic decline of response. The irreversible loss of TNFα occurs from its central compartment via a first-order rate process kout· R.
The stimulatory action via S3 of LPS-induced challenge is given by Eq. 5.
| 5 |
Smax is the maximum LPS stimulatory production rate of TNFα, and SC50 is the corresponding transducer concentration S3 where 50% of maximum rate occurs. The inhibitory action of test compound I(Cp) on build-up of response is.
| 6 |
The structure of Eq. 6 allows a partial Imax inhibitory effect of the test compound. The IC50 parameter denotes the concentration of test compound resulting in 50% of maximal test-compound inhibitory capacity.
Equations 5 and 6 are then combined in Eq. 7 describing the TNFα-response in the central R and peripheral Rt compartments.
| 7 |
Smax is the maximum stimulatory capacity, SC50 concentration of S3 at 50% of maximum stimulation, γ a Hill exponent, Imax maximum inhibitory capacity by test compound and IC50 test compound potency. Neither S1, S2 or S3, nor TNFα-response display any baseline concentrations in the proposed model. Without any stimulation from LPS there is no TNFα-response to inhibit with test compound.
The determinants of the TNFα-response at equilibrium are given by Eq. 8.
| 8 |
This expression is presented as a 3D-plot in Appendix 2 using the final parameter estimates from regressing TNFα response time data.
Data analysis
Non-linear mixed-effects modelling (NLME) [13] was used to regress the model in Fig. 3 to TNFα-response data and to capture inter-individual variability (IIV). The number of animals was small (18 and 17 subjects in Study 1 and 2, respectively). Therefore, the IIV estimation was restricted to Vmax, kLPS, SC50, kout, Imax and IC50 (See Appendix). Residual variance of compound exposure was modelled with an additive error model on the log-scale and for response concentrations with a proportional error model.
Model parameters were estimated using Monolix [20], including stochastic approximation for the determination of standard errors. In step 1, parameters in Eqs. 3–5 and 7 were based on TNFα-responses from Study 1. The pharmacokinetic parameters in Eqs. 1 and 2 were estimated from test compound data from Study 2. The pharmacokinetic parameters were then fixed together with systems parameters from Step 1, and Imax and IC50 were estimated from Study 2 data. Further computational details can be found in Appendix 1.
Results
Experimental data
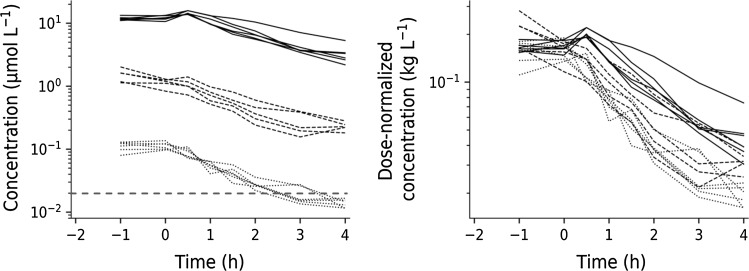
Figure 4 shows the plasma concentration–time course of test compound (left) and dose-normalized plasma concentrations (right). The exposure to test compound increases disproportionately with increasing doses of test compound, which suggests nonlinear elimination with increasing oral doses. There is also a weak tendency of a longer terminal half-life with increasing oral doses. This nonlinearity was captured by Eq. 1.
Fig. 4.
Left: semi-logarithmic plot of concentration–time data of test-compound A at three oral doses (0.3, 3 and 30 mg·kg−1, shown as dotted, dashed and solid lines, respectively) in Sprague–Dawley rats from Study 2. Test compound was administered 2 h before intravenous challenge with LPS. The dashed red horizontal line represents the model-predicted test compound potency of about 20 nM. Right: Dose-normalized test compound concentrations plotted versus time
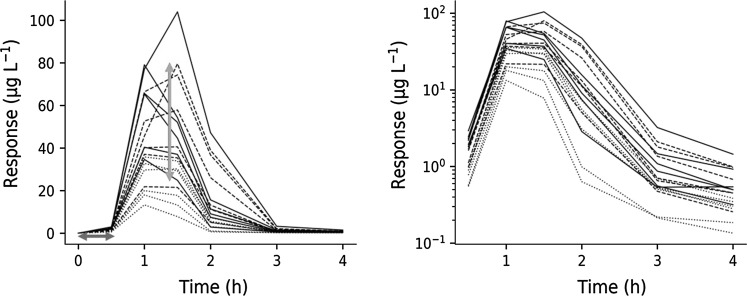
The TNFα-response following three different intravenous LPS challenge doses of 3, 30 and 300 µg·kg−1 is shown in Fig. 5. TNFα data display a 30 min time-delay in onset of response independently of challenge dose (Fig. 5 left). Additionally, TNFα-response time courses show a bi-phasic post-peak decline (Fig. 5 right). This motivated the two-compartment structure for the TNFα-response.
Fig. 5.
Left: TNFα-response time courses at increasing intravenous LPS challenge (3, 30 and 300 μg·kg−1 LPS, shown as dotted, dashed and solid lines, respectively) in Sprague–Dawley rats from Study 1. The blue horizontal double arrow represents the initial time delay in onset of response, and the red vertical double arrow, the 20–80 range in TNFα peak-response of the 30 μg·kg−1 LPS challenge. Right: Semi-logarithmic plot of the same TNFα-response time courses (Color figure online)
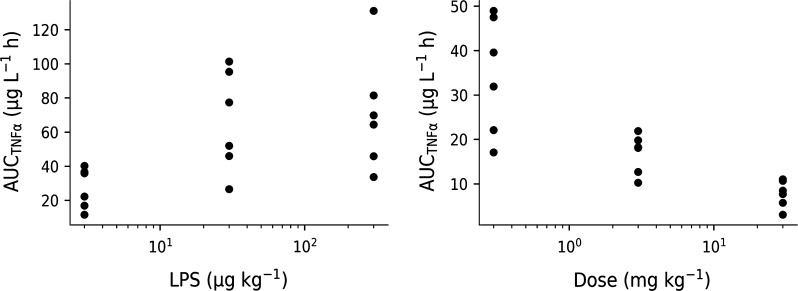
The areas under the TNFα-response time curves are plotted versus LPS challenge dose in Fig. 6 (left, Study 1), as are the areas under the TNFα-response time at a fixed LPS challenge dose of 30 µg·kg−1 but increasing test compound doses of 0.3, 3 and 30 mg·kg−1 (right, Study 2). The exploratory analysis shows that both increasing LPS doses and increasing test compound doses have an opposite nonlinear impact on the TNFα response.
Fig. 6.
Left: Area under the TNFα-response plotted versus increasing LPS challenge doses (3, 30 and 300 μg·kg−1 LPS) from Study 1. Right: Area under the TNFα-response plotted versus increasing oral doses of test compound (0.3, 3 and 30 mg·kg−1 test-compound A) and a fixed intravenous LPS challenge with 30 μg kg−1 from Study 2
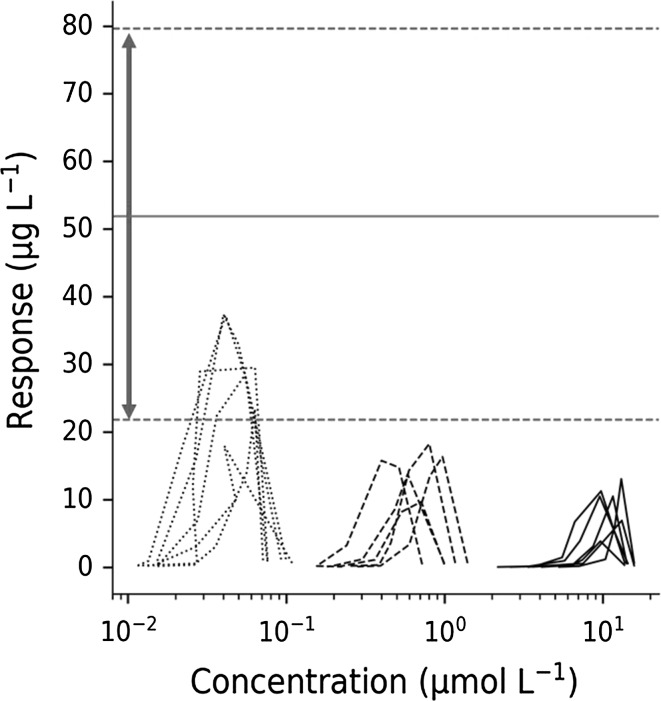
Figure 7 shows TNFα response versus test compound concentrations for the fixed 30 µg·kg−1 LPS challenge and three test compound interventions (0.3, 3 and 30 mg kg−1 Compound A, Study 2) superimposed on the peak TNFα response range (horizontal red dashed lines) of 30 µg·kg−1 LPS challenge (Study 1). There is a 50% reduction in TNFα peak response already at the lowest test compound dose, suggesting that efficacious test compound concentrations fall within the 10–100 nM range.
Fig. 7.
Hysteresis plot of individual TNFα-response plotted versus A concentrations following a fixed intra-venous LPS challenge dose (30 μg·kg−1) and increasing oral doses of test-compound A (0.3, 3 and 30 mg·kg−1). The upper and lower dashed horizontal lines represent the TNFα peak response range in vehicle control animals given only a 30 μg·kg−1 LPS challenge dose (Study 1)
The TNFα model is mathematically described by Eqs. 1–7. The first-order input and Michaelis–Menten-output were obtained from separately regressing concentration-time data of test compound. A biophase compartment was included to mimic the time courses of LPS in plasma. The 30 min LPS dose-independent time delay of TNFα-response was captured by simultaneously combining a series of transit compartments with a nonlinear stimulatory term of transit compartment S1. The latter varied between zero and unity and allowed the same time of onset of action for the TNFα-response for all LPS doses. The intensity of TNFα-response showed saturation with increasing LPS doses. This was modelled by means of a nonlinear stimulatory function with its own LPS-potency parameter SC50, driven by the last transit compartment S3. The bi-phasic post-peak decline of TNFα-response was captured by means of a two-compartment (central R and peripheral Rt) model. TNFα-response time data of Study 1 were regressed after increasing LPS challenge doses (3, 30 and 300 µg·kg−1 LPS). Regression of TNFα-response time data of Study 2 after increasing oral test compound doses (0.3, 3 and 30 mg·kg−1 Compound A) with a fixed intravenous LPS challenge (30 µg·kg−1) was then done as a last step to get potency IC50 and maximum inhibitory capacity Imax of test compound.
Model regression
TNFα during LPS challenge: study 1
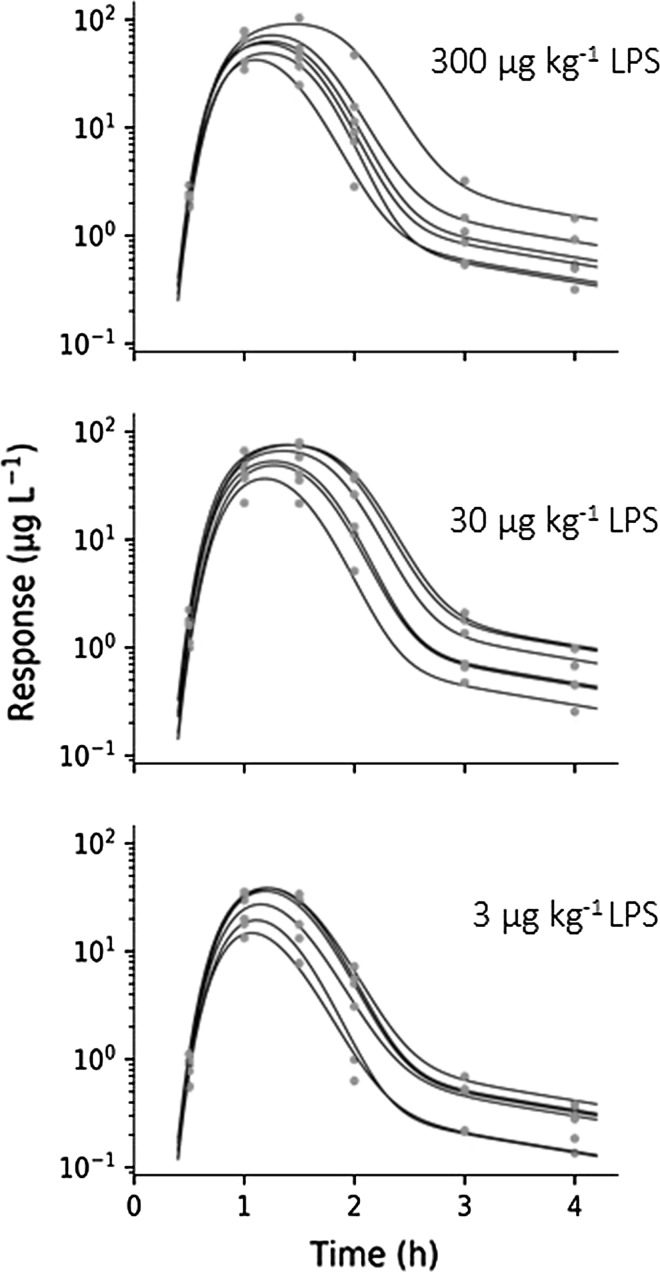
Equations 3 and 4 captured the TNFα-response at all LPS challenges (Fig. 8) and revealed system properties (such as kt, kout) and challenge characteristics (such as ks, kLPS, Km, LPS, Smax, SC50). Future selection of potential drug candidates may focus the estimation on potency and efficacy applying the selected framework while keeping system fixed.
Fig. 8.
Observed concentrations (red dots) and predicted response time courses (solid lines) of TNFα-response for all subjects in Study 1. LPS challenge was 3 µg·kg−1 (upper), 30 µg·kg−1 (middle) and 300 µg·kg−1 (lower) (Color figure online)
Experimental data show a 30 min time lag in onset coupled to a slight peak-shift in TNFα-response at increasing LPS doses, which suggests a nonlinear stimulation of TNFα release. The final parameter estimates and their precision (CV%) are shown in Table 3. The predicted half-life of TNFα-response was less than 10 min. The elimination rate constant of LPS from the biophase compartment, the transit compartment rate constant and the fractional turnover rate of TNFα-response were all short and fell in the same range (with half-lives of 5, 13 and 7 min, respectively).
Table 3.
Final pharmacodynamic model estimates, their CV% and IIV and IIV CV% as well as resulting half-life
| Parameter | Units | Final estimate | CV% | IIV% | IIV CV% | Half-life (min) |
|---|---|---|---|---|---|---|
| k LPS | h−1 | 8.36 | 29 | 30.4 | 19 | 5 |
| k s | h−1 | 3.28 | 8.1 | – | – | 13 |
| K m,LPS | µg·kg−1 | 0.0789 | 19 | – | – | |
| S max | ng·L−1·h−1 | 6·105 | 12 | – | – | |
| SC 50 | – | 0.469 | 14 | 9.0 | 42 | |
| γ | – | 3.79 | 2.5 | – | – | |
| k out | h−1 | 5.65 | 30 | 14.8 | 34 | 7 |
| k t | h−1 | 0.419 | 37 | – | – | 100 |
TNFα during a fixed LPS challenge coupled to varying test compound intervention: study 2
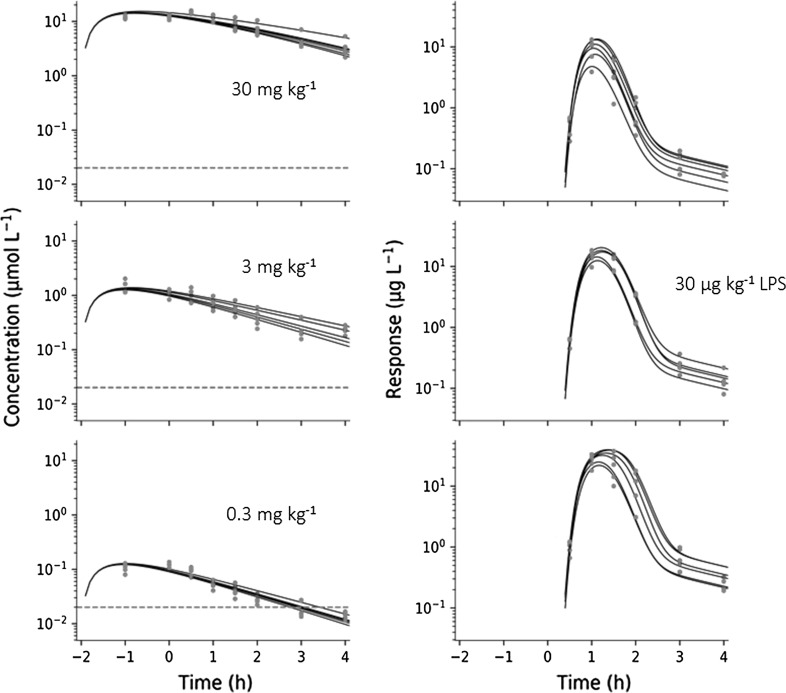
The exposure to test-compound A was well characterized by Eqs. 1, 2 (Fig. 9 left). Test compound was given 2 h prior to the LPS challenge dose (30 µg·kg−1). The model-predicted test compound concentration peaked within an hour at the lowest dose (0.3 mg·kg−1), consistent with experimental data. A peak shift was then observed in model predictions due to the capacity-limited elimination with increasing doses of test compound (at 3, 30 mg·kg−1). All pharmacokinetic parameters and their precision were well characterized (Table 4).
Fig. 9.
Left column: Observed (red dots) and model-predicted (solid lines) concentration–time data of test compound (A) of all subjects in Study 2. Right column: Observed (red dots) and model-predicted (solid lines) TNFα-response data of all subjects in Study 2. TNFα-response was observed after a fixed LPS challenge of 30 µg·kg−1. Test compound doses were 0.3 mg·kg−1 (upper row), 3 mg·kg−1 (middle row), and 30 mg·kg−1 (bottom row) (Color figure online)
Table 4.
Final pharmacokinetic estimates, their CV% and IIV and CV%
| Parameter | Units | Final estimate | CV% | IIV% (CV %) | IIV CV% |
|---|---|---|---|---|---|
| k a | h−1 | 1.72 | 12 | – | – |
| V p | L·kg−1 | 3.30 | 4.2 | – | – |
| V max | µmol·h−1·kg−1 | 32.2 | 14 | 11.5 | 22 |
| K m | µmol·L−1 | 18.2 | 16 | – | – |
The model captured all features (such as onset, intensity and duration) of the TNFα-response at a fixed LPS challenge (30 µg·kg−1) and varying test compound doses (Fig. 9 right). A slight leftward shift in TNFα peak response was observed for increasing test compound doses. The final test compound parameters of Imax and IC50 are shown in Table 5. Test compound displayed partial inhibition (Imax = 0.675 or 68%) of LPS-induced TNFα-response, and a corresponding potency of about 20 nmol·L−1 (IC50 = 23.1 nM) as total plasma concentration of test compound A.
Table 5.
Final pharmacodynamic model estimates, their CV% and IIV and IIV CV%
| Parameter | Units | Final estimate | CV% | IIV% | IIV CV% |
|---|---|---|---|---|---|
| I max | – | 0.675 | 5 | 25.1 | 68 |
| IC 50 | nmol·L−1 | 23.1 | 26 | 24.5 | 127 |
Between-subject variability and residual uncertainty
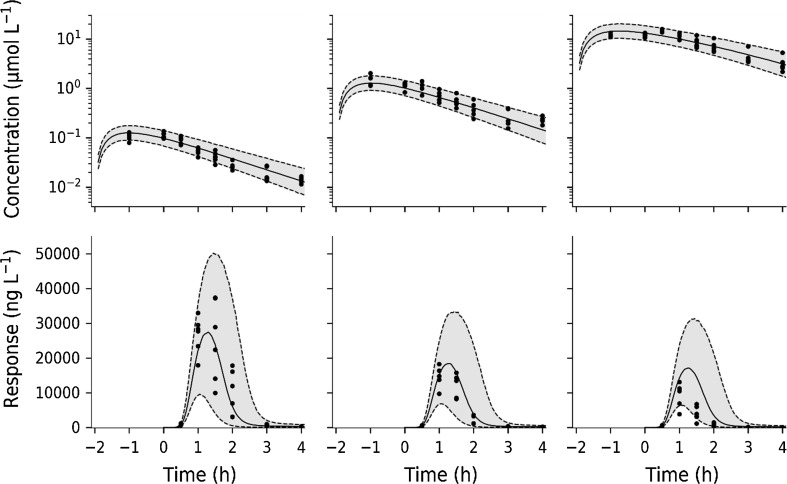
The inter-individual variability in TNFα-response (Study 1) is well predicted in the 3 and 30 µg·kg−1 dose groups (Fig. 10 left and middle). The inter-individual variability in TNFα-response is also well predicted in the 0.3 mg·kg−1 test compound dose group (Fig. 11 lower left). Variability is overestimated in the 3 and 30 mg·kg−1 dose group (Fig. 11 lower middle and right).
Fig. 10.
Visual predictive checks for the TNFα-response during LPS challenge (Study 1). Solid black symbols correspond to model-predicted time courses. The shaded grey areas show variability in predicted time courses. Dashed lines show the 5% (lower) and 95% (upper) percentiles and the middle solid line is the median. LPS challenge was 3 µg·kg−1 (left), 30 µg·kg−1 (middle) and 300 µg·kg−1 (right)
Fig. 11.
Semi-logarithmic plot of test compound exposure and TNFα-response (Study 2). Upper row: Visual predictive check of test compound concentration. Lower row: Visual predictive check of TNFα-response at 30 µg·kg−1 LPS challenge and varying test compound intervention. Filled circles correspond to model-predicted time courses for test-compound concentration and TNFα-response, respectively. The shaded grey areas are the predicted variability. Dashed lines show the 5 to 95% percentiles and solid line the median. Test compound doses were 0.3 mg·kg−1 (left column), 3 mg·kg−1 (middle column) and 30 mg·kg−1 (right column)
Model simulations
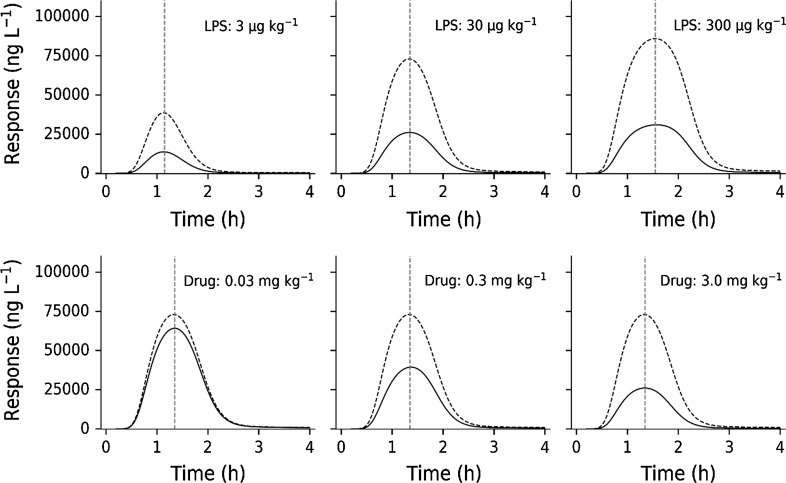
Model simulations were done with a fixed test compound dose (3 mg·kg−1) and increasing LPS challenges (Fig. 12, upper row) in order to clarify the behavior of the model. Predictions show suppression of TNFα peak response proportional to LPS challenge, as well as a peak-shift in TNFα-response with increasing LPS doses. Model simulations were also performed with a fixed challenge dose (30 µg·kg−1) and varying test compound doses (0.03, 0.3 and 3.0 mg·kg−1) (Fig. 12, bottom row). Approximately 70% suppression was observed in TNFα-response with the 3.0 mg·kg−1 dose since Imax was estimated to 0.675. The model-predicted in vivo potency IC50 of test compound is 20 nM (Table 3), which is consistent with experimental data. The test compound exposure covers a 10 to 1000 nM concentration range, which brackets the potency estimate.
Fig. 12.
Upper row: Impact of different LPS doses (3, 30, 300 µg·kg−1) on TNFα-response given with (solid lines) and without (dashed line) 3 mg·kg−1 of test compound. Bottom row: Impact of a fixed LPS dose (30 μg·kg−1) on TNFα-response with (solid lines) and without (dashed lines) changing test compound doses (0.03, 0.3 and 3.0 mg·kg−1). The red vertical dashed lines show the peak-time locations (Color figure online)
Discussion
A mechanism-based model describing TNFα-response was fitted to data obtained after several LPS challenges alone (Study 1) and a fixed LPS challenge in combination with varying doses of test compound (Study 2). The model captured experimental data well and gave accurate and precise parameters. “What-if” predictions were then made to explore model behavior at a fixed test compound dose and varying LPS challenges, and the reverse scenario. This was done to further evaluate the combined impact of test-compound and LPS challenge on the time course of TNFα with respect to lag-times, peak-shifts and duration response.
Experimental data
Test compound is a phosphodiesterase 4 PDE4 inhibitor, which indirectly targets mechanisms responsible for TNFα release. This requires the compound to be present during LPS challenge, since it does not affect circulating TNFα, which has been shown previously. Test compound demonstrates partial inhibition of TNFα release. Experimental data of test compound exposure were lacking prior to Cmax with a predicted tmax at about 1 to 2 h (Fig. 9).
The biological mechanism behind LPS challenge on TNFα release was described previously [23], and a model was therefore constructed to capture that behavior (Fig. 2). Saturable stimulation of TNFα release was seen for the 0.3–30 µg·kg−1 LPS dose range (Fig. 6 left), which is also supported by other studies [9]. There seems to be a fixed time-delay in the onset of TNFα-response of approximately 30 min after the LPS challenge (Fig. 5), which suggests a saturable stimulatory effect of LPS. Similar studies [6, 10–12] have also captured the time-delay before onset of TNFα-response in plasma. Low variability was seen in exposure to test compound, which was captured by the model (Fig. 8 left and Fig. 10 upper row).
Following onset of TNFα-response, the rise of TNFα occurred rapidly (Fig. 5 left) and displayed a peak-shift with increasing LPS challenge (Fig. 11 upper row). The rapid rise and decline of TNFα indicates a high turnover. The extent of drug exposure will then govern the duration of TNFα-response. The current mechanism of action will not allow sufficient inhibition of TNFα release in acute treatment. Both transcriptional and post-transcriptional mechanisms related to test compound [8, 9] have been suggested to influence the TNFα release.
Model regression
Acute cytokine release has previously been modeled with discontinuous functions, allowing the induced formation of TNFα to take place only for a defined period [10–12, 24]. Others have used a continuous model as stimulatory function coupled to transit compartments [6]. However, the present design revealed that following a dose-independent time-delay of 30 min, rapid onset of response and saturable intensity was observed in the TNFα-response. The intensity of response was then followed by a bi-phasic terminal decline in TNFα-response. The bi-phasic decline was captured by a 2-compartment TNFα-response model (Fig. 2). A multi-phasic decline of TNFα-response coupled to rebound after LPS provocations has also been reported for primates [6]. In contrast to the primate study, no rebound was seen in TNFα-response in Sprague–Dawley rats.
The estimated fractional turnover rate of TNFα is 5.65 h−1 in Sprague–Dawley rats, which is consistent with 0.5–4.51 h−1 in mice, 10 h−1 in cynomolgus monkeys and 1.82 h−1 in humans [6, 10–12, 24, 28]. This suggests a fast turnover or short half-life of TNFα in all studied species so far. The transfer rate ks was estimated to about 3.3 h−1, which leads to a delay of peak stimulation of about 1.2 h (Figs. 8 and 9 right). Previously published data support this, reporting TNFα peak concentrations between 1 and 2 h after LPS administration, independently of species [6, 10–12, 24].
The Michaelis–Menten constant of test compound clearance was predicted to be 20 µM (18.2 μmol·L−1, Table 4), which is 1000-fold higher than its potency IC50 (Table 5). Test compound exposure in the 30 mg·kg−1 highest group barely reached 20 µM but stayed close to 10 µM for about 2 h before starting the decline at a slower rate than in the low dose (0.3 mg·kg−1 A) group. The Michaelis–Menten equation suggests that saturation of elimination is occurring and mechanistically this might be due to saturation of drug-metabolizing enzymes and/or drug transporter.
Physiologically, there is no observable baseline concentration of TNFα in blood. The cytokine is only released into blood from activated monocytes in response to an immunological stimulus [29]. The drug-induced inhibition acts on the LPS stimulatory function S(LPS).
The model estimated test compound potency IC50 is about 20 nM (0.0231 μmol·L−1, Table 5) which is consistent with the exploratory data on TNFα-response (Fig. 7). The importance of also incorporating a vehicle control group improves the assessment of how inter-occasion variability may impact, for example, potency and efficacy assessment in highly variable data. Ideally, all substudies should contain vehicle control group(s). The final estimate of Imax suggests that there is a partial reduction in TNFα-response of 70% at the highest test-compound dose of 30 mg·kg−1.
We would also like to highlight the importance of actually measuring the challenger as such, rather than making indirect inferences about its behavior via a biophase model [6]. LPS exposure data would be helpful in future studies to examine whether the inter-individual variability observed in TNFα-response is explained by a variable LPS exposure or not. The uncertainty in the actual LPS exposure will indirectly inflate how accurate and precise the drug parameters, such as IC50 and Imax, are estimated.
Vehicle control data (combined with test compound dose 0 mg·kg−1) of TNFα-response were lacking in Study 2. Therefore, fixed final parameter values of system properties (Study 1) were used to facilitate the regression of test compound specific Imax and IC50 parameters of Study 2. A crossover design measuring TNFα-response following the same LPS challenge with or without drug intervention in each subject may be considered in future designs.
Model simulations
Model simulations were done with a fixed test compound dose (3 mg·kg−1) and increasing LPS challenges (Fig. 11, upper row) in order to illuminate the determinants of onset, intensity and duration of TNFα-response. Predictions show suppression of TNFα peak response proportional to LPS challenge, as well as a peak-shift in TNFα-response with increasing LPS doses. Model simulations were also performed with a fixed challenge dose (30 µg·kg−1) and varying test compound doses (0.03, 0.3 and 3.0 mg·kg−1) (Fig. 11, bottom row). Approximately 70% suppression was seen in TNFα-response with the 3.0 mg·kg−1 dose because Imax was estimated to 0.675. Model-predicted in vivo potency IC50 of test compound is 20 nM (Table 3), which is consistent with experimental data. The test compound exposure covers the 1.0 to 100 nM concentration range, which brackets the potency estimate. Multiple LPS challenges demonstrated a peak-shift in TNFα-response with increasing doses.
LPS exposure should, if possible, be incorporated into future studies to handle the origin of variability seen in TNFα response. Information about the onset, intensity and duration of TNFα response upon LPS challenge and/or test compound intervention may be improved by higher resolution of experimental TNFα response data at pivotal time points [6]. Repeated (sparse) sampling of TNFα response in the same individual after LPS or test compound intervention is still recommended. Table 6 contains a summary of major findings related to the pharmacodynamic time course and suggested improvements of future designs of TNFα response as a biomarker. Table 7 is an attempt to summarize some general points to consider related to topics such as potency, experimental design and target biology.
Table 6.
Summary of major findings and suggested improvements for future designs
| Study | Points to consider | Major findings | Suggested improvement of design |
|---|---|---|---|
| 1 | Delay after LPS dose | Constant delay of 30 min independently of LPS dose | Sampling of systemic LPS exposure. Design(s) for understanding your target. Apply a biophase model of LPS exposure |
| 1 | Peak-shifts in TNFα-response | Peak-shifts in TNFα-response seen with increasing doses of LPS | Sampling of systemic LPS exposure, which may explain some of the peak-shift in TNFα-response |
| 1 | Assessment of saturation of response | Saturation of TNFα-response at higher LPS doses assessed from dose-normalized TNFα-response time courses | Sampling of systemic LPS exposure, which may explain some of the saturation observed in TNFα-response |
| 2 | Baseline response | Vehicle control group was lacking in Study 2 to assess the impact of LPS challenge on TNFα-response | Sampling of systemic LPS exposure. Use cross-over design for determination of LPS-induced TNFα-response with and without test compound |
| 2 | Delay after test compound dose | Delay in onset of TNFα-response upon drug intervention is not observed | Allow higher granularity of test compound exposure |
| 2 | Peak-shifts | No peak-shifts were seen in LPS induced TNFα-response with increasing test compound doses | Sampling of systemic LPS exposure, which may explain lack of peak-shift in TNFα-response with increasing test compound doses |
| 2 | Saturation of response | A maximum inhibitory effect of test compound was obtained in the TNFα-response at an LPS challenge dose of 30 µg·kg−1 | Sampling of systemic LPS exposure, which may explain some of the saturation observed in TNFα-response with increasing test compound doses |
Table 7.
Points to consider when modelling cytokine challenge test data
| Topic | Points to consider |
|---|---|
| General | High interest in modelling challenge test data, but a robust quantitative approach is still in its infancy. More diverse datasets and models are needed |
| Potency |
Drug screening and clinical efficacy are primarily driven by in vitro and ex vivo whole-blood (WB) assays where cytokine release is measured after LPS challenge in vitro. The primary questions relate to the predictive power of WB assays. What is the role of blood-born versus tissue-born cells? The in vivo/in vitro correlation IVIVC may give some guidance with respect to potential clinical outcome, where only WB is available at an early stage. The IVIVC with respect to biochemical target may also exclude off-target effects IC50 is approximately 20 nM. In vivo potency is a conglomerate of binding (affinity, koff and kon), target turnover (kdeg) and ligand-target complex kinetics (ke(RL)) [32, 33]. This new expression enables a more efficient species-to-species comparison of pharmacodynamic properties. Imax gives insight about whether full or partial TNFα suppression is possible (tissues responding to LPS but lacking the target) |
| Study design | The TNFα-response is rapid and transient, which is a challenge in experimental design. Small time-differences may result in large baseline observations, and therefore cause erroneous assessment of drug inhibition. This is an argument against single (end) point studies and favor biomarker time courses. Vehicle control groups should be included in all substudies |
| Target biology | Can a mechanism-based model cast light on LPS acting on precursor pool-driven release of TNFα (post-translational effects) or mRNA-driven induction (transcriptional effects)? The onset of TNFα release is rapid, suggesting post-translational mechanisms. Can better insight be accomplished (depletion of precursor pool/efficacy after repeated dosing)? Is there a risk of tachyphylaxia with either mechanism? |
| Dosing regimens | Is the drug mechanism curative or prophylactic? If prophylactic, how should the dose be given optimally, and what are the pharmacokinetic requirements? What is the translational potential of the model across species? Are human systems parameters predictable from animal data? |
Overall conclusion
A mechanism-based biomarker model of TNFα-response, including different external provocations of LPS challenge and test compound intervention, was developed to serve as a modelling tool. The model contained system properties (such as kt, kout), challenge characteristics (such as ks, kLPS, Km, LPS, Smax, SC50) and test- compound-related parameters (Imax, IC50). The exposure to test compound was modelled by means of first-order input and Michaelis–Menten type of nonlinear elimination. Test compound potency was estimated to 20 nM with a 70% partial reduction in TNFα-response at the highest dose of 30 mg·kg−1. Future selection of drug candidates may focus the estimation on potency and efficacy applying the selected structure consisting of TNFα system and LPS challenge characteristics. A related aim was to demonstrate how an exploratory (graphical) analysis may guide us to a tentative model structure, which enables us to better understand target biology. The analysis demonstrated how to tackle a biomarker with a baseline below the limit of detection. Repeated LPS-challenges may also reveal how the rate and extent of replenishment of TNFα pools occur. Lack of LPS exposure-time courses was solved by including a biophase model, with the underlying assumption that TNFα response time courses as such contain kinetic information. A transduction type of model with non-linear stimulation of TNFα release was finally selected. Typical features of a challenge experiment were shown by means of model simulations. Experimental shortcomings of present and published designs were identified and discussed. The final model coupled to suggested guidance rules may serve as a general basis for the collection and analysis of pharmacological challenge data of future studies.
Electronic supplementary material
Below is the link to the electronic supplementary material.
Acknowledgements
Felix Held was supported by a research Grant from Grünenthal GmbH. The studies were conducted and monitored by Guilan Sun, Weihua Gu, Jun Huang, Yifan Yang, and Lilly Xu at Shanghai ChemPartner Co., Ltd. Michael Gautrois provided valuable input to the project. This work was also partially funded by the Swedish Foundation for Strategic Research.
Appendix 1
Principal parts of the model
The model described in Eqs. 1–7 was formulated based on five central observations in data, namely (1) LPS dose-independent delay of onset of TNFα-response; (2) LPS dose-dependent duration of TNFα-response; (3) LPS challenge has a saturable stimulatory impact on the TNFα-response; (4) test compound has a saturable inhibitory impact on the TNFα-response; (5) TNFα-response declines in a bi-phasic fashion post-peak.
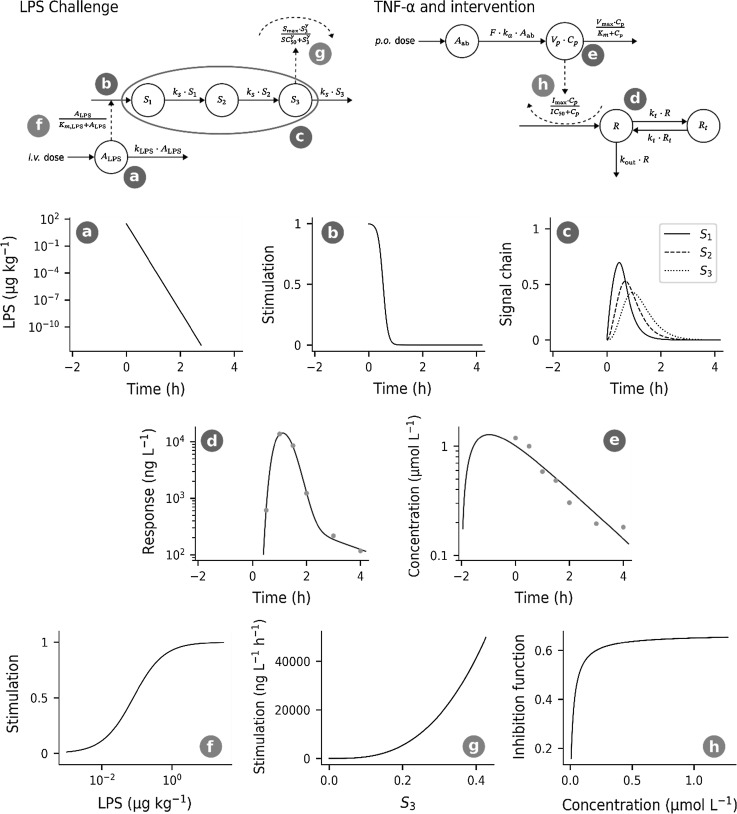
The onset of TNFα-response was delayed about 30 min independently of LPS challenge dose (Fig. 5, left). The combination of a time-limited constant input signal, transportation through a chain of delay compartments and a nonlinear (sigmoid) stimulatory function captures data nicely for all LPS challenges. Using a first-order input/output biophase model for the LPS kinetics (Eq. 3; Fig. 13a) combined with a saturable stimulatory function (Eq. 4; Fig. 13b) gave constant time-limited stimulatory input of TNFα. Higher LPS doses will increase the time during which the input signal is totally saturated, which explains the LPS dose-dependent duration of TNFα-response. This input signal is transported through a series of transduction compartments (Eq. 4; Fig. 13c), which explains the delay of onset of TNFα-response. Stimulation of TNFα release is then captured by means of a saturable function (Eq. 5; Fig. 13g), which explains the rapid onset of TNFα-response.
Fig. 13.
Presentation of time courses and auxiliary relationships in the model for a single subject after LPS challenge (30 μg·kg−1) and test-compound administration (3 mg·kg−1). Blue labels mark concentration–time courses, whereas red labels mark relationships between different quantities in the model. LPS biophase concentration is shown in plot a, the time-dependent stimulation of signal compartment S1 in plot b and the concentrations in the three signal compartments S1 to S3 in plot c. In plots d and e, showing response and test compound concentration, observed data is included. Plot f shows the relationship of concentration in the LPS biophase and the stimulation of signal compartment S1. In plots g and h the stimulation and inhibition of the TNFα-response are shown over concentration in compartment S3 and drug concentration Cp, respectively (Color figure online)
The saturable stimulatory impact of LPS challenge on TNFα-response is summarized in Fig. 6 (left), which is described by Eq. 5. Increasing the dose of test-compound had a nonlinear inhibitory effect on TNFα-response (Fig. 6, right), which is captured by Eq. 6. The post-peak bi-phasic decline in TNFα-response (Fig. 5, right) was modelled by inclusion of a peripheral response compartment Rt (Eq. 7).
Computational details
Parameter selection for NLME modelling
To determine which parameters had a large influence on the model-predicted TNFα concentration, a variance-based sensitivity analysis was conducted using the Sobol method [14]. The Python (Python Software Foundation, https://www.python.org, version 3.6) package SALib [15] was used for this analysis. Additionally, complementary roles of parameters (e.g. Smax and SC50 both influence peak TNFα concentration) were considered and parameters exhibiting larger IIV during test runs were preferred when deciding what parameters to associate with IIV or not for NLME modelling. Both Imax and IC50 were of great interest in this study and were therefore modelled with IIV. Resulting from this analysis, the following distributions were assigned to parameters: Vmax (Eq. 2) normally distributed, kLPS (Eq. 3), SC50 (Eq. 5) and kout (Eq. 7) and IC50 (Eq. 6) log-normally distributed, and Imax (Eq. 6) logit-normally distributed. No correlations between random effects were included in the model.
Identifiability analysis
A basic prerequisite for parameter estimation of a complex model is for the model to be structurally identifiable, given observed variables. Structurally identifiable means that any two distinct sets of parameters of a model will not result in identical observations, i.e., parameter values are uniquely determined by observed data. The model Eqs. 1–7 were checked for local structural identifiability using the Exact Arithmetic Rank (EAR) algorithm [16–18]. The Wolfram Mathematica (Wolfram Research Inc., Version 11.1) package IdentifiabilityAnalysis (see Karlsson et al. [17] for a theoretical description; implemented at the Fraunhofer-Chalmers Centre) was used for this analysis. The basic EAR algorithm requires the model equations to be rational functions. However, a larger class of system can be addressed by EAR by transformations demonstrated in Reference [19].
Model and convergence checking
Parameter convergence was assessed by repeated estimation using different initial values for parameters leading to sets of parameter estimates in close proximity to each other. Standard errors, derived from a stochastic approximation of the Fisher information matrix, were as low as possible. Individual parameters were simulated from the conditional parameter distribution and statistical parameter models were checked by comparison of simulated individual parameters to the theoretical distributions [21]. Model fit was assessed through the investigation of individual and population residuals and their distributions as well as visual predictive checks [22].
Appendix 2
Contributions from inflammation and drug intervention at equilibrium
Model simulations using Eq. 8 showing the joint impact of exposure (Cp) and LPS stimuli (S3) on TNFα-response (left), and exposure (Cp) and biophase amount of LPS (ALPS) on TNFα-response (right).
Footnotes
Publisher's Note
Springer Nature remains neutral with regard to jurisdictional claims in published maps and institutional affiliations.
Contributor Information
Felix Held, Email: felix.held@chalmers.se.
Johan Gabrielsson, Email: johan.gabrielsson@slu.se.
References
- 1.Bondeson J. The mechanisms of action of disease-modifying antirheumatic drugs: a review with emphasis on macrophage signal transduction and the induction of proinflammatory cytokines. Gen Pharmacol. 1997;29:127–150. doi: 10.1016/S0306-3623(96)00419-3. [DOI] [PubMed] [Google Scholar]
- 2.Medzhitov R. Origin and physiological roles of inflammation. Nature. 2008;454:428–435. doi: 10.1038/nature07201. [DOI] [PubMed] [Google Scholar]
- 3.Wollenberg G, DeForge L, Bolgos G, Remick D. Differential expression of tumor necrosis factor and interleukin-6 by peritoneal macrophages in vivo and in culture. Am J Pathol. 1993;143:1121–1130. [PMC free article] [PubMed] [Google Scholar]
- 4.Beck G, Bottomley G, Bradshaw D, Brewster M, Broadhurst M, Devos R, Hill C, Johnson W, Kim HJ, Kirtland S, Kneer J, Lad N, Mackenzie R, Martin R, Nixon J, Price G, Rodwell A, Rose F, Tang JP, Walter DS, Wilson K, Worth E. (E)-2(R)-[1(S)-(Hydroxycarbamoyl)-4-phenyl-3-butenyl]-2’-isobutyl-2’-(methanesulfonyl)-4-methylvalerohydrazide (Ro 32-7315), a selective and orally active inhibitor of tumor necrosis factor-alpha convertase. J Pharmacol Exp Ther. 2002;302:390–396. doi: 10.1124/jpet.302.1.390. [DOI] [PubMed] [Google Scholar]
- 5.Zhang Y, Xu J, Levin J, Hegen M, Li G, Robertshaw H, Brennan F, Cummons T, Clarke D, Vansell N, Nickerson-Nutter C, Barone D, Mohler K, Black R, Skotnicki J, Gibbons J, Feldmann M, Frost P, Larsen G, Lin LL. Identification and characterization of 4-[[4-(2-butynyloxy)phenyl]sulfonyl]-N-hydroxy-2,2-dimethyl-(3S)thiomorpholinecarboxamide (TMI-1), a novel dual tumor necrosis factor-alpha-converting enzyme/matrix metalloprotease inhibitor for the treatment of rheumatoid arthritis. J Pharmacol Exp Ther. 2004;309:348–355. doi: 10.1124/jpet.103.059675. [DOI] [PubMed] [Google Scholar]
- 6.Gabrielsson J, Hjorth S, Vogg B, Harlfinger S, Gutierrez PM, Peletier L, Pehrson R, Davidsson P. Modeling and design of challenge tests: inflammatory and metabolic biomarker study examples. Eur J Pharm Sci. 2015;67:144–159. doi: 10.1016/j.ejps.2014.11.006. [DOI] [PubMed] [Google Scholar]
- 7.Scheller J, Chalaris A, Garbers C, Rose-John S. ADAM17: a molecular switch to control inflammation and tissue regeneration. Trends Immunol. 2011;32:380–387. doi: 10.1016/j.it.2011.05.005. [DOI] [PubMed] [Google Scholar]
- 8.Gobejishvili L, Avila DV, Barker DF, Ghare S, Henderson D, Brock G, Kirpich IA, Joshi-Barve S, Mokshagundam SP, McClain CJ, Barve S. S-adenosylmethionine decreases lipopolysaccharide-induced phosphodiesterase 4B2 and attenuates tumor necrosis factor expression via cAMP/protein kinase A pathway. J Pharmacol Exp Ther. 2011;337:433–443. doi: 10.1124/jpet.110.174268. [DOI] [PMC free article] [PubMed] [Google Scholar]
- 9.Wyatt TA, Poole JA, Nordgren TM, DeVasure JM, Heires AJ, Bailey KL, Romberger DJ. cAMP-dependent protein kinase activation decreases cytokine release in bronchial epithelial cells. Am J Physiol Lung Cell Mol Physiol. 2014;307:L643–651. doi: 10.1152/ajplung.00373.2013. [DOI] [PMC free article] [PubMed] [Google Scholar]
- 10.Gozzi P, Påhlman I, Palmér L, Grönberg A, Persson S. Pharmacokinetic-pharmacodynamic modeling of the immunomodulating agent susalimod and experimentally induced tumor necrosis factor-α levels in the mouse. J Pharmacol Exp Ther. 1999;291:199–203. [PubMed] [Google Scholar]
- 11.Chakraborty A, Yeung S, Pyszczynski NA, Jusko WJ. Pharmacodynamic interactions between recombinant mouse interleukin-10 and prednisolone using a mouse endotoxemia model. J Pharm Sci. 2005;94:590–603. doi: 10.1002/jps.20257. [DOI] [PMC free article] [PubMed] [Google Scholar]
- 12.Wyska E. Pharmacokinetic-pharmacodynamic modeling of methylxanthine derivatives in mice challenged with high-dose lipopolysaccharide. Pharmacology. 2010;85:264–271. doi: 10.1159/000288734. [DOI] [PubMed] [Google Scholar]
- 13.Ette EI, Williams PJ. Pharmacometrics: The science of quantitative pharmacology. New York: Wiley-Interscience; 2007. [Google Scholar]
- 14.Saltelli A, Ratto M, Andres T, Campolongo F, Cariboni J, Gatelli D, Saisana M, Tarantola S. Global sensitivity analysis. The Primer. Chichester: Wiley; 2008. [Google Scholar]
- 15.Herman J, Usher W. SALib: an open-source Python library for sensitivity analysis. J Open Source Softw. 2017 [Google Scholar]
- 16.Anguelova M, Karlsson J, Jirstrand M. Minimal output sets for identifiability. Math Biosci. 2012;239:139–153. doi: 10.1016/j.mbs.2012.04.005. [DOI] [PubMed] [Google Scholar]
- 17.Karlsson J, Anguelova M, Jirstrand M (2012) An efficient method for structural identifiability analysis of large dynamic systems. 16th IFAC Symposium on System Identification (SYSID 2012) 16:941–946
- 18.Raue A, Karlsson J, Saccomani MP, Jirstrand M, Timmer J. Comparison of approaches for parameter identifiability analysis of biological systems. Bioinformatics. 2014;30:1440–1448. doi: 10.1093/bioinformatics/btu006. [DOI] [PubMed] [Google Scholar]
- 19.Andersson R, Kroon T, Almquist J, Jirstrand M, Oakes ND, Evans ND, Chappel MJ, Gabrielsson J. Modeling of free fatty acid dynamics: insulin and nicotinic acid resistance under acute and chronic treatments. J Pharmacokinet Pharmacodyn. 2017;44:203–222. doi: 10.1007/s10928-017-9512-6. [DOI] [PMC free article] [PubMed] [Google Scholar]
- 20.Lixoft SAS (2018) Monolix version 2018R2. http://lixoft.com/products/monolix/. Accessed 4 Aug 2018
- 21.Karlsson MO, Savic RM. Diagnosing model diagnostics. Clin Pharmacol Ther. 2007;82:17–20. doi: 10.1038/sj.clpt.6100241. [DOI] [PubMed] [Google Scholar]
- 22.Holford N (2005) The visual predictive check—superiority to standard diagnostic (Rorschach) plots. Abstracts of the Annual Meeting of the Population Approach Group in Europe. https://www.page-meeting.org/?abstract=738. Accessed 18 Nov 2018
- 23.Jaffer U, Wade RG, Gourlay T. Cytokines in the systemic inflammatory response syndrome: a review. HSR Proc Intensive Care Cardiovasc Anesth. 2010;2:161–175. [PMC free article] [PubMed] [Google Scholar]
- 24.Shu C, Zhou H, Afsharvand M, Duan L, Zhang H, Noveck R, Raible D. Pharmacokinetic-pharmacodynamic modeling of apratastat: a population-based approach. J Clin Pharmacol. 2011;51:472–481. doi: 10.1177/0091270010372389. [DOI] [PubMed] [Google Scholar]
- 25.Xiang L, Hu Y-F, Wu J-S, Wang L, Huang W-G, Xu C-S, Meng X-L, Wang P. Semi-mechanism-based pharmacodynamic model for the anti-inflammatory effect of baicalein in LPS-stimulated RAW264.7 macrophages. Front Pharmacol. 2018;9:793. doi: 10.3389/fphar.2018.00793. [DOI] [PMC free article] [PubMed] [Google Scholar]
- 26.Yates JWT, Das S, Mainwaring G, Kemp J. Population pharmacokinetic/pharmacodynamic modelling of the anti-TNF-α polyclonal fragment antibody AZD9773 in patients with severe sepsis. J Pharmacokinet Pharmacodyn. 2012;39:591–599. doi: 10.1007/s10928-012-9270-4. [DOI] [PubMed] [Google Scholar]
- 27.Wang Q, Zhang Y, Hall JP, Lin L-L, Raut U, Mollova N, Green N, Cuozzo J, Chesley S, Xu X, Levin JI, Patel VS. A rat pharmacokinetic/pharmacodynamic model for assessment of lipopolysaccharide-induced tumor necrosis factor-alpha production. J Pharmacol Toxicol Methods. 2007;56:67–71. doi: 10.1016/j.vascn.2007.02.001. [DOI] [PubMed] [Google Scholar]
- 28.Veszelovszky E, Holford NHG, Thomsen LL, Knowles RG, Baguley BC. Plasma nitrate clearance in mice: modeling of the systemic production of nitrate following the induction of nitric oxide synthesis. Cancer Chemother Pharmacol. 1995;36:155–159. doi: 10.1007/BF00689201. [DOI] [PubMed] [Google Scholar]
- 29.Malerich P, Elston DM. Introduction to TNF/pathophysiology of TNF. In: Weinberg JM, Buchholz R, editors. TNF-alpha inhibitors. Basel: Birkhäuser-Verlag; 2006. pp. 1–8. [Google Scholar]
- 30.Ariga M, Neitzert B, Nakae S, Mottin G, Bertrand C, Pruniaux MP, Jin S-LC, Conti M. Nonredundant function of phosphodiesterases 4D and 4B in neutrophil recruitment to the site of inflammation. J Immunol. 2004;173:7531–7538. doi: 10.4049/jimmunol.173.12.7531. [DOI] [PubMed] [Google Scholar]
- 31.Jin SL, Lan L, Zoudilova M, Conti M. Specific role of phosphodiesterase 4B in lipopolysaccharide-induced signaling in mouse macrophages. J Immunol. 2005;175:1523–1531. doi: 10.4049/jimmunol.175.3.1523. [DOI] [PubMed] [Google Scholar]
- 32.Gabrielsson J, Peletier LA. Pharmacokinetic steady-states highlight interesting target-mediated disposition properties. AAPS J. 2017;19:772–786. doi: 10.1208/s12248-016-0031-y. [DOI] [PubMed] [Google Scholar]
- 33.Gabrielsson J, Peletier LA, Hjorth S. In vivo potency revisited—keep the target in sight. Pharmacol Ther. 2018;184:177–188. doi: 10.1016/j.pharmthera.2017.10.011. [DOI] [PubMed] [Google Scholar]
Associated Data
This section collects any data citations, data availability statements, or supplementary materials included in this article.


