Abstract
We evaluated two anthracene derivatives with covently attached boronic acid groups for fluorescence-lifetime-based sensing of glucose. These anthracene derivatives also contained alkyl amino groups, which quenched the anthracene emission by photo-induced electron transfer. Both anthracene derivatives displayed increased intensities and lifetime in the presence of glucose, as seen from the frequency-domain measurements. A fluorescence lifetime change from 9.8 to 12.4 and 5.7 to 11.8 ns is observed, after the addition of glucose, for the anthracene substituted with one and two boronic acid groups, respectively. This results in a change in the phase angle up to 15° and 30° and in the modulation up to 12 and 25% at 30 MHz for these compounds, respectively. Titration curves in the presence of BSA and micelles are also presented to show the potential interferences from biomolecules. Dissociation constants were evaluated for both compounds, and association with glucose was found to be reversible. Importantly, the apparent glucose binding constants are about 5- to 10-fold smaller with phase, modulation, or mean lifetime than with intensities measurements, shifting the glucose-sensitive range to physiological values. Combining these results and the use of a simple UV-LED as excitation source, the results show an interesting potential of these two compounds in the development of lifetime base devices using synthetic probes for glucose.
Determination of the glucose concentration is important for people with diabetes. Large variations in blood glucose level result in important health problems including cardiovascular disease, neuropathies, and blindness (1, 2). Noninvasive measurements of blood glucose have been a long-standing research goal. To date, a wide variety of methods have been described in the literature, including near-infrared spectroscopy (3–5), optical rotation (6, 7), amperometric (8, 9), colorimetric (10, 11), and fluorescence detection (12–16). Despite some promising results, these methods show limitations. For example, the NIR technique shows excessive background and the optical rotation technique shows low optical rotation and depolarization due to the tissue. At present, the most reliable method to measure blood glucose is by finger stick and subsequent glucose measurement, typically by glucose oxidase (17). Competitive glucose assays using fluorescence resonance energy transfer between concanavalin A and dextran have been developed (13–15, 18). There also have been efforts to use the fluorescence change of labeled apoglucose oxidase (16). Proteins and enzymes have the advantage of showing affinity constants comparable with the blood glucose level and high selectivity. Despite these advantages, proteins show low stability with heat and organic solvents and modifying their overall properties is difficult. Hence, the development of synthetic glucose probes remains an important goal for biomedical research. The flexibility of organic synthesis and the robustness of the organic probes provided additional possibilities in developing nonconsuming glucose sensors.
The boronic acid group is known to covalently bind saccharides and other diols (19–21). The use of the boronic acid group for the recognition of saccharide has been widely studied by Shinkai, James, and their collaborators (22–26). Depending on the structure of the molecule and on the number of boronic acid groups present, dissociation constants from micromolar to tens of millimolar can be obtained and a chiral discrimination has also been observed (27). A delivery system for insulin has also been developed using boronic acid gels (28, 29).
Photo-induced electron transfer (PET)2 is often used as a mechanism for fluorescence quenching in the development of sensors (30). This quenching is due to the rich electron amino group near the fluorophore. When an analyte (ions for almost all the cases) bonds the probe, the interaction between the analyte and the nitrogen lone pair electrons removes this quenching and an increase of the fluorescence of the probe is observed. This mechanism has been used with anthrancene derivatives containing amino and phenyl boronic acid groups for the design of glucose probes (31). In that case, the mechanism proposed is slightly different. Changes in the acidity of the boron group and in the interaction between the boron atom and the nitrogen atom, in the presence of glucose, are responsible for the intensity changes observed. A detailed explanation of the intermediates involving in these equilibra can be found in Ref. (31). These anthracene probes for saccharide also have been successfully adapted to build polymers for the development of glucose-response devices (32, 33). To date, no study using the fluorescence lifetime on these systems could be found.
The use of decay times, as opposed to intensities, is preferred because the decay times are mostly independent of the probe concentration or the intensity of the fluorescence signal. The frequency-domain or phase-modulation method for sensing is now well recognized for its instrumental simplicity, rapid data acquisition, and the ability to detect small changes in phase angle or lifetime. A mean lifetime can be measured at a single modulation frequency using simple light-emitting diodes or laser diodes as the excitation source (34, 35). Importantly, lifetimes can be measured in highly scattering media (36, 37), and have been successfully measured through several layers of skin (38). This has suggested that lifetime-based sensing of glucose could be used for transdermal minimally invasive glucose measurements. In this study we describe the introduction of two anthracene compounds (Fig. 1) as the lifetime probe for glucose. These probes show decreased PET quenching by the amino groups upon glucose binding to the boronic acid groups. To demonstrate the possibility of practical glucose sensor, the fluorescence lifetimes were obtained with the phase-modulation method and the excitation provided by a UV-LED source. The results show a considerable glucose-dependent change in the phase angle and in the modulation for both compounds. Titration curves in the presence of BSA and micelles have been measured to evaluate the possible interference in biological environments. These compounds show a complete reversibility of the association between the boronic acid group and glucose, making them useful as nonconsuming glucose sensors.
FIG. 1.
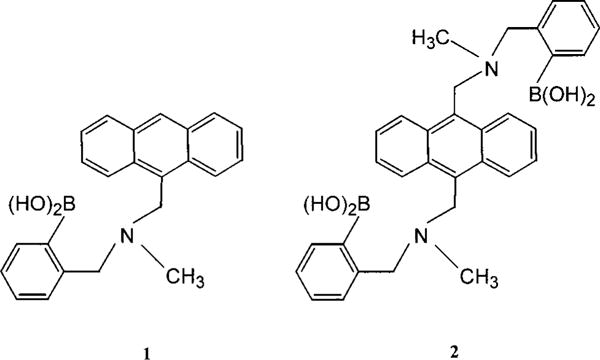
Molecular structure of the two probes investigated.
MATERIALS AND METHODS
D-Glucose and BSA were purchased from Sigma. Sodium dodecyl sulfate (SDS) was purchased from ICN Biochemicals. Cetyltrimethylammonium bromide (HDTBr) was purchased from Sigma. 9-[[N-Methyl-N-(o-boronobenzyl)amino]methyl]anthracene (1) and 9,10-bis[[N-methyl-N-(o-boronobenzyl)amino]methyl]-anthracene (2) were synthesized according to procedures described in the literature (31).
Steady-state fluorescence measurements were performed in a 1-cm quartz cuvette in an ISS spectrofluorometer. For all measurements, the OD of the samples did not exceed 0.1 and solutions are stirred. Stability (KS) and dissociation (KD) constants were obtained by fitting the titration curves using the relation
| [1] |
and using the relation KD = (1/KS). Frequency-domain (FD) measurements were performed using instrumentation described previously (39). An amplitude-modulated UV-LED was used as the given light source and the peak intensity centered around 370 nm. Emission was observed through a 415-nm cutoff and a 420-nm interference filter. The FD intensity decay data were analyzed by nonlinear least squares in terms of the multiexponential model
| [2] |
where αi is the preexponential factor associated with the decay time τi, with Σi αi = 1.0. We used global analysis in which two lifetimes were used for all glucose concentrations. The mean lifetime is given by
| [3] |
where fi is the fractional steady-state intensity of each lifetime component:
| [4] |
RESULTS
Steady-State Measurements
Emission spectra and corresponding titration curves for 1 and 2 are presented in Figs. 2 and 3, respectively. Stability constants (KS) and dissociation constants (KD) are presented in Table 1, KD = 1/KS. As discussed in the literature (31), the change in the intensity is attributed to the removal of the PET quenching due to the interaction between the boron and nitrogen atoms following the binding with glucose. In an attempt to determine the possible interference from proteins or lipids, titration curves were also measured in the presence of BSA and two detergents, one with a negative-charged head group (HDTBr) and the other with a positive-charged head group (SDS). BSA has little effect on the titration curve of 1 and no effect for compound 2. The effect of BSA on compound 1 could be the result of an interaction between these two compounds. However, because the measurements are taken in a mixture of methanol and water, aggregation could not be neglected. Both compounds 1 and 2 show a relatively low solubility due to the high hydrophibicity of both the anthracene and phenyl moieties. To obtain reproducible titration curves, we used vigorous stirring and waited about 2 min prior to recording the spectra. In the presence of micelles, a complete inhibition of the intensity change is observed. These results suggest that, in presence of micelles, the probes are located in the micelle and cannot interact with the glucose present in solution. For compound 1, the dissociation constant is in the millimolar range, which is characteristic of the boronic acid group (23, 25, 26, 40). For compound 2, this dissociation constant goes down to the submillimolar range. This is due to the ability of both boronic acid groups present on compound 2 to bind one molecule of glucose. This is characteristic not only of this compound, but also is general for the majority of glucose probes possessing two boronic acid linker groups (27, 31, 41, 42).
FIG. 2.
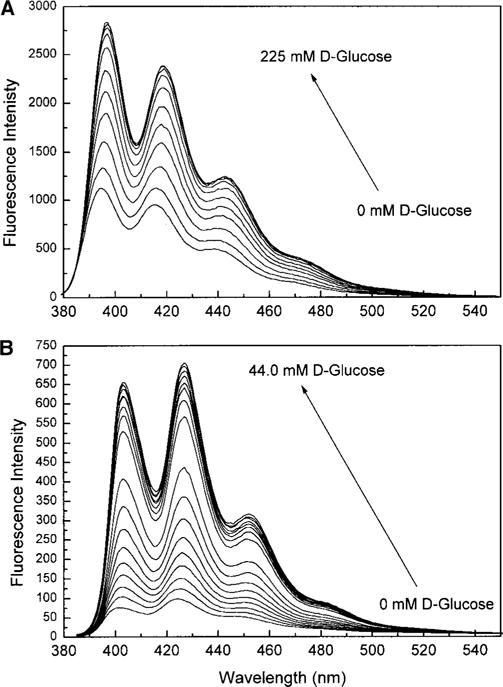
Fluorescence spectral changes of 1 (A) and 2 (B) in methanol:phosphate buffer, pH 7.7 (1:2). λex: 365 and 380 nm for 1 and 2, respectively. Measured at room temperature.
FIG. 3.
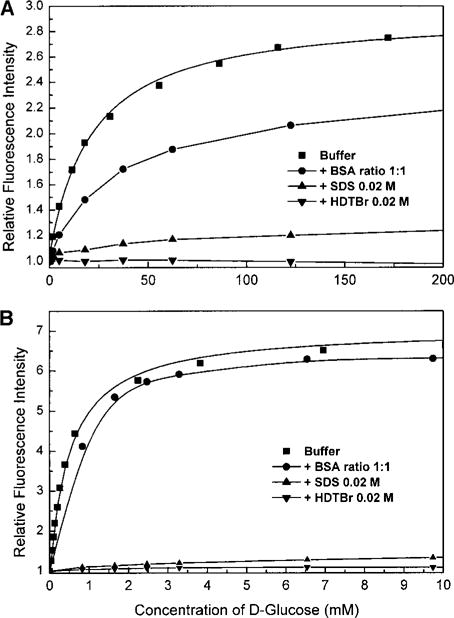
Titration curves against D-glucose obtained with the steady-state intensity for 1 (A) and 2 (B) in the absence and presence of BSA and micelles. λem: 420 and 425 nm for 1 and 2, respectively.
TABLE 1.
Stability Constant (KS) and Dissociation Constant (KD) for 1 and 2 for a 1:1 Complexing between the Boronic Acid Group and D-Glucose
| Properties | Log KS | KD (mM) |
|---|---|---|
| 1 | ||
| Steady-state intensity | 1.67 (±0.03) | 21.3 (±1.1) |
| Global mean lifetime | 2.35 (±0.08) | 4.6 (±0.7) |
| Phase angle | 2.21 (±0.08) | 6.3 (±1.1) |
| Modulation | 2.29 (±0.15) | 5.4 (±1.8) |
| 2 | ||
| Steady-state intensity | 3.30 (±0.03) | 0.51 (±0.03) |
| Global mean lifetime | 4.17 (±0.06) | 0.069 (±0.009) |
| Phase angle | 3.98 (±0.03) | 0.105 (±0.008) |
| Modulation | 4.23 (±0.05) | 0.061 (±0.007) |
Note. Measured in methanol:phosphate buffer, pH 7.7 (1:3).
Frequency-Domain Measurements
Figure 4 shows the frequency domain intensity decays for 1 and 2. For both probes, the frequency responses display a significant shift to low-modulation frequencies with the addition of D-glucose, indicating a longer mean lifetime in the presence of glucose. These results are consistent with the decrease of the PET quenching in the presence of glucose. The intensity decays, for both probes, were satisfactorily fitted to the two-exponential model in the absence and presence of glucose, except a single-exponential model was satisfactorily fit in the presence of a high concentration of glucose. For both compounds, a short lifetime (τ1 in Tables 2 and 3) component is present and shows an important contribution (α1) of the mean lifetime in the absence of glucose. This component increases in lifetime while the contribution in the mean lifetime decreases with the addition of glucose until the decay profile becomes monoexponential. Compound 2 shows a smaller mean lifetime in comparison with 1, 5.7 vs 9.8 ns, respectively, in the absence of glucose. At the saturation limit, both compounds show a much more similar mean lifetime, 11.8 vs 12.4 ns for 2 and 1, respectively. The smaller mean lifetime of 2 without glucose is probably due to the more efficient quenching when two amino groups are present on the molecule in comparison with one amino group for 1. The similar lifetime observed for both compounds and monoexponential decay for 2, at the saturation limit, imply not only that both boronic acid groups are involved in the binding with glucose as suggested with the steady-state results but also that both boronic acid groups interact with the nitrogen atom, causing a removal of the PET quenching similar to that observed for compound 1.
FIG. 4.
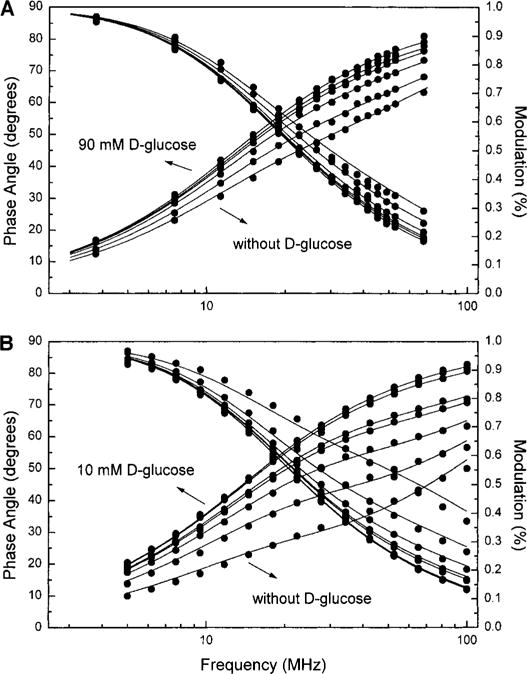
D-Glucose effect on the frequency-domain decay profiles for 1 (A) and 2 (B) in the absence and presence of D-glucose in methanol: phosphate buffer, pH 7.7 (1:2). The lines represented the global fits with two lifetimes.
TABLE 2.
Global Intensity Decay Analysis of 1 in Methanol:Phosphate Buffer, pH 7.7 (1:2)
| Concn. D-Glu (mM) |
α1 | α2 | f1a | f2a |
|
|
|---|---|---|---|---|---|---|
| 0 | 0.61 | 0.39 | 0.28 | 0.72 | 9.8 | |
| 1.7 | 0.47 | 0.53 | 0.18 | 0.82 | 10.7 | |
| 8.3 | 0.28 | 0.72 | 0.09 | 0.91 | 11.5 | |
| 21.3 | 0.15 | 0.85 | 0.04 | 0.96 | 12.0 | |
| 34.2 | 0.09 | 0.91 | 0.02 | 0.98 | 12.2 | |
| 59.5 | 0.0 | 1.0 | 0.0 | 1.0 | 12.4 | |
| 90.2 | 0.0 | 1.0 | 0.0 | 1.0 | 12.4 |
Note. τ1 = 3.1 ns, τ2 = 12.4 ns and .
Contribution to the steady-state intensity.
TABLE 3.
Global Intensity Decay Analysis of 2 in Methanol:Phosphate Buffer, pH 7.7 (1:2)
| Concn. D-Glu (mM) |
α1 | α2 | f1a | f2a |
|
|
|---|---|---|---|---|---|---|
| 0 | 0.88 | 0.12 | 0.52 | 0.48 | 6.4 | |
| 0.066 | 0.73 | 0.27 | 0.29 | 0.71 | 8.7 | |
| 0.132 | 0.57 | 0.43 | 0.16 | 0.84 | 9.9 | |
| 0.261 | 0.40 | 0.60 | 0.09 | 0.91 | 10.6 | |
| 0.326 | 0.34 | 0.64 | 0.07 | 0.93 | 10.8 | |
| 2.24 | 0.07 | 0.93 | 0.01 | 0.99 | 11.4 | |
| 3.82 | 0.0 | 1.0 | 0.0 | 1.0 | 11.5 | |
| 10.1 | 0.0 | 1.0 | 0.0 | 1.0 | 11.5 |
Note. τ1 = 1.7 ns, τ2 = 11.5 ns and .
Contribution to the steady-state intensity.
Titration curves obtained with the mean lifetime and with the phase angle and modulation are shown in Figs. 5 and 6, respectively, for both compounds. Despite a relatively small mean lifetime change, compound 1 shows an interesting change in the phase angle and modulation at 30 MHz (Fig. 6A). This is due to the fact that the short lifetime component becomes less important and gradually the decays become more monoexponential with the addition of glucose. For compound 2, the combination of the larger mean lifetime change and the decrease of the short lifetime component results in a larger change in the phase angle and modulation in the presence of glucose. Stability constants and dissociation constants are presented in Table 1. The apparent dissociation constants obtained with the mean lifetime, phase angle, and modulation show a 5- to 10-fold decrease in comparison with the KD obtained with the steady-state intensity change. Using the frequency domain measurements, probe 1 shows sensitivity for glucose in the range of few millimolar while the sensitivity for 2 is in the range of few tens of micromolar. This is due to the more important contribution of the complex (probe with analyte) on the lifetime because of the higher quantum yield and longer lifetime of the latter (36, 43). As shown in Fig. 5, the presence of BSA does not interfere in the interaction between the probes and glucose. The effect of BSA on the titration curve of 1 (Fig. 5A) is much less than that observed with the steady state, suggesting that the effect observed with the steady state could be due to an artifact like aggregation as discussed in the previous section.
FIG. 5.
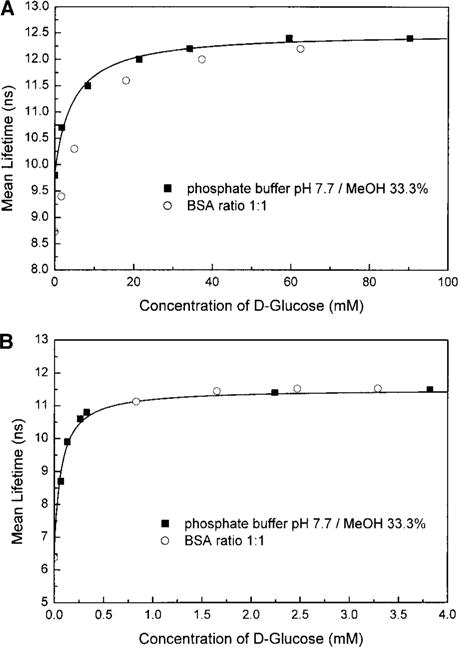
Titration curves against D-glucose obtained with the global frequency-domain intensity decays for 1 (A) and 2 (B) in the absence and presence of BSA.
FIG. 6.
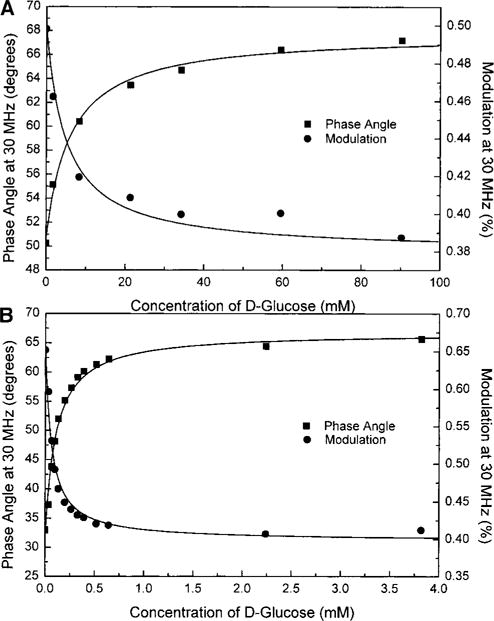
Effect of glucose on modulation and phase angle measured at 30 MHz for 1 (A) and 2 (B).
Figure 7 shows the effect of dilution on the mean lifetime for 1 (Fig. 7A) and 2 (Fig. 7B). The dilution is done with solvent only and not with a solution of free probes. As is shown on Fig. 7, dilution results in a decrease of the mean lifetime. This decrease reverses the increase obtained by the addition of glucose. This confirms that the association equilibrium between the probe and the glucose is independent of the concentration of the probes, as assumed in the literature and suggested by the utilization of a single order model in the fitting of the titration curves. It also shows that the covalent bond between the boronic acid group and the saccharide is completely reversible.
FIG. 7.
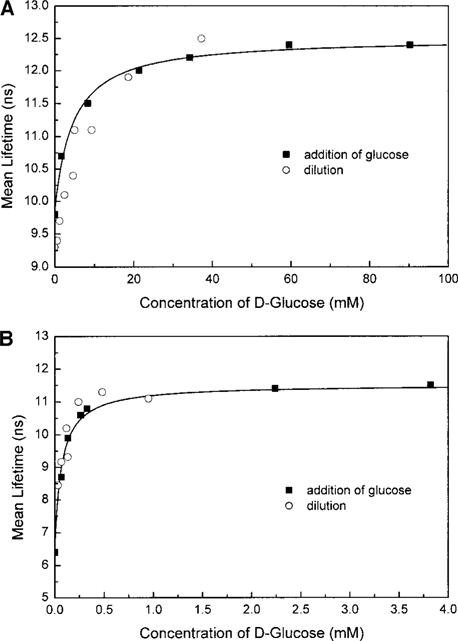
Dilution effect on the global mean lifetime for 1 (A) and 2 (B) in methanol:phosphate buffer, pH 7.7 (1:2).
DISCUSSION
The development of synthetic probes combined with the development in fluorescence sensing is an interesting way for the improvement and/or for new approaches in glucose sensing. The two synthetic probes described here show interesting intensity changes combined with different affinities for glucose. In addition, these probes also show a substantial change in the fluorescence intensity decay profiles in response to the glucose. Combining this with the fact that a simple UV-LED could be used as a light source, these two probes are very promising as probes for fluorescence-lifetime-based sensing of glucose. In addition, the use of the lifetime increases the range of glucose concentrations in which these probes could be used. This is important for the application since a wide range of glucose concentrations in blood could be measured, as well as for other nonmedical applications like the food industry. We also have shown that the interaction between the boronic acid and the glucose is reversible. Since the probes do not consume the glucose, this suggests the possibility of making an implantable and long-term-use glucose sensor.
Acknowledgments
N.D. is grateful to the National Sciences and Engineering Research Council of Canada (NSERC) for a postdoctoral fellowship. This work was supported by the Juvenile Diabetic Foundation International, 1-2000-546, with partial support from the NIH National Center for Research Resources RR-08119.
Footnotes
Abbreviations used: PET, photo-induced electron transfer; LED, light-emitting diode; FD, frequency domain; KD, dissociation constant; KS, stability constant; BSA, bovine serum albumin; HDTBr, cetyltrimethylammonium bromide.
References
- 1.The Diabetes Control and Complications Trial Research Group. Diabetes. 1997;46:271–286. [PubMed] [Google Scholar]
- 2.The Diabetes Control and Complications Trial Research Group. N Engl J Med. 1993;329:977–986. doi: 10.1056/NEJM199309303291410. [DOI] [PubMed] [Google Scholar]
- 3.Robinson MR, Eaton RP, Haaland DM, Koepp GW, Thomas EV, Stallard BR, Robinson PL. Clin Chem. 1992;38(9):1618–1622. [PubMed] [Google Scholar]
- 4.Heise HM, Marbach R, Koschinsky Th, Gries FA. Artif Organs. 1994;18(6):439–447. doi: 10.1111/j.1525-1594.1994.tb02230.x. [DOI] [PubMed] [Google Scholar]
- 5.Burmeister JJ, Chung H, Arnold MA. Photochem Photobiol. 1998;67(1):50–55. [PubMed] [Google Scholar]
- 6.March WF, Rabinovitch B, Adams R, Wise JR, Melton M. Trans Am Soc Artif Intern Organ. 1992;28:232–235. [PubMed] [Google Scholar]
- 7.Rabinovitch B, March WF, Adams RL. Diabetes Care. 1982;5(3):254–258. doi: 10.2337/diacare.5.3.254. [DOI] [PubMed] [Google Scholar]
- 8.Claremont DJ, Sambrook IE, Penton C, Pickup JC. Diabetologia. 1986;29:817–821. doi: 10.1007/BF00873223. [DOI] [PubMed] [Google Scholar]
- 9.Yokoyama K, Sode K, Tamiya E, Karube I. Anal Chim Acta. 1989;218:137–142. [Google Scholar]
- 10.Schier GM, Moses RG, Gan IET, Blair SC. Diabetes Res Clin Pract. 1988;4:177–181. doi: 10.1016/s0168-8227(88)80015-9. [DOI] [PubMed] [Google Scholar]
- 11.Clarke W, Becker DJ, Cox D, Santiago JV, White NH, Betschart J, Eckenrode K, Levandoski LA, Prusinki EA, Simineiro LM, Snyder AL, Tideman AM, Yaeger T. Diabetes Res Clin Pract. 1988;4:209–214. doi: 10.1016/s0168-8227(88)80020-2. [DOI] [PubMed] [Google Scholar]
- 12.Tretnak W, Wolfbeis OS. Anal Chim Acta. 1989;221:195–203. [Google Scholar]
- 13.Meadows D, Schultz JS. Talanta. 1988;35(2):145–150. doi: 10.1016/0039-9140(88)80053-5. [DOI] [PubMed] [Google Scholar]
- 14.Tolosa L, Malak H, Rao G, Lakowicz JR. Sensors Actuators B. 1997;45:93–99. doi: 10.1016/S0925-4005(97)00275-X. [DOI] [PMC free article] [PubMed] [Google Scholar]
- 15.Tolosa L, Gryczynski I, Eichorn LR, Dattelbaum JD, Castellano FN, Rao G, Lakowicz JR. Anal Biochem. 1999;267:114–120. doi: 10.1006/abio.1998.2974. [DOI] [PMC free article] [PubMed] [Google Scholar]
- 16.D’Auria S, DiCesare N, Gryczynski Z, Gryczynski I, Rossi M, Lakowicz JR. Biochem Biophys Res Commun. 2000;274:727–731. doi: 10.1006/bbrc.2000.3172. [DOI] [PubMed] [Google Scholar]
- 17.Kenneth ER, Ernest KJ. Diabetes Technol Ther. 1999;1(1):3–11. [Google Scholar]
- 18.Schultz JS, Sims G. Biotech Bioeng Symp. 1979;9:65–71. [PubMed] [Google Scholar]
- 19.Lorand JP, Edwards JO. J Am Chem Soc. 1959;24:769–774. [Google Scholar]
- 20.Sienkiewicz PA, Roberts DC. J Am Chem Soc. 1980;42:1559–1575. [Google Scholar]
- 21.Yoon J, Czarnik AW. J Am Chem Soc. 1992;114:5874–5875. [Google Scholar]
- 22.Samankumara Sandanayake KRA, James TD, Shinkai S. Pure Appl Chem. 1996;68(6):1207–1212. [Google Scholar]
- 23.James TD, Samankumara Sandanayake KRA, Shinkai S. Angew Chem Int Ed Engl. 1996;35:1910–1922. [Google Scholar]
- 24.Cooper CR, James TD. J Chem Soc Perkin Trans. 2000;I:963–969. [Google Scholar]
- 25.Yamamoto M, Takeuchi M, Shinkai S. Tetrahedron. 1998;54:3125–3140. [Google Scholar]
- 26.Takeuchi M, Yoda S, Imada T, Shinkai S. Tetrahedron. 1997;53(25):8335–8348. [Google Scholar]
- 27.James TD, Samakurama Sandanayake KRA, Shinkai S. Nature. 1995;374(23):345–347. [Google Scholar]
- 28.Shiino D, Kataoka K, Koyama Y, Yokoyama M, Okano T, Sakurai Y. J Intell Mater Syst Struct. 1994;5:311–314. [Google Scholar]
- 29.Kitano S, Koyama Y, Kataoka K, Okano T, Sakurai Y. J Control Release. 1992;19:162–170. [Google Scholar]
- 30.Lakowicz JR. Principles of Fluorescence Spectroscopy. 2nd. Plenum; New York: 1999. p. 551. [Google Scholar]
- 31.James TD, Samakumara Sandanayake KRA, Iguchi R, Shinkai S. J Am Chem Soc. 1995;117:8982–8987. [Google Scholar]
- 32.Appleton B, Gibson TD. Sensors Actuators B. 2000;65:1–3. 302–304. [Google Scholar]
- 33.Shouhai WW, Gao S, Wang B. Org Lett. 1999;1(8):1209–1212. doi: 10.1021/ol9908732. [DOI] [PubMed] [Google Scholar]
- 34.Berndt KW, Gryczynski I, Lakowicz JR. Rev Sci Instrum. 1990;61:1816–1820. [Google Scholar]
- 35.Thompson RB, Frisoli JK, Lakowicz JR. Anal Chem. 1992;64:2075–2078. doi: 10.1021/ac00042a009. [DOI] [PMC free article] [PubMed] [Google Scholar]
- 36.Szmacinski H, Lakowicz JR. Sensors Actuators B. 1995;29:16–24. doi: 10.1016/0925-4005(95)01658-9. [DOI] [PMC free article] [PubMed] [Google Scholar]
- 37.Burch CL, Lakowicz JR. Biophys J. 1995;68:1574–1582. doi: 10.1016/S0006-3495(95)80330-9. [DOI] [PMC free article] [PubMed] [Google Scholar]
- 38.Bambot SB, Rao G, Romauld M, Carter GM, Sipior J, Terpetschnig E, Lakowicz JR. Biosens Bioelectron. 1995;10:6–7. 643–652. doi: 10.1016/0956-5663(95)96941-q. [DOI] [PMC free article] [PubMed] [Google Scholar]
- 39.Lakowicz JR, Cryczynski I. Topics in Fluorescence Spectroscopy: Techniques. Vol. 1. Plenum; New York: 1991. pp. 293–335. [Google Scholar]
- 40.Cooper CR, James TD. Chem Lett. 1998;9:883–884. [Google Scholar]
- 41.Samankumara Sandanayake KRA, James TD, Shinkai S. Chem Lett. 1995;6:503–504. [Google Scholar]
- 42.Takeuchi M, Mizuno T, Shinmori H, Nakashima M, Shinkai S. Tetrahedron. 1996;52(4):1195–1204. [Google Scholar]
- 43.Szmacinski H, Lakowicz JR. Topics in Fluorescence Spectroscopy: Probe Design and Chemical Sensing. Vol. 4. Plenum; New York: 1994. pp. 295–334. [Google Scholar]


