Abstract
A diphenyloxazole substituted with a dimethylamino and a boronic acid group showing intramolecular charge transfer in the excited state undergoes large spectral changes in the presence of monosaccharides.
For a decade, the development of synthetic probes for the recognition and analysis of sugar has attracted much attention.1 Synthetic probes could find useful applications in the food industry as well as in clinical analysis. Detection and monitoring of glucose is particularly important for diabetics.2 The development of synthetic sensors could be complementary to the present technology of glucose testing by using enzymes.3 For example, the use of enzymes shows some limitations in the development of implantable sensors for continuous glucose monitoring in blood or in interstitial tissue. Continuous monitoring of glucose blood level is very important for the long term health of the diabetics and synthetic probes could lead to improvements in medical technology such as alarm systems for hypoglycemia and a control device for an insulin pump.
The boronic acids have been known for a few decades for their ability to interact with diols.4 They have been used for the development of receptor and fluorescent probes for sugars.1,5–7 The advantages of using boronic acid as chelator group for sugars are the fast and reversible interaction with sugars. In addition, many substituted phenylboronic acids are commercially available allowing the development of a large diversity of synthetic fluorescent probes for sugars with minimal synthetic steps. Different mechanisms have been used to induce spectral change following the interaction of the boronic acid and the sugars. Among these mechanisms, the use of intramolecular charge transfer (ICT) involving the boronic acid is very promising.6,7 ICT is well known to be very sensitive to small perturbations8 that can result in spectral shifts, intensity changes and/or lifetime changes. In addition, ICT can be applied to a very large diversity of fluorophores with no limitation of the wavelength range and/or lifetime of the fluorophore.
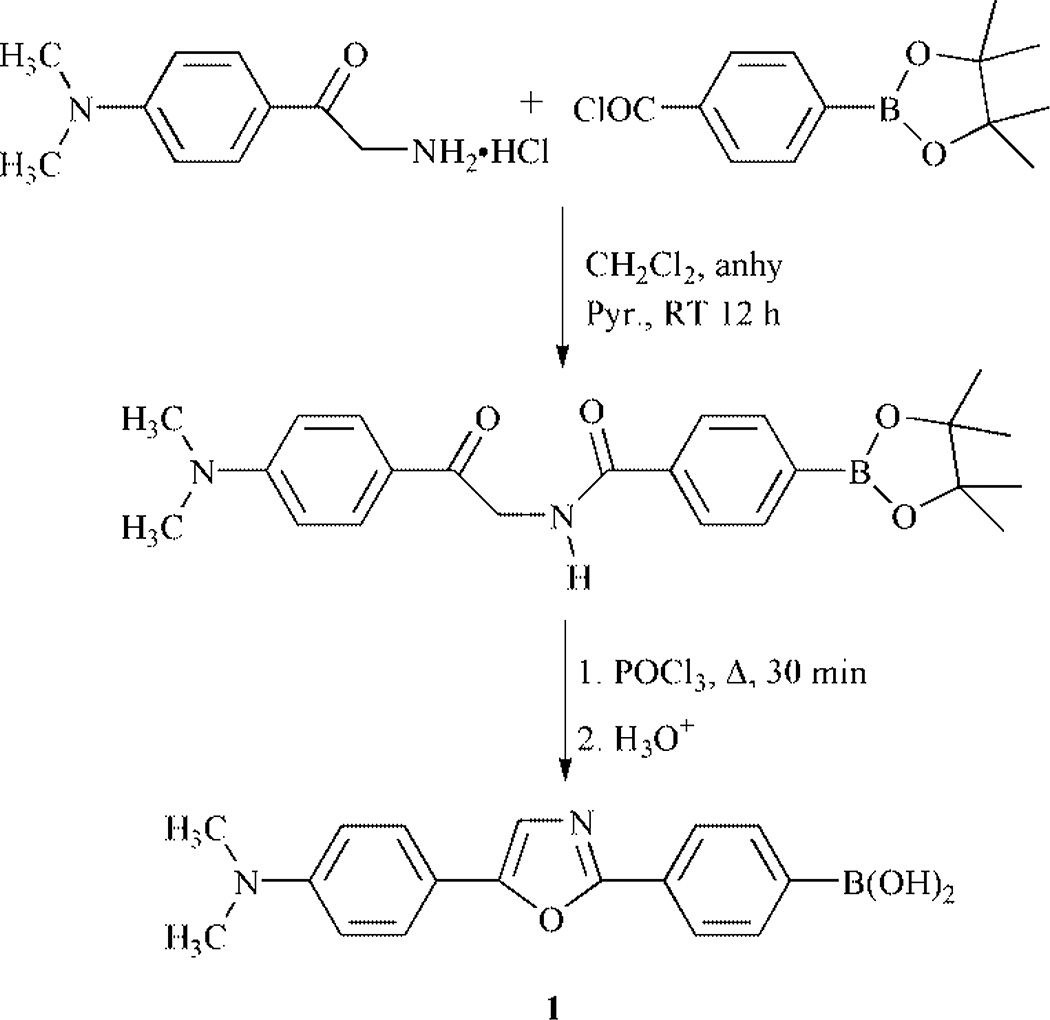
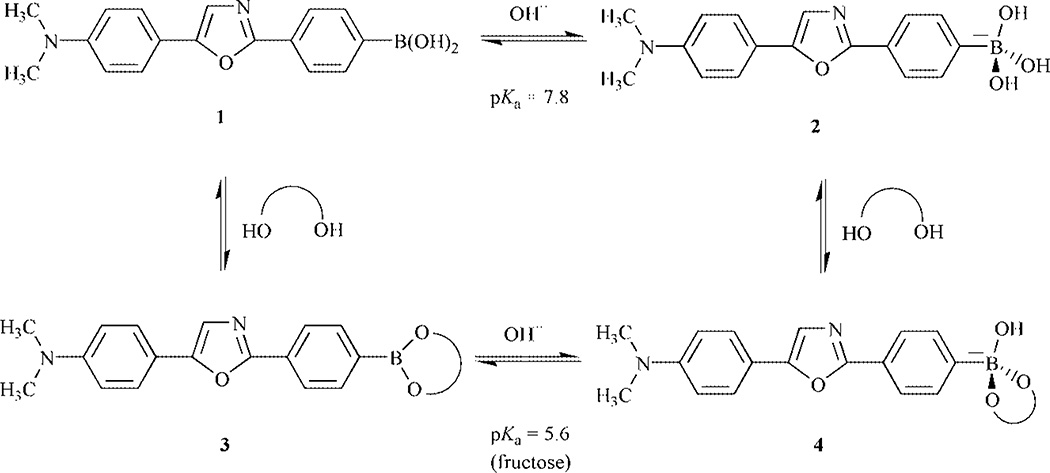
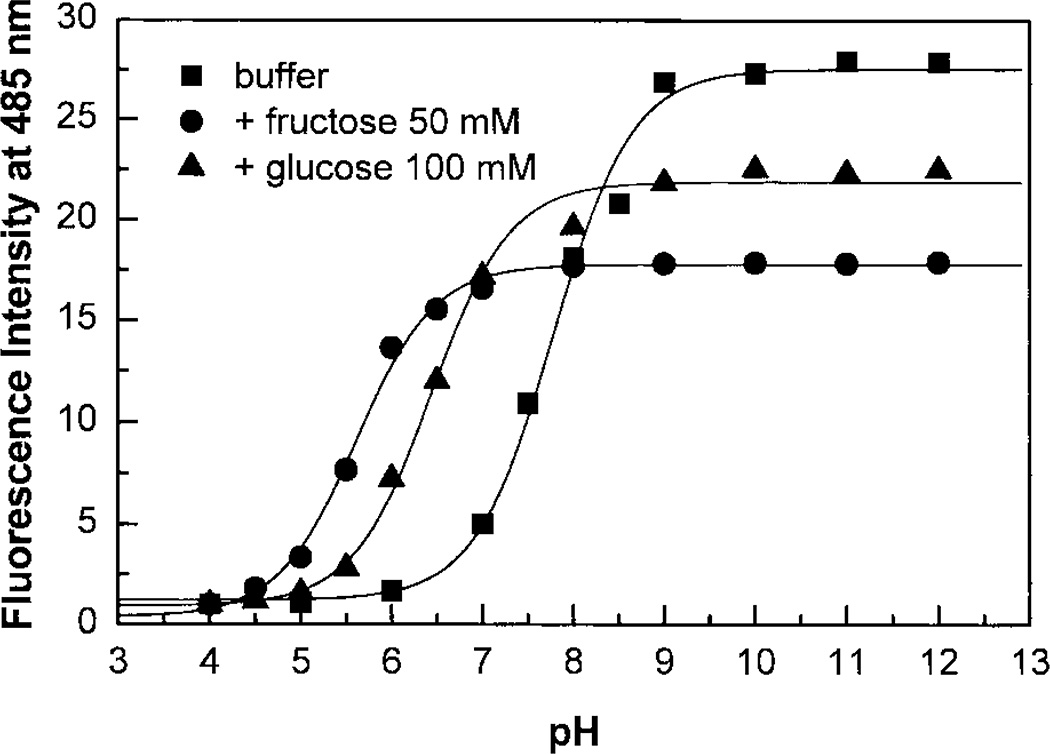
In an attempt to develop highly effective fluorescent probes for glucose, we synthesized compound 1 (Scheme 1). Compound 1† is readily synthesized from the reaction between the 2-amino-4′-dimethylaminoacetophenone hydrochloride‡ and 4-(4,4,5,5-tetramethyl-1,3,2-dioxaborolan-2-yl)benzoyl chloride, obtained from the commercially available 4-(4,4,5,5-tetramethyl-1,3,2-dioxaborolan-2-yl)benzoic acid refluxed in SOCl2, following by the dehydratation of the product in POCl3.9 Donor–acceptor derivatives of diphenyloxazole are well known to show high fluorescence quantum yields, long wavelength emission and to be very sensitive to small variations affecting the ICT properties of the excited state.9 In this case, the ICT state is between the boronic acid, the electron-withdrawing group, and the N,N-dimethylamino group, the electron-donating group. As the boronic acid group changes to its anionic form, 2 in Scheme 2, the electron-withdrawing properties of the boron are removed and then the ICT is affected.6 As the pH increases, we observe a blue shift (results not shown) and a significant increase in the fluorescence intensity. The emission band of the neutral form 1 appears at 557 nm with a ϕF value of 0.03, on the other hand, the emission of the anionic form 2 appears at 488 nm with a ϕF value of 0.95. These important spectral changes are interpreted by the loss of the ICT property for the anionic form 2. The intensity change following the pH change is shown in Fig. 1. Nearly a 30-fold increase in the fluorescence intensity can be observed at 485 nm.
Scheme 1.
Synthetic route to 1.
Scheme 2.
Equilibrium involving pH and sugars.
Fig. 1.
Titration curves of 1 against the pH in absence and presence of sugars, λex = 350 nm.
Usually, the effects of sugars are observed since the boronic acid–sugar complex (structure 3 from Scheme 2) has a lower pKa than the uncomplexed boronic acid. At a selected pH, it is possible to have a predominance of the neutral form (1) in absence of sugar and a predominance of the anionic form (4) in presence of sugar. This conformational change of the boron group, induced by the presence of sugar, is the origin of the spectral changes observed. Titration curves of 1 in presence of the sugar are displayed in Fig. 1. The observed pKa of 1 is 7.8 in absence of sugar, pKas of 5.6 and 6.5 are obtained in presence of fructose and glucose, respectively. Maximum changes between the titration curves with and without sugar are obtained at pH 6.5 and 7.0 for fructose and glucose, respectively. Since the spectral changes induced by sugar are not so different between these two pH values, we performed our measurements at pH 7.0 for all saccharides. It is also interesting to note that large spectral changes could also be observed at a pH higher than 9.0 as seen in Fig. 1. This suggests that probe 1 could also be used for monitoring sugar at high pH.
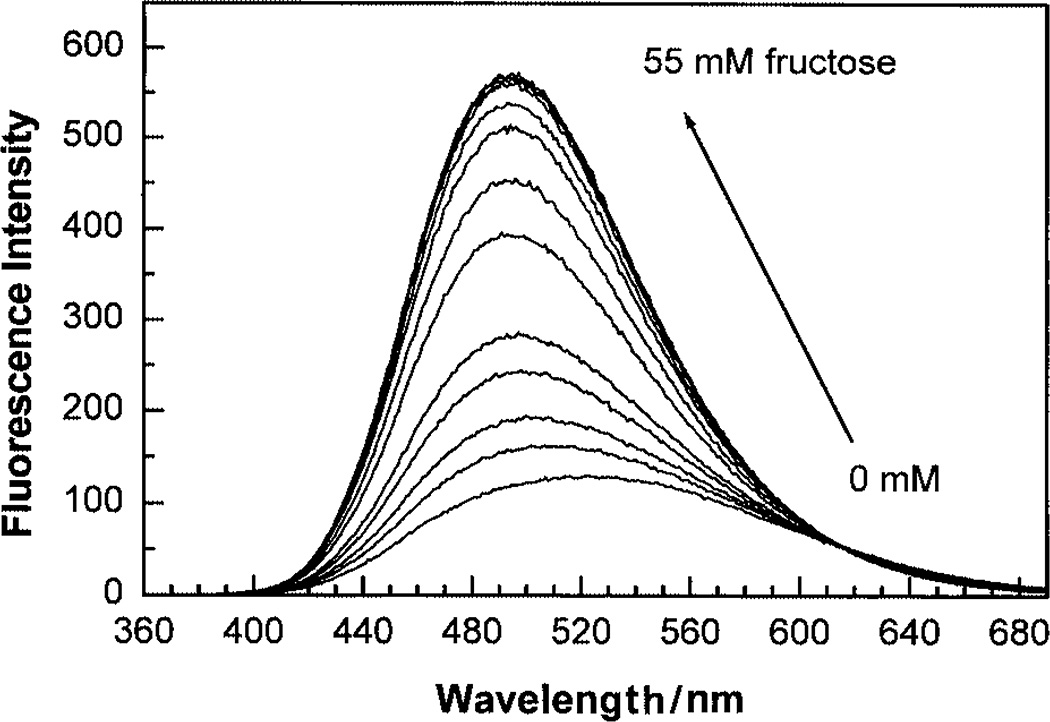
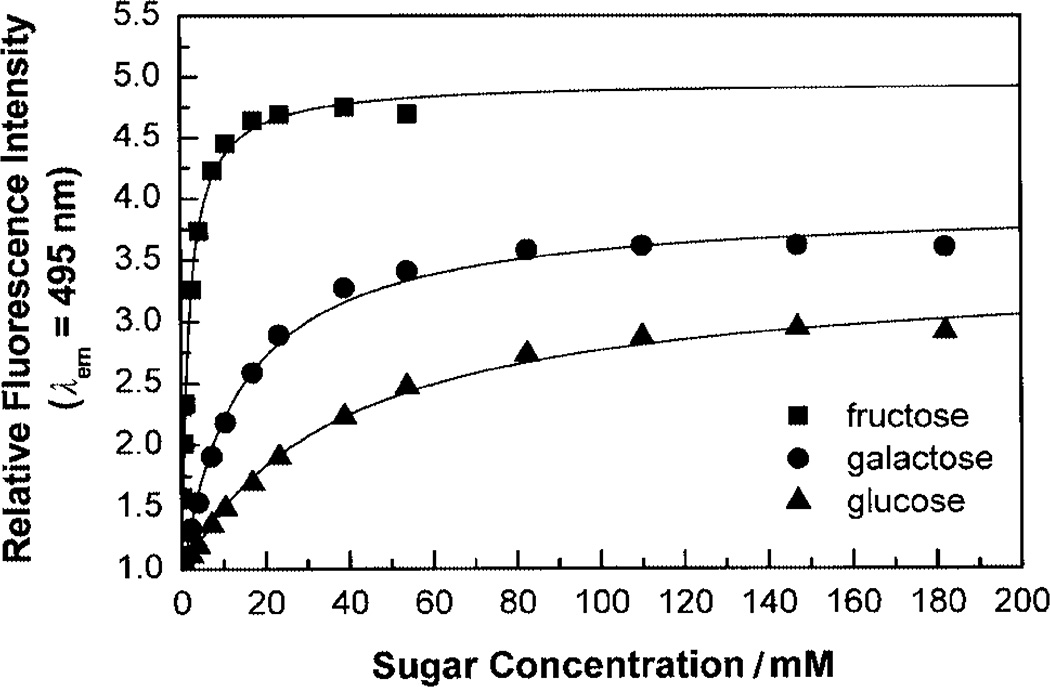
The effect of fructose on the emission band of 1 is displayed in Fig. 2. As observed for the pH, the presence of the sugar induces a blue shift and an increase in the fluorescence intensity. An isosbestic point is observed at 615 nm showing the equilibrium of the two conformations, the neutral and anionic form of the boronic acid. The same isosbestic point was observed in the pH effects on the emission band. The increase of the emission intensity is about 5-fold in the presence of fructose and about 3-fold in the presence of galactose and glucose. Titration curves of 1 against sugars are displayed in Fig. 3. Dissociation constants (KD) of 1 were calculated at 1.9 ± 0.1 mM for fructose and 14 ± 1 and 37 ± 3 mM for galactose and glucose, respectively. KD values are comparable to previous values obtained with donor–acceptor chromophores involving the boronic acid group.6,7 The higher affinity of the monoboronic acid 1 for fructose in comparison with glucose and the high concentration range of practical usefulness of 1 for glucose would not be suitable for glucose sensing in biological samples and/or in the presence of fructose but could find applications in the food industry and/or in fermentation industry where high concentrations of glucose are used.
Fig. 2.
Effect of fructose on the emission of 1, measured in phosphate buffer–methanol (2:1 v/v) at pH 7.0, λex = 350 nm. Probe concentration: 5 × 10⁻⁶ M.
Fig. 3.
Titration curves of 1 against sugars, measured in phosphate buffer–methanol (2:1 v/v) at pH 7.0, λex = 350 nm. Probe concentration: 5 × 10⁻⁶ M.
In addition to the observed changes in the steady-state emission properties of 1, we have also observed changes in the fluorescence lifetime of the probes. The neutral structure, 1, shows a monoexponential fluorescence decay with a lifetime of 1.7 ns while the anionic form 2 possesses a lifetime of 3.7 ns, also monoexponential. At pH 7, the presence of fructose changes the fluorescence lifetime of the probe from 2.8 to 3.6 ns. Fluorescence lifetime changes are useful for sensing and monitoring since they are independent of the total intensity and independent also from the power of the excitation source and the concentration of the probe.10
Acknowledgments
The authors wish to acknowledge the Juvenile Diabetes Foundation, 1-2000-546, and the NIH National Center for Research Resources, RR-08119, for financial support.
Footnotes
Selected data for 1 5-(4-dimethylaminophenyl)-2-[4-(dihydroxyboranyl)phenyl]oxazole: yellow solid, yield 48%, δH(300 MHz; CD3OD) 2.83 (6 H, s), 6.59 (2H, d), 7.05 (1H, s), 7.40 (2H, d), 7.52 (1H, s), 7.67 (1H, s) and 7.82 (2H, s).
Notes and references
- 1.Hartley JH, James TD, Ward CJ. J. Chem. Soc., Perkin Trans. 1. 2000:3155. [Google Scholar]
- 2.The Diabetes Control and Complications Trial Research Group. Diabetes. 1997;46:271. [PubMed] [Google Scholar]
- 3.Heller A. Annu. Rev. Biomed. Eng. 1999;1:153. doi: 10.1146/annurev.bioeng.1.1.153. [DOI] [PubMed] [Google Scholar]
- 4.Lorand JP, Edwards JO. J. Org. Chem. 1959;24:769. [Google Scholar]
- 5.James TD, Sandanayake K, Shinkai S. Angew. Chem., Int. Ed. Engl. 1996;35:1911. [Google Scholar]
- 6.DiCesare N, Lakowicz JR. J. Phys. Chem. 2001;105:6834. doi: 10.1021/jp010076x. [DOI] [PMC free article] [PubMed] [Google Scholar]
- 7.DiCesare N, Lakowicz JR. J. Photochem. Photobiol,. A. 2001;143(1):39. doi: 10.1016/S1010-6030(01)00471-3. [DOI] [PMC free article] [PubMed] [Google Scholar]
- 8.Valeur B. In: Topics in Fluorescence Spectroscopy. Lakowicz JR, editor. Vol. 4. New York: Plenum Press; 1994. pp. 21–50. [Google Scholar]
- 9.Diwu Z, Lu Y, Zhang C, Klaubert DH, Haugland RP. Photochem. Photobiol. 1997;66:424. [Google Scholar]
- 10.Szmacinski H, Lakowicz JR. In: Topics in Fluorescence Spectroscopy. Lakowicz JR, editor. Vol. 4. New York: Plenum Press; 1994. pp. 295–334. [Google Scholar]
- 11.Diwu Z, Beachdel C, Klaubert DH. Tetrahedron Lett. 1998;39:4987. [Google Scholar]
- 12.Suter CM, Schalit S, Cutler RA. J. Am. Chem‥ Soc. 1953;75:4330. [Google Scholar]


