

Abstract
The balance between osteogenesis and adipogenesis of mesenchymal stem cells is disrupted in various human diseases. Investigating the mechanisms that fine‐tune this balance is of medical importance. Identification of potential target gene which can be used to study the relationship between them could be really helpful for this purpose. In the current study, we used C3H10T1/2 as model cells and through which two models of both osteogenesis induced by bone‐morphogenetic protein (BMP)‐2 and transdifferentiation from osteogenesis to adipogenesis were established. We investigated the role of CCAAT/enhancer binding protein (C/EBP)‐α in these two systems. Then from epigenetic point of view, we elucidated the underlying molecular mechanisms preliminarily. The results showed that down‐regulations of both C/EBP‐α expression and its inducibility in response to insulin, fetal bovine serum, methylisobutylxanthine and dexamethasone (IFMD) adipogenic hormonal cocktail were observed in terminal stage of osteogenesis of C3H10T1/2 cells induced by BMP‐2. And overexpression of C/EBP‐α could lead to inhibition of osteogenesis differentiation and rescue attenuation of potential of adipogenic conversion in this process. Furthermore, we provided evidence that remarkable DNA hypermethylation and histones 3 and 4 hypoacetylation in –1286 bp/−1065 bp promoter region of C/EBP‐α were involved in both of down‐regulations. Our data suggest that C/EBP‐α functions as regulator in the balance between osteogenesis and adipogenesis of C3H10T1/2 cells and may be a therapeutic target.
Keywords: mesenchymal stem cells, osteogenesis, C/EBP‐α, epigenetics
Introduction
The balance between osteogenesis and adipogenesis of mesenchymal stem cells (MSCs) is broken in various human diseases. For example, a decrease in bone formation accompanied with an increase in bone marrow adipogenesis occurs with aging and immobility or following corticosteroid use [1, 2, 3], whereas increased bone formation is observed in patients with progressive osseous hyperplasia who form heterotopic bone within their adipose tissue [4]. Marrow adipocytes share common MSCs with bone‐forming osteoblasts. Therefore, the balance between bone formation and marrow adipogenesis might provide a therapeutic target with which to either prevent or treat conditions where there is inadequate bone formation and excessive marrow adipogensis [5]. The interplay between these cell types and the commitment to differentiate to either lineage is currently an area of intense research interest.
However, we are only now beginning to understand the mechanisms that control the differentiation of MSCs to either osteoblasts or adipocytes. Recent work has provided insight into critical pathways that determine the fate of these multipotential cells. One of these is the peroxisome proliferator activated receptor (PPAR)‐γ, whose ligands promote bone marrow stromal cell adipogenesis and inhibit osteogenesis [6, 7, 8, 9, 10]. These agents not only activate PPAR‐γ, but also suppress the expression and actions of the osteoblast transcriptional regulatory protein Cbfa‐1 [8]. Additional target pathways include the notch/δ/jagged ligands and receptors, related to the epidermal growth factor receptor family. Overexpression of notch in vitro inhibits osteogenesis and enhances adipogenesis in cell models [11]. Consistent with this is the observation that inhibition of the notch pathway interferes with adipogenesis in vitro[12]. Another newly identified target for intervention is the Wnt signalling pathway. The Wnt family of signalling peptides interacts with a receptor complex that includes the low density lipoprotein receptor‐related proteins. Clinical genetic studies have determined that mutations of lipoprotein receptor‐related protein‐5 can lead to disorders associated both with bone weakness (osteoporosis–pseudoglioma syndrome) [13] and with increased bone mass [14, 15].
Nevertheless, it is obvious that fate determination of MSCs is such a complicated process that these aforementioned target pathways which have been identified are not enough to elucidate the underlying transcriptional mechanisms completely. And identification of new target genes and pathways which are involved in regulating the balance between osteogenesis and adipogenesis of MSCs is needed.
A recent study by Cornelia et al. [16] suggests that CCAAT/enhancer binding protein (C/EBP)‐α, a key transcription factor in adipogenesis, may differentiate C2C12 myoblasts into adipocytes as well as osteoblasts and osteoblast formation occurs at low C/EBP‐α levels while adipocyte‐specific differentiation requires maximum C/EBP‐α expression. Another elegant study by Kang et al. [17] demonstrates that activation of Wnt/β‐catenin signalling shifts mesenchymal cell fate towards osteogenesis at the expense of adipogenesis by suppressing C/EBP‐α and PPAR‐γ. Therefore, a possibility is raised that C/EBP‐α may play a role in regulation of commitment of osteoblasts and adipocytes of MSCs. In the current study, this hypothetical role of C/EBP‐α is studied.
C/EBP‐α, first member of the C/EBP family [18, 19], was found to be expressed at high levels in both white and brown fat of rodents and observed to accumulate during adipocyte conversion with temporal kinetics concordant with acquisition of the differentiated phenotype [20]. Convincing evidence shows that C/EBP‐α plays an important role in the transcriptional activation of adipose differentiation [21, 22]. First, C/EBP‐α was shown to be capable of selective trans‐activation of the adipocyte‐specific genes encoding stearoyl CoA desaturase, the insulin‐responsive glucose transporter and a fatty acid‐binding protein variously termed aP2 or 422 [23, 24]. Second, expression of C/EBP‐α under control of an inducible promoter [25] is sufficient to induce adipocyte differentiation of 3T3‐L1 preadipocytes in the absence of exogenous hormonal stimuli. Third, antisense inhibition experiments designed to prevent the expression of C/EBP‐α were shown to prevent the terminal differentiation of both 3T3‐F442A and 3T3‐L1 cells [26, 27]. Finally, C/EBP‐α‘knock‐out’ mice fail to develop adipose tissue normally or to accumulate triglyceride, the hallmark of white adipose tissue [28].
Epigenetic mechanisms refer to biologic processes that regulate mitotically or meiotically, heritable changes in gene expression without altering the DNA sequence. Major epigenetic mechanisms include DNA cytosine methylation, histone modifications such as acetylation and methylation of histone tails, and small non‐coding RNA controlled pre‐ and posttranscriptional regulation of gene expression [29]. In mammals, DNA methylation occurs primarily at symmetrical CpG dinucleotides which are often found in clusters called CpG islands located at the promoter regions of about 50% of human genes. Methylation of CpG islands causes stable heritable transcriptional silencing through binding of methyl‐DNA‐specific proteins to affected CpG islands that attracts histone‐modifying enzymes, which focally establish a silenced chromatin state. A second form of epigenetic regulation of gene expression affects chromatin structure through covalent modification of histone proteins. Generally, lysine acetylation mediated by histone acetyltransferases marks transcriptionally competent regions. In contrast, histone deacetylases (HDACs) catalyze lysine deacetylation and the resulting hypoacetylated histones are usually associated with transcriptionally inactive chromatin structures.
Progression from stem cell to differentiated progeny is always accompanied by remarkable changes in cellular morphology and function. To a large extent, these changes are determined at each stage by distinctive gene expression patterns. Specifically, genes associated with self‐renewal are silenced, while cell type‐specific genes undergo transcriptional activation during differentiation. Emerging evidence suggests that the initiation and maintenance of changes in gene expression that are associated with stem cell differentiation involve the action of unique epigenetic programs. However in MSCs, there is little data on the role of epigenetic processes in regulation of commitment of osteoblasts and adipocytes.
To understand the molecular basis that regulates the balance between osteogenesis and adipogenesis of MSCs, we used C3H10T1/2 as model cells and through which two models of both osteogenesis induced by BMP‐2 and transdifferentiation from osteogenesis to adipogenesis were established. We investigated the role of C/EBP‐α in these two systems. Then from epigenetic point of view, we elucidated the underlying molecular mechanisms preliminarily.
Materials and methods
Reagents
Human recombinant morphogenetic protein‐2 (rhBMP‐2) was from R&D Systems (Minneapolis, MN, USA). 5′‐aza and trichostatin A (TSA) were from Sigma (St. Louis, MO, USA).
Cell culture and osteogenic and adipogenic differentiation induction
C3H10T1/2 mesenchymal fibroblasts were obtained from American Type Culture Collection (ATCC, Rockville, MD, USA). Monolayer culture was maintained in Dulbecco’s modified Eagle’s medium (DMEM; Invitrogen, Carlsbad, CA, USA) supplemented with 10% calf serum, 50 U/ml penicillin and 50 mg/ml streptomycin, both from Invitrogen. The cultures were incubated in a humidified atmosphere at 37°C and 5% CO2.
To induce osteogenic differentiation, C3H10T1/2 cells were treated with rhBMP‐2 at a final concentration of 100 ng/ml. The medium was changed every 3 days. Adipogenic differentiation induction was performed as described previously [30, 31]. Briefly, when cells reached confluence in culture dishes, they were fed with DMEM supplemented with 10% foetal bovine serum (FBS), 10 μg/ml of insulin (Sigma), 0.5 mM methylisobutylxanthine (MIX) (3‐isobutyl‐l‐methylxanthine, Sigma) and 1 μM dexamethasone (DEX) (Sigma). The start point of differentiation was referred as day 0. Forty‐eight hours later (day 2), cells were changed to DMEM containing only insulin and 10% FBS. The medium was replenished at 2‐day intervals.
Alkaline phosphatase (ALP) quantification assay
C3H10T1/2 cells were rinsed two times with ice‐cold phosphate‐buffered saline (PBS) and then scraped into ddH2O. This was followed by three cycles of freezing and thawing. ALP activity was determined at 405 nm using p‐nitrophenyl phosphate (Sigma) as the substrate. A 50 μl sample was mixed with 50 μl p‐nitrophenyl phosphate (1 mg/ml) in 1 M diethanolamine buffer containing 0.5 mM MgCl2 (pH9.8) and incubated at 37°C for 15 min. on a bench shaker. The reaction was stopped by the addition of 25 μl of 3 M NaOH per 100 μl of reaction mixture. Total protein content was determined with the Bicinchoninic acid (BCA) method in aliquots of the same samples with the PIERCE (Rockford, IL, USA) protein assay kit, read at 562 nm and calculated according to a series of albumin (bovine serum albumin) standards. ALP levels were normalized to the total protein content at the end of the experiment. All experiments were conducted in triplicate.
ALP staining
ALP presence of the cell layers was assessed as follows. The cultured cells were rinsed with PBS three times and fixed with 4% paraformaldehyde for 10 min. at 4°C. The fixed cells were soaked in 0.1% naphthol AS‐MX phosphate (Sigma) and 0.1% fast red violet LB salt (Sigma) in 56 mM 2‐amino‐2‐methyl‐1,3‐propanediol (pH9.9, Sigma) for 10 min. at room temperature, washed with PBS, and were then observed under an digital camera.
Real‐time RT‐PCR
Total RNA of cells was isolated using TRIzol reagent (Invitrogen) according to the manufacturer’s instructions. After reverse transcription reaction, real‐time PCR was performed by an ABI 7900HT system using SYBR®Premix Ex Taq™ (Takara, Dalian, China) according to the manufacturer’s instructions. The conditions of real‐time PCR were as follows: 40 cycles at 94°C for 10 sec., 60°C for 30 sec. Dissociation stage was added to the end of amplification procedure. There is no non‐specific amplification determined by dissolve curve. β‐actin was used as internal control. The primer sequences used for this analysis: osteocalcin: 5′‐AGGGCAATAAGGTAGTGAA‐3′ (forward), 5′‐GAGGCTCTGAGAAGCATAAA‐3′ (reverse); collagen I: 5′‐GAAGTCAGCTGCATACAC‐3′ (forward), 5′‐AGGAAGTCCAGGCTGTCC‐3′ (reverse); C/EBP‐α: 5′‐GTTAGCCATGTGGTAGGAGACA‐3′ (forward), 5′‐CCCAGCCGTTAGTGAAGAGT‐3′ (reverse); aP2: 5′‐AAATCACCGCAGACGACA‐3′ (forward), 5′‐CAC ATTCCACCACCAGCT‐3′ (reverse); glut4: 5′‐CTTGGCTCCCTTCAGTTTG‐3′ (forward), 5′‐TGCCTTGTGGGATGGAAT‐3′ (reverse); β‐actin: 5′‐CCCTGTATGCCTCTGGTC‐3′ (forward), 5′‐GTCTTTACGGATGTCAACG‐3′ (reverse).
Western blot
Cells were lysed on ice for 30 min. in a buffer containing 50 mM Tris‐HCl, pH7.4, 150 mM NaCl, 1% Nonidet P‐40, and 0.1% SDS supplemented with protease inhibitors (10 μg/ml leupeptin, 10 μg/ml pepstatin A and 10 μg/ml aprotinin). Proteins were fractionated by SDS‐PAGE, transferred to a nitrocellulose membrane and detected using the anti‐C/EBP‐α (cell signalling technology), anti‐c‐myc (cell signalling technology) and anti‐β‐actin (Sigma) antibodies. Immunostaining was detected using an enhanced chemiluminescence system (GE Healthcare, Piscataway, NJ, USA).
DNA isolation and bisulphite sequencing PCR
Genomic DNA was prepared as described by Laverrière et al.[32]. Bisulphite treatment was performed by the method described by Frommer et al.[33], as modified by Clark et al. and Feil et al.[34, 35]. Briefly, genomic DNA was cut by incubation of 5 μg DNA with EcoRI at 37°C overnight and then purified with NaOAc and absolute alcohol. The purified DNA was suspended with tris‐EDTA (TE) (pH8.0) into 50 μl, then denaturated for 15 min. at 50°C with 5.5 μl of 2 M NaOH. Add 2‐time volume of 2% low melting agarose (freshly prepared in ddH2O before use) to the DNA solution. Form agarose beads by pipetting 10 μl aliquots of DNA/agarose mixture into cold mineral oil. Let the tube stand on ice for 30 min. Then, 55 μl of freshly prepared hydroxyquinone (10 mM, Sigma‐Aldrich, St Louis, MO, USA) and 520 μl of freshly prepared sodium bisulphite (40.5%, pH5, Sigma‐Aldrich) were added, mixed, and then incubated under mineral oil at 50°C for 16 hrs. Modification was completed by NaOH (final concentration, 0.3 M) treatment for 10 min. at room temperature.
PCR amplifications were performed with 20 μl reaction mixtures containing one agarose/DNA bead in the presence of 2 U of rTaq polymerase (Takara), using semi‐nested PCR method. Primer sequences were presented in Table 1. The amplification procedure consisted of 5 min. of denaturation at 94°C followed by 25 to 30 cycles at 94°C (1 min.), 55–57°C (30 sec.), and 72°C (30 sec.), ending with 10 min. of extension at 72°C. All oligodesoxynucleotides were obtained from Sangon (Sangon, Shanghai, China). The PCR fragments amplified were gel‐purified cloned using pMD19‐T vector system (Takara). Ten clones per sample were sequenced and sense strand was used to assess the level of methylation in each CpG site.
Table 1.
Primer sequences used for bisulphite sequencing PCR
| CpG island | Primer sequences (5′‐3′) |
|---|---|
| CpG island 1 | TGGGTGTTTATTAGGTTTTTTTTGT (forward) |
| AAAAACACAATTTTCTTTCCCTACTATC (reverse) | |
| ATTCATAAAAACACTAATCTCTATAACTC (inside‐reverse *) | |
| CpG island 2 | TGTTTGGTAAGTTTAGTAATTTTAT (forward) |
| CAAACAAAACACCTCTCTTTC (reverse) | |
| TGTTTTGGTTTGGAGATGTAATG (inside‐ forward) | |
| CpG island 3 | GTTTTTTAGTGTTGGTTGGAAGTG (forward) |
| CCTTCTCCTATAACTTTCCAAAAC (reverse) | |
| GGTGATTTAGAGGTTTAAAGGAGGG (inside‐ forward) |
*In this assay, semi‐nested PCR was employed.
Amplification of C/EBP‐α promoter region, construction of 5′ deletion mutants
A 1426 bp (−1381 bp/+45 bp) fragment of the 5′‐flanking region of C/EBP‐α was amplified from C3H10T1/2 with pfu DNA polymerase (Takara) with addition of two restriction sites: XhoI (5′) and Hind III (3′). This XhoI/Hind III fragment was cloned into the plasmid pGL3‐Basic (Promega, CharbonniÈres, France), named –1381 bp/+45 bp. The 5′ deletion constructs –1009 bp/+45 bp, −420 bp/+45 bp, −55 bp/+45 bp were created by PCR using the –1381 bp/+45 bp as template. All constructs were confirmed by sequencing performed by Invitrogen.
In vitro methylation assay
DNA fragment containing CpG island 1 was excised by restriction enzyme digestions and then purified by gel electrophoresis and methylated at all CpG sites with M.SssI (2 U/μg of DNA, 6 hrs at 37°C), or mock methylated. M.SssI was then inactivated at 65°C for 15 min. Treated DNA fragments and vectors were ligated and purified by phenol‐chloroform extraction and ethanol precipitation. The plasmid concentrations were determined by measuring the A260.
Transfection and reporter‐luciferase assay
Cells were seeded into 24‐well plates at indicated time‐point. All plasmids for transfection were isolated by QIAGEN plasmid purification kit (QIAGEN, Hilden, Germany). Transient transfection by lipofectamine2000 (Invitrogen Carlsbad, CA, USA) were performed according to the manufacturer’s instruction and phRL‐SV40 vector (Promega, Madison, WI, USA) was used as transfection efficiency control. Forty‐eight hours after transfection, both firefly and Renilla luciferase activities were measured using Dual‐luciferase reporter assay system (Promega) with Luminoskan TL plus Luminometer (MTX, Labsystem, Vienna, VA, USA) according to the manufacturer’s protocol. The relative luciferase units (RLUs), which is the ratio of firefly’s activity to Renilla, were then obtained.
Construction of eukaryotic expression plasmid
pcDNA4/TO contains unique KpnI and XbaI site between which mouse C/EBP‐α coding sequence fused with c‐myc was inserted. The primer sequence used for construction: 5′‐ATGGTACCATGGAACAAAAACTTATTTCTGAAGAA‐GATCTGATGGAGTCGGCCGACTTCTA‐3′ (forward), in which KpnI restriction site was underlined and c‐myc coding sequence was italic and C/EBP‐α coding sequence was double‐underlined; 5′‐CATTCTAGATCACGCGCAGTTGCCC‐ATGG‐3′ (reverse), in which XbaI restriction site was underlined and C/EBP‐α coding sequence was double‐underlined. All expression plasmids were characterized by automated sequencing, and overexpression of respective proteins was verified by transient transfection of each plasmid into human 293 cells and subsequent Western blot analysis (data not shown).
Construction of cell line conditionally expressing C/EBP‐α
The newly generated pcDNA4/c‐myc‐C/EBP‐α expression plasmid and pcDNA6/TR which expresses tetracycline repressor were linearized and co‐transfected into C3H10T1/2 cells using lipofectamine2000 (Invitrogen). Stable clones were picked and isolated by addition of 250 μg/ml zeocin and 5 μg/ml blasticidin to DMEM media. The expression of recombinant protein was induced by adding 1 μg/ml aqueous solution of tetracycline to the culture medium. Cells expressing c‐myc‐C/EBP‐α fusion protein were tested by Western blot analysis.
Chromatin immunoprecipitation assay
In brief, cells were fixed with 1% formaldehyde for 10 min. at 37°C. After washing with cold‐PBS, cells were lysed in SDS lysis buffer, and sonicated to shear DNA to an average fragment size of 300∼400 bp. Anti‐acetyl‐ histone 3 and anti‐acetyl‐histone 4 (Upstate, New York, NY, USA) was added. After overnight incubation at 4°C, immune complexes were collected with salmon sperm DNA/protein agarose‐50% slurry (Santa Cruz, CA, USA) for 2.5 hrs, and then extensively washed. Samples were extracted with elution buffer (1% SDS, 0.1 M NaHCO3), and heated at 65°C overnight to reverse crosslinks. DNA was purified and used for PCR. The primer sets used for chromatin immunoprecipitation: primer set A: 5′‐GAGACGTGGGTGCTCACC‐3′ (forward), 5′‐TTCTTTCCCTACTGTCATTCA‐3′ (reverse); primer set B: 5′‐GTAAGCCTAGCAATCCTATCG‐3′ (forward), 5′‐CTTCCAGGCAGAGCACCT‐3′ (reverse); primer set C: 5′‐TTGGCTGGAAGTGGGTGAC‐3′ (forward), 5′‐TGGTGCCTGCTGGGTCTT‐3′ (reverse).
Statistical analysis
The anova test was used for statistical analysis of the experiments. Error bars represent S.D., and P < 0.05 was taken as the level of significance.
Results
C3H10T1/2 cells can be induced to undergo osteogenic and adipogenic differentiation
C3H10T1/2, one cell line established from an early mouse embryo with high degree of sensitivity to post‐confluence inhibition [36], has been used extensively as in vitro model to examine mesenchymal differentiation into various phenotypic lineages by different inductive mediators [37, 38, 39, 40].
It has been demonstrated by many reports that on BMP‐2 stimulation, C3H10T1/2 cells undergo differentiation to an osteogenic phenotype [41, 42, 43]. To confirm this result, we exposed confluent C3H10T1/2 cells to rhBMP‐2 at concentration of 100 ng/ml. Total RNA and protein were recovered at days 0, 3, 7, 14 and 21 after BMP‐2 addition thereafter for use in real‐time PCR and ALP activity assay. A significant increase in ALP activity was observed upon BMP‐2 addition (Fig. 1A). Consistent with this result, cell staining for ALP showed that BMP‐2 treatment could lead to activation of ALP (Fig. 1B). The higher level was maintained throughout the time course. Furthermore, transcription of collagen I and osteocalcin was activated from days 7 to 21 and 14 to 21 after BMP‐2 addition (Fig. 1C and D).
Figure 1.
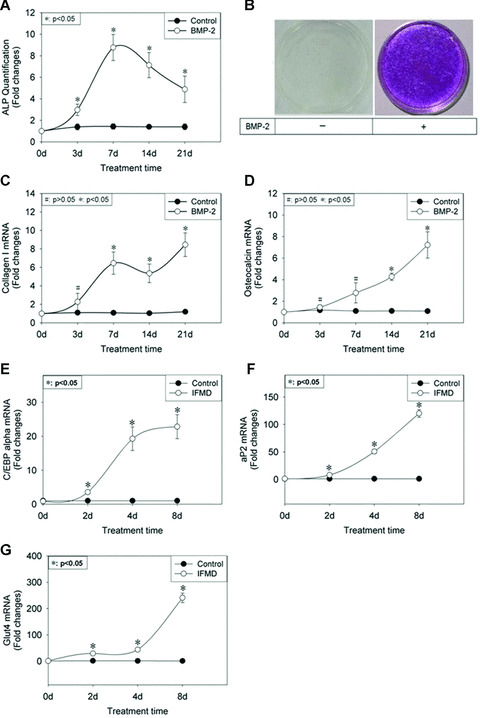
Expression pattern of osteogenic and adipogenic differentiation markers of C3H10T1/2 cells in response to 100 ng/ml rhBMP‐2 and adipogenic hormonal cocktail. At the indicated time‐point, total protein was recovered for use in ALP quantification assay (A). The result was normalized on the basis of protein content and represented as fold changes of ALP activity in BMP‐2‐treated cultures relative to vehicle‐treated cultures at the respective time‐point. Data were shown as mean ± S.D. At day 7, ALP staining was performed (B). Total RNA was extracted and subjected to real‐time PCR using primers for collagen I (C) and osteocalcin (D). β‐actin was used as internal control and the results were expressed as fold changes of mRNA abundance in BMP‐2‐treated cultures, relative to vehicle‐treated cultures at the respective time‐point. Data were shown as mean ± S.D. Adipogenic hormonal cocktail was comprised insulin, dexamethasone, methylisobutylxanthine and foetal bovine serum, ‘IFMD’ for short. Total RNA was extracted and subjected to real‐time PCR using primers for C/EBP‐α (E), aP2 (F) and glut4 (G). Internal control and data presentation form were same as above.
In the present study, C3H10T1/2 cells were induced to undergo adipogenesis according to a protocol that involved exposure to confluent cells to a mixture of insulin, DEX, MIX and FBS [44]. Two days later the culture medium was changed and MIX and DEX were omitted. Total RNA was harvested at days 0, 2, 4 and 8 after IFMD stimulation for use in real‐time PCR. The results revealed significantly higher mRNA expression levels of C/EBP‐α, aP2, and glut4 between days 2 and 8 of the differentiation program in contrast to control culture. Of these, the level of C/EBP‐α mRNA expression reached its peak period at about day 8 (Fig. 1E). And remarkable accumulations of aP2 (more than 100‐fold) and glut4 (more than 200‐fold) mRNA were observed at day 8 of differentiation program relative to control culture (Fig. 1F and G).
C/EBP‐α expression is down‐regulated in terminal stage of osteogenic differentiation of C3H10T1/2 cells induced by BMP‐2
To assess the potential role of C/EBP‐α in osteogenic differentiation of C3H10T1/2 cells induced by BMP‐2, its mRNA and protein expression patterns were investigated. Total RNA and protein were recovered from C3H10T1/2 cells at days 0, 3, 7, 14 and 21 after BMP‐2 addition and subjected to real‐time PCR and Western blot, respectively. The result from real‐time PCR indicated that C/EBP‐α mRNA levels showed a biphasic response to incubation with BMP‐2, that is, increased from days 3 to 7 and reached its maximal levels at day 7 and thereupon fell progressively till day 21. Of these, there were statistically higher mRNA levels from days 3 to 14 in response to BMP‐2, relative to control cultures (P < 0.05). However, no variant in C/EBP‐α mRNA expression level was observed at day 21 between with and without BMP‐2 addition (P > 0.05) (Fig. 2A). Likewise, Western blot revealed the same pattern of C/EBP‐α protein expression as mRNA (Fig. 2B).
Figure 2.
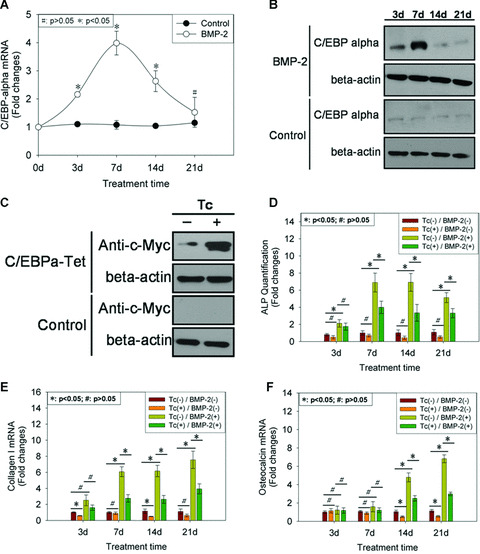
The role of C/EBP‐α in osteogenesis of C3H10T1/2 cells induced by BMP‐2. At the indicated time‐point of BMP‐2 addition, total RNA and protein were recovered from cells and subjected to real‐time PCR using primer for C/EBP‐α (A) and Western blot using anti‐C/EBP‐α antibody (B). β‐actin was used as internal control for real‐time PCR and Western blot. Real‐time results were expressed as fold changes of mRNA abundance in BMP‐2‐treated cultures, relative to vehicle‐treated cultures at the respective time‐point. Data were shown as mean ± S.D. Coding sequence of mouse C/EBP‐α, when fused to c‐myc, was cloned to pcDNA4/TO containing tetracycline operator site within the human cytomegalovirus immediate‐early promoter. Then this construct was co‐transfected into C3H10T1/2 cells along with pcDNA6/TR encoding Tet repressor. Cells were selected in zeocin and blasticidin. One clone which was designated as ‘C/EBP‐α‐Tet’ was selected for further analysis. After 12 hrs of tetracycline (1 μg/ml) addition, total protein was recovered and subjected to Western blot using anti‐c‐myc antibody (C). β‐actin was used as internal control. Then at the indicated time‐point of tetracycline and BMP‐2, total RNA and protein were recovered from cells and subjected to ALP quantification assay (D) and real‐time PCR using primers for collagen I (E) and osteocalcin (F). The result of ALP quantification was normalized on the basis of protein content and β‐actin was used as internal control for real‐time PCR. And the results were expressed as fold changes of ALP activity and mRNA abundance in experimental cultures relative to control cultures at the respective time‐point. Data were shown as mean ± S.D.
Overexpression of C/EBP‐α leads to inhibition of osteogenic differentiation of C3H10T1/2 cells induced by BMP‐2
As Fig. 2A and B showed, down‐regulation in C/EBP‐α expression was observed in terminal stage of osteogenic differentiation of C3H10T1/2 cells induced by BMP‐2, relative to early stage. Therefore, we asked whether this down‐regulation was required for osteogenic differentiation of C3H10T1/2 cells. To answer this question, we attempted to drive C3H10T1/2 cells expressing functional C/EBP‐α stably. But an elegant study by Umek et al.[45] demonstrated that the antimitogenic effect of C/EBP‐α was so strong that it was difficult to construct a cell line expressing C/EBP‐α constituently. Therefore, we sought to develop a means of expressing C/EBP‐α conditionally. Tet‐on inducible gene expression system was employed. Coding sequence of mouse C/EBP‐α, when fused to c‐myc, was cloned to pcDNA4/TO containing tetracycline operator site within the human cytomegalovirus immediate‐early promoter. Then this construct was co‐transfected into C3H10T1/2 cells along with pcDNA6/TR encoding Tet repressor. Cells were selected in zeocin and blasticidin. Protein extracts were prepared from individual clones and analyzed by Western blot using anti‐c‐myc antibody for the presence of the C/EBP‐α‐c‐myc fusion protein. One clone which was designated as ‘C/EBP‐α‐Tet’ was selected for further analysis. As Fig. 2C indicated, remarkable expression of C/EBP‐α‐c‐myc fusion protein was observed in the presence of tetracycline, although there was some leakage from the repression of C/EBP‐α‐c‐myc fusion protein by Tet repressor. We provisionally attributed this leakage to insufficient Tet repressor which could not repress the expression of C/EBP‐α completely in absence of tetracycline. Importantly, this leakage did not change responsiveness of C/EBP‐α‐Tet cells to BMP‐2 induction (Fig. 2D–F).
Having prepared a cell line conditionally expressing C/EBP‐α‐c‐myc fusion protein regulated by tetracycline, we sought to ascertain whether C/EBP‐α was involved in osteogenic differentiation of C3H10T1/2 cells induced by BMP‐2. Confluent C/EBP‐α‐Tet cells were exposed to tetracycline and/or BMP‐2 at day 0 of differentiation program. Total RNA was recovered at days 3, 7, 14 and 21 for use in real‐time PCR. The results showed that overexpression of C/EBP‐α‐c‐myc fusion protein could manage to counteract the up‐regulation of ALP (Fig. 2D), collagen I (Fig. 2E), and osteocalcin (Fig. 2F) mRNA expression resulting from BMP‐2 addition. These observations provided the evidence that overexpression of C/EBP‐α led to inhibition of osteogenic differentiation of C3H10T1/2 cells induced by BMP‐2.
The role of C/EBP‐α in attenuation of potential of adipogenic conversion of C3H10T1/2 cells in response to adipogenic hormones during its osteogenic differentiation induced by BMP‐2
It is believed that multilineage of MSCs became limited progressively during its differentiation program [46]. However, the underlying mechanisms remain elusive. To assess the role of C/EBP‐α in the balance between osteogenesis and adipogenesis of MSCs, we established a transdifferentiation model from osteogenesis to adipogenesis of C3H10T1/2 cells. At days 3 and 21 after BMP‐2 addition, media were removed and replaced with IFMD adipogenesis hormonal cocktail. Two days later, the culture medium was changed and MIX and DEX were omitted. Then at day 8 after IFMD stimulation, total RNA was recovered for use in real‐time PCR. Each culture was visually inspected and photographed to monitor adipocyte conversion.
The results showed that cells became uniformly fat‐laden in response to BMP‐2 3 d/IFMD 8 d but no lipid droplets were observed in cells cultured with BMP‐2 21 d/IFMD 8 d (Fig. 3A). Correspondingly, considerable decreases in mRNA expression of adipogenesis markers including C/EBP‐α, aP2 and glut4 in cell cultures treated by BMP‐2 21 d/IFMD 8 d were observed relative to control 21 d/IFMD 8 d but there was no variant in mRNA expression levels of these markers between BMP‐2 3 d/IFMD 8 d and control 3 d/IFMD 8 d cultures (Fig. 3B). These observations provided evidence that the potential of adipocyte conversion of C3H10T1/2 cells attenuated during its osteogenesis differentiation induced by BMP‐2.
Figure 3.
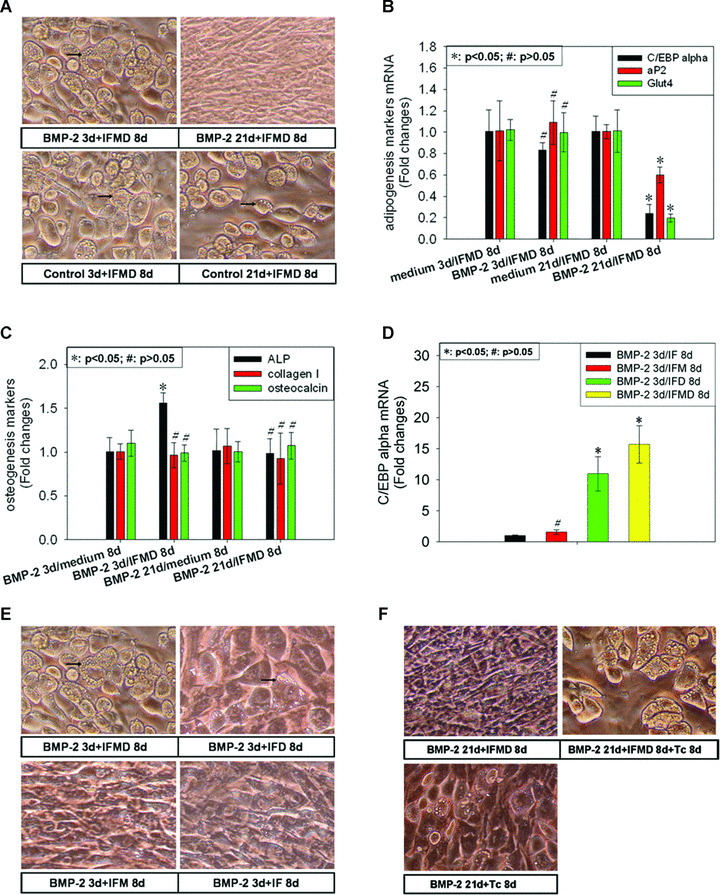
The role of C/EBP‐α in adipogenic conversion of C3H10T1/2 cells in response to adipogenic hormones during its osteogenic differentiation induced by BMP‐2. At days 3 and 21 after BMP‐2 addition, media were removed and replaced with IFMD adipogenesis hormonal cocktail containing insulin, dexamethasone (DEX), methylisobutylxanthine (MIX), and foetal bovine serum. Two days later, the culture medium was changed and MIX and DEX were omitted. Then at day 8 after IFMD stimulation, total RNA was recovered and subjected to real‐time PCR using primers for adipogenic differentiation markers including C/EBP‐α, aP2, and glut4 (B) and osteogenic differentiation markers including collagen I and osteocalcin (C). Total protein was extracted for use in ALP quantification assay (C). The result of ALP quantification was normalized on the basis of protein content and β‐actin was used as internal control for real‐time PCR. The results were expressed as fold changes of ALP activity and mRNA abundance in BMP‐2 3 d or 21 d/IFMD 8 d cultures relative to control 3 d or 21 d/IFMD 8 d cultures. Each culture was visually inspected and photographed to monitor adipogenic conversion (A). Then C3H10T1/2 cells were treated by BMP‐2 for 3 days and then followed by exposure to adipogenic hormonal cocktail in which different components were systematically omitted. Total RNA was recovered at day 8 of adipogenic hormonal cocktail stimulation and subjected to real‐time PCR using primer for C/EBP‐α (D). The results were expressed as fold changes of mRNA abundance in IFMD, IFD or IFM cultures relative to IF cultures. Each culture was visually inspected and photographed to monitor adipogenic conversion (E). Finally we exposed confluent ‘C/EBP‐α‐Tet’ cells – a cell line conditionally expressing C/EBP‐α regulated by tetracycline – to BMP‐2 for 21 days and then followed by IFMD and/or tetracycline stimulation. At day 8 of adipogenic differentiation program, each culture was visually inspected and photographed to monitor adipogenic conversion (F). Data of real‐time PCR were shown as mean ± S.D. All photographic fields shown in this figure were chosen in an unbiased manner.
We then asked whether osteogenic phenotype of C3H10T1/2 cells derived from BMP‐2 stimulation could be reversed by IFMD addition. ALP quantification assay and real‐time PCR using specific primers for osteogenesis markers including collagen I and osteocalcin were performed to investigate osteogenic phenotype at time‐point of both BMP‐2 3 d/IFMD 8 d and BMP‐2 21 d/IFMD 8 d. As Fig. 3C indicated, IFMD treatment for 8 days could not reverse osteogenic phenotype established during BMP‐2 stimulation for 21 days. Likewise, no variant in mRNA expression level of collagen I and osteocalcin was observed between BMP‐2 3 d/IFMD 8 d and BMP‐2 3 d/control 8 d. We provisionally attributed the latter observation to immature osteogenic phenotype established from short‐time BMP‐2 stimulation as shown in Fig. 1C and D. Even ALP level was elevated significantly by IFMD stimulation for 8 days in cultures treated by BMP‐2 for 3 days. We were of the opinion that it might be due to stimulatory effect of DEX on ALP expression [47, 48]. Taken together, these observations provided a hint that the transdifferentiation from osteogenesis to adipogenesis in early stage of osteogenesis of C3H10T1/2 cells induced by BMP‐2 (BMP‐2 3 d) was reversible, whereas the transdifferentiation in terminal stage (BMP‐2 21 d) was not.
The role of C/EBP‐α in attenuation of potential of adipogenic conversion of C3H10T1/2 cells in response to adipogenic hormones during its osteogenic differentiation induced by BMP‐2
Having observed a general concordance between mRNA expression of C/EBP‐α and the outcome of adipocyte conversion in transdifferentiation from osteogenesis to adipogenesis during osteogenic differentiation of C3H10T1/2 cells induced by BMP‐2 (Fig. 3A and B), we wondered what relationship existed between them. A previous study by Yeh et al.[44] favoured a hierarchy positioning C/EBP‐β closer than C/EBP‐δ to C/EBP‐α, the product of which has heretofore been assigned primary responsibility for execution of terminal events in the differentiation program [25, 26, 27, 45]. And one gene (c/ebp‐β) is induced by MIX and the other (c/ebp‐δ) by DEX. Therefore, C3H10T1/2 cells were treated by BMP‐2 for 3 days and then followed by exposure to adipogenic hormonal cocktail in which different components were systematically omitted. Total RNA was recovered at day 8 of adipogenic hormonal cocktail stimulation for use in real‐time PCR. Optimal differentiation was observed using a complete cocktail (Fig. 3E). Real‐time PCR revealed significantly higher level of C/EBP‐α mRNA expression with ∼16 folds relative to insulin and fetal bovine serum (IF) culture (Fig. 3D). Cultures deprived of MIX did not show uniform differentiation of the entire cell population (Fig. 3E). Correspondingly, there was a remarkable elevation in C/EBP‐α mRNA expression level with ∼11 folds (Fig. 3D). Finally, cultures deprived of DEX showed very minimal evidence of differentiation by day 8 (Fig. 3E). And no variant in C/EBP‐α mRNA expression level was observed between IFD and IF cultures (Fig. 3D). These observations provided an interesting hint that C/EBP‐α might play an important role in adipogenic conversion of C3H10T1/2 cells during its osteogenesis induced by BMP‐2.
To test the role of C/EBP‐α in adipocyte conversion of C3H10T1/2 cells, we exposed confluent ‘C/EBP‐α‐Tet’ cells – a cell line conditionally expressing C/EBP‐α regulated by tetracycline – to BMP‐2 for 21 days and then followed by IFMD and/or tetracycline stimulation. By day 8 of adipogenic differentiation program, each culture was visually inspected and photographed to monitor adipogenic conversion. Remarkable adipogenic differentiation was observed in BMP‐2 21 d/IFMD 8 d/Dox 8 d cultures even though not entire cell population. Interestingly, overexpression of C/EBP‐α and lack of IFMD treatment after BMP‐2 incubation for 21 days could led to adipogenic differentiation although not as remarkable as BMP‐2 21 d/IFMD 8 d/Dox 8 d cultures (Fig. 3F). These observations provided evidence that C/EBP‐α was responsible for adipogenic conversion of C3H10T1/2 cells during its osteogenesis induced by BMP‐2 in significant part, if not all.
Identification of C/EBP‐α promoter regions which were responsible for its mRNA expression pattern during osteogenesis of C3H10T1/2 cells induced by BMP‐2 and adipogenic conversion in this process
Having established an important role of C/EBP‐α in osteogenesis of C3H10T1/2 cells induced by BMP‐2 and adipogenic conversion during this process, we set out to elucidate the underlying molecular mechanisms. We amplified the mouse C/EBP‐α promoter –1381 bp/+45 bp by PCR using genomic DNA as a template and generated three deletion constructs, −1009 bp/+45 bp, −420 bp/+45 bp, and −55 bp/+45 bp. The various C/EBP‐α promoter fragments were cloned into pGL3‐basic vector (Fig. 4A). Then transient reporter assay was performed in cell cultures which were treated with or without BMP‐2 for 3, 7, 14 and 21 days. A significant reduction in the promoter activity was observed in −420 bp/+45 bp reporter compared with −1009 bp/+45 bp reporter at day 3 after BMP‐2 addition (Fig. 4B). And there were BMP‐2‐response elements in −1381 bp/−1009 bp, −1009 bp/−420 bp and −420 bp/−55 bp region whose deletion caused a significant decrease in the activity of C/EBP‐α promoter upon BMP‐2 stimulation for 7 days (Fig. 4B). And at day 14, the deletion of −1009 bp/−420 bp or −420 bp/−55 bp led to a significant decrease in C/EBP‐α promoter activity (Fig. 4B). At day 21, the deletion of −1381 bp/−1009 bp or −420 bp/−55 bp resulted in a significant reduction in promoter activity (Fig. 4B).
Figure 4.
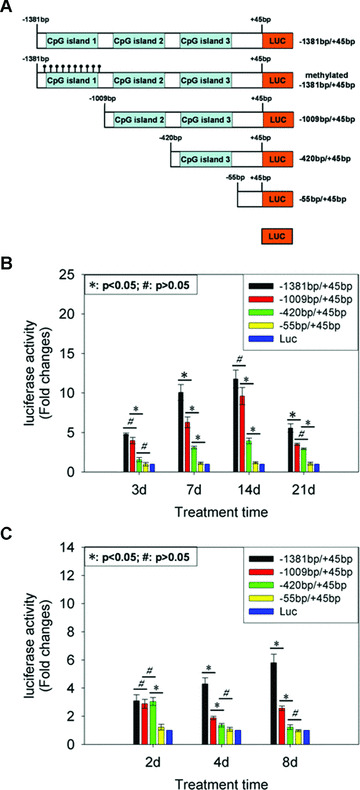
Identification of C/EBP‐α promoter regions which were responsible for its mRNA expression pattern during osteogenesis of C3H10T1/2 cells induced by BMP‐2 and adipogenic conversion in this process. We amplified the mouse C/EBP‐α promoter −1381 bp/+45 bp by PCR using genomic DNA as a template and generated three deletion constructs, −1009 bp/+45 bp, −420 bp/+45 bp, and −55 bp/+45 bp. The various C/EBP‐α promoter fragments were cloned into pGL3‐basic vector (A). Transient reporter assay was performed in cell cultures which were treated with or without BMP‐2 for 3, 7, 14 and 21 days (B). The results were expressed as fold changes in relative luciferase unit (RLU) of BMP‐2‐treated cultures relative to vehicle‐treated cultures. Then we exposed confluent C3H10T1/2 cells to BMP‐2 for 21 days firstly and then transfected the deletion constructs of the C/EBP‐α promoter into them and the culture medium was replaced with IFMD adipogenic hormonal cocktail. The luciferase activity was measured 2, 4 and 8 days after transfection. The results were expressed as fold changes of RLU of BMP‐2 21 d/IFMD cultures, relative to BMP‐2 21 d/control cultures. Data were shown as mean ± S.D.
To elucidate the critical regions in the C/EBP‐α promoter, which were responsible for its mRNA expression in adipocyte conversion during osteogenesis induced by BMP‐2, we exposed confluent C3H10T1/2 cells to BMP‐2 for 21 days firstly and then transfected the deletion constructs of the C/EBP‐α promoter into them and the culture medium was replaced with IFMD adipogenic hormonal cocktail. The luciferase activity was measured 2, 4 and 8 days after transfection. A significant reduction in the promoter activity was observed in −55 bp/+45 bp reporter compared with −420 bp/+45 bp reporter at day 2 after IFMD stimulation (Fig. 4C). And there were IFMD‐response elements in −1381 bp/−1009 bp and −1009 bp/−420 bp region whose deletion caused a decrease in the activity of C/EBP‐α promoter upon IFMD stimulation for 4 days (Fig. 4C). At day 8, the deletion of −1381 bp/−1009 bp resulted in a significant reduction in promoter activity (Fig. 4C).
Remarkable DNA hypermethylation and histones 3 and 4 hypoacetylation in −1286 bp/−1065 bp promoter region of C/EBP‐α are observed in terminal stage of osteogenic differentiation of C3H10T1/2 cells, in contrast to early stage
Having observed the down‐regulation of C/EBP‐α expression terminal stage of osteogenic differentiation of C3H10T1/2 cells induced by BMP‐2, we sought to investigate the molecular mechanisms. Notably, analysis of C/EBP‐α promoter region with the MethPrimer computer program (http://www.urogene.org/methprimer/) [49] revealed that there were three remarkable CpG islands in about 1.5 kb upstream promoter region (Fig. 5A).
Figure 5.
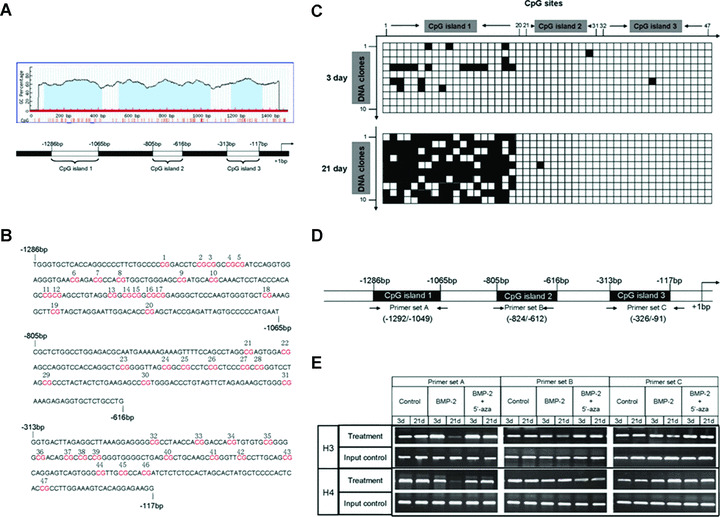
The pattern of DNA methylation and histones 3 and 4 acetylaiton of C/EBP‐α promoter region at day 3 or 21 after BMP‐2 addition in C3H10T1/2 cells. Analysis of C/EBP‐α promoter region with the MethPrimer computer program (http://www.urogene.org/methprimer/) revealed that there were three remarkable CpG islands (blue region) in promoter region (A). Three regions corresponding to three CpG islands, respectively, were named as CpG island 1 (−1286 bp/−1065 bp), CpG island 2 (−805 bp/−616 bp) and CpG island 3 (−313 bp to −117 bp). There are totally 47 CpG sites in three CpG islands (in red) numbered from 1 to 47 (B). Nuclear genomic DNA from cells cultured with BMP‐2 for both 3 and 21 days was treated with bisulphite and three discrete regions corresponding to three CpG islands were amplified and cloned into plasmid vector. And then ten clones per island were sequenced and used to assess methylation pattern of total 47 CpG sties (C). ▪represents methylated‐CpG site and □ represents unmethylated‐CpG site. Chromatin IP using anti‐acetylated histones 3 (top panel) and 4 (bottom panel) antibodies and PCR using three primer sets corresponding to three CpG islands were employed at days 3 and 21 after vehicle, BMP‐2 or BMP‐2+5′‐aza addition in C3H10T1/2 cells (D and E).
To explore CpG methylation pattern in C/EBP‐α promoter region during osteogenesis of C3H10T1/2 cells, nuclear genomic DNA from cells cultured with BMP‐2 for both 3 and 21 days was treated with bisulphite and three discrete regions corresponding to three CpG islands, respectively, which were named as CpG island 1 (−1286 bp/−1065 bp, 20 CpG sites in it), CpG island 2 (−805 bp/−616 bp, 11 CpG sites in it) and CpG island 3 (−313 bp to −117 bp, 16 CpG sites in it), were amplified and cloned into plasmid vector. And then ten clones per island were sequenced and used to assess methylation pattern of total 47 CpG sites in C/EBP‐α promoter region (Fig. 5B). The results showed that there was remarkable DNA hypermethylation in CpG island 1 in terminal stage of osteogenesis of C3H10T1/2 cells relative to early stage. However, there was no variant in DNA methylation pattern in both CpG islands 2 and 3 between early and terminal stage of osteogenesis, in which almost all of CpG sites remained non‐methylated (Fig. 5C). It was necessary to mention that CpG sites within three CpG islands in control cultures remained almost non‐methylated (data not shown).
Then we explored the pattern of histones 3 and 4 acetylation – another important form of epigenetic modification – in C/EBP‐α promoter region during osteogenesis of C3H10T1/2 cells induced by BMP‐2. Chromatin immunoprecipitation (IP) using anti‐acetylated histones 3 and 4 antibodies and PCR using three primer sets corresponding to three CpG islands were employed at days 3 and 21 after vehicle, BMP‐2 or BMP‐2+5′‐aza addition in C3H10T1/2 cells (Fig. 5D). The results showed that there was remarkable hypoacetylation of histones 3 and 4 in CpG island 1 in terminal stage of osteogenesis of C3H10T1/2 cells relative to early stage. However, there was no variant in histone acetylation pattern in both CpG islands 2 and 3 between early and terminal stage of osteogenesis. Interestingly, 5′‐aza, an inhibitor of DNA methyltransferase which causes DNA hypomethylation, could rescue histones 3 and 4 hypoacetylation in CpG island 1 in cells cultured with BMP‐2 for 21 days successfully. This observation indicated that the level of histones 3 and 4 acetylation in C/EBP‐α promoter region corresponding to CpG island 1 depended on the level of DNA methylation in that region to some extent (Fig. 5E).
The significance of epigenetic modifications in C/EBP‐α promoter region during osteogenic differentiation of C3H10T1/2 cells induced by BMP‐2
It was known that CpG methylation could induce gene expression silencing [50, 51]. To investigate whether DNA hypermethylation in CpG island 1 was involved in down‐regulation of C/EBP‐α expression in terminal stage of osteogenesis of C3H10T1/2 cells induced by BMP‐2, cells were pre‐treated with 1 μM 5′‐aza which causes DNA hypomethylation and cultured with BMP‐2 for 3 and 21 days. Total RNA was extracted and subjected to real‐time PCR. The results showed that 5′‐aza could rescue the down‐regulation of C/EBP‐α mRNA expression in terminal stage of osteogenic differentiation of C3H10T1/2 cells but had no significant effect on it in early stage (Fig. 6A).
Figure 6.
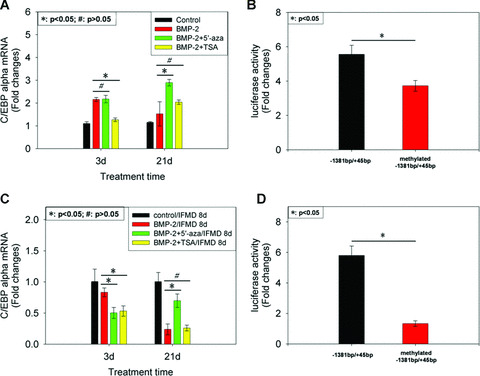
The significance of epigenetic modifications in C/EBP‐α promoter region during osteogenic differentiation of C3H10T1/2 cells induced by BMP‐2. C3H10T1/2 cells were pre‐treated with 1 μM 5′‐azacytidine (5′‐aza) or 300 nM trichostatin A (TSA) and cultured with BMP‐2 for 3 and 21 days. Total RNA was extracted and subjected to real‐time PCR using primer for C/EBP‐α (A). β‐actin was used as internal control. The results were represented as fold changes of mRNA abundance in experimental cultures relative to control cultures at the respective time‐point. Then M.SssI was used to methylate all the CpG sites in CpG island 1 in vitro and a transient reporter assay was performed in cell cultures treated with or without BMP‐2 for 21 days (B). The results were expressed as fold changes in relative luciferase unit (RLU) of BMP‐2‐treated cultures relative to control cultures. C3H10T1/2 cells were pre‐treated with either 1 μM 5′‐aza or 300 nM TSA and cultured with BMP‐2 for 3 and 21 days and then followed by IFMD adipogenic stimulation. At day 8 after IFMD simulation, total RNA was extracted from C3H10T1/2 cells and subjected to real‐time PCR using primer for C/EBP‐α (C). The results were represented as fold changes of mRNA abundance in BMP‐2 3 d or 21 d/IFMD 8 d cultures relative to control 3 d or 21d/IFMD 8d cultures at the respective time‐point. Then transient reporter assay was performed in cell cultures that were treated by BMP‐2 for 21 days and followed by IFMD or vehicle treatment for 8 days (D). The results were expressed as fold changes of RLU of BMP‐2/IDMB‐treated cultures, relative to BMP‐2/vehicle‐treated cultures. All of data above were shown as mean ± S.D.
Because of its global hypomethylation, the ability of 5′‐aza to activate C/EBP‐α gene expression in cell cultures treated with BMP‐2 for 21 days could be indirect or direct. We thus investigated whether DNA hypermethylation of the CpG island 1 directly contributed to the down‐regulation of C/EBP‐α mRNA expression in terminal stage of osteogenesis of C3H10T1/2 cells. M.SssI was used to methylate all the CpG sites in CpG island 1 in vitro and a transient reporter assay was performed in cell cultures treated with or without BMP‐2 for 21 days. Figure 6B showed that in vitro methylation of CpG island 1 led to an unremarkable but statistically significant reduction in luciferase activity of −1381 bp/+45 bp construct on BMP‐2 stimulation. This result was consistent with a direct effect of 5′‐aza.
To explore whether hypoacetylaion of histones 3 and 4 in CpG island 1 was involved in the down‐regulation of C/EBP‐α mRNA expression in terminal stage of osteogenesis of C3H10T1/2 cells, cells were pre‐treated with 300 nM TSA which causes hyperacetylation and cultured with BMP‐2 for 3 and 21 days. The result showed that TSA could raise the level of C/EBP‐α mRNA expres sion mildly in terminal stage of osteogenesis of C3H10T1/2 cells but lead to the down‐regulation of C/EBP‐α mRNA expression in early stage through unknown mechanisms (Fig. 6A).
As shown in Figure 3B, inducibility of C/EBP‐α mRNA expression was down‐regulated in adipocyte conversion in terminal stage of osteogenesis of C3H10T1/2 cells relative to early stage. To investigate whether DNA hypermethylation and histone hypoacetylation were involved in it, cells were pre‐treated with either 1 μM 5′‐aza or 300 nM TSA and cultured with BMP‐2 for 3 and 21 days and then followed by IFMD adipogenic stimulation. At day 8 after IFMD simulation, total RNA was extracted from C3H10T1/2 cells and subjected to real‐time PCR. The results showed that 5′‐aza could rescue attenuation of C/EBP‐α inducibility to IFMD stimulation in terminal stage of osteogenesis of C3H10T1/2 cells but TSA could not (Fig. 6C). Therefore, a hypothesis was raised that DNA hypermethylation might play an important role in the down‐regulation of inducibility of C/EBP‐α mRNA expression in adipocyte conversion in terminal stage of osteogenesis of C3H10T1/2 cells.
We thus test this hypothesis employing in vitro methylation and transient reporter assay in cell cultures that were treated by BMP‐2 for 21 days and followed by IFMD or vehicle treatment for 8 days. The results showed that in vitro methylation of CpG island 1 led to a remarkable reduction in luciferase activity of −1381 bp/+45 bp construct on IDMB stimulation (Fig. 6D).
Discussion
Differentiation of MSCs is not a separate but integrated process which requires the involvement of every lineage commitment pathway. There is a close link between adipogenic and osteogenic differentiation of MSCs [5, 52]. More and more evidence suggest that a large degree of plasticity exists between osteoblasts and adipocytes and that this transdifferentiation is reciprocal to some extent [53], although the underlying mechanisms remain poorly understood. Exploring the balance between adipogenic and osteogenic differentiation of MSCs could help to elucidate the mechanisms of MSCs’ osteogenic differentiation, but also be of great importance to treat some diseases characteristic of bone loss and adipocytes accumulation. In this report, down‐regulations of both C/EBP‐α expression and its inducibility in response to IFMD adipogenic hormonal cocktail were observed in terminal stage of osteogenesis of C3H10T1/2 cells induced by BMP‐2. And overexpression of C/EBP‐α could lead to inhibition of osteogenesis differentiation of C3H10T1/2 cells induced by BMP‐2 and rescue attenuation of potential of adipogenic conversion in this process. Furthermore, we provided evidence that remarkable DNA hypermethylation and histones 3 and 4 hypoacetylation in −1286 bp/−1065 bp promoter region of C/EBP‐α, which was observed in terminal stage of osteogenesis of C3H10T1/2 cells, were involved in both of the down‐regulations in this process.
Identification of potential target gene is prerequisite for the elucidation of relationship between osteogenesis and adipogenesis of MSCs. In the past few years, the important role of PPAR‐γ– one of key transcription factors in adipogenic differentiation – in the balance between them has been established. Akune et al.[54] demonstrated that haploinsufficiency of PPAR‐γ promotes bone formation. The reciprocal relationship between PPAR‐γ levels and osteogenesis is particularly evident with increased age [55], supporting a role for PPAR‐γ in bone development and osteoporosis associated with aging. Furthermore, in vitro analyses demonstrated that various PPAR‐γ ligands not only induce murine bone marrow stromal cell adipogenesis but also inhibit osteogenesis [8]. Additionally, recent studies showed that a point mutation in the ligand binding domain (exon 6, C161T) of PPAR‐γ is associated with decreased levels of osteoprotegerin in postmenopausal women [56].
However, in contrast to PPAR‐γ, very little is known about the role of C/EBP‐α– another key transcription factor in adipogenic differentiation – in the balance between osteogenesis and adipogenesis of MSCs. Our current study provided evidence that C/EBP‐α may be a potential target gene which could be used to explore the relationship between osteogenesis and adipogenesis of C3H10T1/2 cells.
On one hand, C/EBP‐α expression levels showed a biphasic response to incubation with BMP‐2, that is, rose from days 0 to 7 and thereupon fell progressively from days 7 to 21. At present, two different signal transduction pathways of BMP‐2 have been identified: one is the Smad pathway and the other is mitogen‐ activated protein (MAP) kinase cascades [57, 58]. It is believed that direct activation of many target genes by Smad proteins or mitogen‐activated protein kinase (MAPK) takes only one or several hours [59, 60]. Is it possible that BMP‐2 activates C/EBP‐α mRNA expression through these two pathways? At least our findings in the present study could not support this hypothesis. In this report BMP‐2 treatment of C3H10T1/2 cells from 0.5 to 24 hrs failed to activate C/EBP‐α mRNA expression (data not shown). This observation gave a hint that it was not through direct binding of Smad or MAPK on its promoter that C/EBP‐α mRNA expression was activated.
As for progressive down‐regulation of C/EBP‐α expression in terminal stage of osteogenesis, we asked whether it was required for terminal osteogenesis differentiation of C3H10T1/2 cells induced by BMP‐2. To answer this question, we overexpressed C/EBP‐α and found that ALP, collagen I, and osteocalcin expression were inhibited in response to C/EBP‐α overexpression. Similarly, it was previously shown by several reports that inverse relationship existed between C/EBP‐α and osteogenesis differentiation markers expression [17, 61, 62]. Obviously taken together with the results of the present report, these findings highlighted the role of C/EBP‐α in the balance between osteogenesis and adipogenesis of C3H10T1/2 cells, due to its ability to inhibit the expression of osteogenesis differentiation markers.
On the other hand, inducibility of C/EBP‐α, together with other adipogenesis differentiation markers (aP2 and glut4), was down‐regulated in response to IFMD adipogenic hormonal cocktail in terminal stage of osteogenesis of C3H10T1/2 cells induced by BMP‐2, which was accompanied by attenuation of potential of adipocyte conversion. Given the essential role of C/EBP‐α in adipogenic differentiation which has been well established [22, 25, 28], a hypothesis was raised that down‐regulation of inducibility of C/EBP‐α in response to IFMD in terminal stage of osteogenesis was responsible for attenuation of potential of adipogenic conversion. Then we overexpressed C/EBP‐α and the results backed up this hypothesis.
More interesting observations resulted from experiments wherein either of DEX and MIX was omitted singly. Two genes that might represent targets for the early effect of MIX and DEX action during adipocyte conversion were identified several years ago [63]. Both encode proteins highly related to C/EBP‐α that have thus been termed C/EBP‐β and C/EBP‐δ. The c/ebp‐β and c/ebp‐δ genes are expressed during adipogenesis with temporal kinetics matching hormone presentation. Moreover, a study by Yeh et al.[44] provided evidence that the level of C/EBP‐α expression was modestly diminished in cultures deprived of MIX and almost no C/EBP‐α was observed when cultures were deprived of DEX. In the present report, we got similar results. More importantly, we combined C/EBP‐α expression activated by different components of IFMD with potential of adipocyte conversion during osteogenesis of C3H10T1/2 cells induced by BMP‐2.
Bone development is relatively well understood at the cellular and molecular level [64]. Model of osteoblast differentiation demonstrates that there are three compartments (stem cell, transitamplifying compartment, and terminal differentiation) and two key transits. The transition between the stem cell and transitamplifying compartment is notionally reversible, whereas the transition between the transit‐amplifying compartment and the terminally differentiation compartment is not. The finding of our report was consistent with this model. IFMD treatment failed to induce adipocyte conversion and could not counteract osteoblastic phenotype of C3H10T1/2 cells in terminal stage of osteogenesis induced by BMP‐2, whereas IFMD treatment managed to drive adipocyte conversion of C3H10T1/2 cells in early stage of osteogenesis. Interpreted most simply, these observations indicated that osteoblastic phenotype in early stage of osteogenesis of C3H10T1/2 cells induced by BMP‐2 could be reversed, whereas osteoblastic phenotype in terminal stage could not be.
In order to elucidate the molecular mechanisms through which C/EBP‐α expression was regulated during osteogenesis of C3H10T1/2 cells induced by BMP‐2, we focused on epigenetic modifications in its promoter region. Several papers have described epigenetic modifications of C/EBP‐α. A study by Takai et al.[65] demonstrated that C/EBP‐α expression remained low in endometrial cancer cell lines and clinical samples through epigenetic modifications of DNA methylation and histone 3 acetylation. Tada et al.[66] showed that DNA methylation and histone acetylation in the upstream region (−1422 bp/−896 bp) of the C/EBP‐α promoter were associated with low or absent C/EBP‐α expression in 12 of 15 lung cancer cell lines and in 81 of 120 primary lung tumours. Bennett et al.[67] demonstrated that C/EBP‐α was down‐regulated in head and neck squamous carcinoma by loss of heterozygosity and DNA methylation, but not by gene mutation. Bararia et al.[68] characterized the association of the MYST domain histone acetyltransferase Tat‐interactive protein 60 with C/EBP‐α. In the current study, DNA hypermethylation and histones 3 and 4 hypoacetylation in −1286 bp/−1065 bp promoter region of C/EBP‐α were observed during osteogenesis of C3H10T1/2 cells induced by BMP‐2. Furthermore we provided evidence that epigenetic modifications were involved in the down‐regulation of C/EBP‐α mRNA expression and the attenuation of its inducibility in response to IFMD in this process. These findings established a biological model which showed that epigenetic modifications in C/EBP‐α promoter region played an important role in osteogenesis of C3H10T1/2 cells.
Perhaps the most interesting observation of this report was that 5′‐aza could rescue histones 3 and 4 hypoacetylation in CpG island 1 in cultures treated by BMP‐2 for 21 days successfully. This observation indicated that the level of histones 3 and 4 acetylation in C/EBP‐α promoter region corresponding to CpG island 1 depended on the level of DNA methylation in that region at least in significant part, if not all. In fact, it has been revealed that CpG methylation, chromatin structure and gene silencing is a three‐way connection [69]. Gene‐specific methylation patterns correlate inversely with gene activity and artificial demethylation of gene sequences results in activation, whereas in vitro methylation of promoter sequences represses gene activity [70]. However, microinjection and transfection experiments using in vitro methylated gene sequences revealed that DNA methylation results in the formation of inactive chromatin [71], and that the silencing effect exerted by CpG methylation is observed only after the methylated DNA acquired its appropriate chromatin structure [72]. The chromatin structure within the nucleus is largely maintained by the binding of structural chromatin proteins. Most prominent among those are the core and linker histones, which form the protein aceous structural backbone of chromatin. The level of histone acetylation determines chromatin structure to a large extent. Methylation of CpG islands causes stable heritable transcriptional silencing through binding of methyl‐DNA‐specific proteins to affected CpG islands attracts histone‐modifying enzymes, which focally establish a silenced chromatin state.
As for the dependence of DNA methylation and histone acetylation observed in this report, we offered one possible explanation for it. A study by Ying Zuo et al.[73] provided evidence that PPAR‐γ could activate C/EBP‐α expression by dislodging HDAC1 from the promoter for degradation in the proteasome. Further, we have observed a putative PPAR‐γ binding site located within CpG island 1 (−1286 bp/−1065 bp) of C/EBP‐α promoter region (our unpublished data). So we postulated that it might be DNA hypermethylation of CpG island 1 in C/EBP‐α promoter region in the terminal stage of osteogenesis that prevented PPAR‐γ from binding to CpG island 1. Therefore, HDAC1 accumulated onto the CpG island 1, which led to histone hypoacetylation in this region. Further analysis was required to test this model.
Acknowledgements
We thank Professor Di Chen (University of Rochester Medical Center) and Gang Li (Queen’s University Belfast) for much useful advice. This work is supported by the National Basic Research Program (973 Program) (Grant no. 2007CB936101), National Natural Science Foundation of China (Grant nos. 30700402 & 30871435), Shanghai Key Laboratory of Orthopaedic Implant (08DZ2230300), and Shanghai Rising‐Star Program (07QA14062).
References
- 1. Burkhardt R, Kettner G, Bohm W, et al . Changes in trabecular bone, hematopoiesis and bone marrow vessels in aplastic anemia, primary osteoporosis, and old age: a comparative histomorphometric study. Bone. 1987; 8: 157–64. [DOI] [PubMed] [Google Scholar]
- 2. Kajkenova O, Lecka‐Czernik B, Gubrij I, et al . Increased adipogenesis and myelopoiesis in the bone marrow of SAMP6, a murine model of defective osteoblastogenesis and low turnover osteopenia. J Bone Miner Res. 1997; 12: 1772–9. [DOI] [PubMed] [Google Scholar]
- 3. Meunier P, Aaron J, Edouard C, et al . Osteoporosis and the replacement of cell populations of the marrow by adipose tissue. A quantitative study of 84 iliac bone biopsies. Clin Orthop Relat Res. 1971; 80: 147–54. [DOI] [PubMed] [Google Scholar]
- 4. Kaplan FS, Shore EM. Progressive osseous heteroplasia. J Bone Miner Res. 2000; 15: 2084–94. [DOI] [PubMed] [Google Scholar]
- 5. Nuttall ME, Gimble JM. Is there a therapeutic opportunity to either prevent or treat osteopenic disorders by inhibiting marrow adipogenesis Bone. 2000; 27: 177–84. [DOI] [PubMed] [Google Scholar]
- 6. Gimble JM, Robinson CE, Wu X, et al . Peroxisome proliferator‐activated receptor‐gamma activation by thiazolidinediones induces adipogenesis in bone marrow stromal cells. Mol Pharmacol. 1996; 50: 1087–94. [PubMed] [Google Scholar]
- 7. Lecka‐Czernik B, Gubrij I, Moerman EJ, et al . Inhibition of Osf2/Cbfa1 expression and terminal osteoblast differentiation by PPARgamma2. J Cell Biochem. 1999; 74: 357–71. [PubMed] [Google Scholar]
- 8. Lecka‐Czernik B, Moerman EJ, Grant DF, et al . Divergent effects of selective peroxisome proliferator‐activated receptor‐gamma 2 ligands on adipocyte versus osteoblast differentiation. Endocrinology. 2002; 143: 2376–84. [DOI] [PubMed] [Google Scholar]
- 9. Rzonca SO, Suva LJ, Gaddy D, et al . Bone is a target for the antidiabetic compound rosiglitazone. Endocrinology. 2004; 145: 401–6. [DOI] [PMC free article] [PubMed] [Google Scholar]
- 10. Tornvig L, Mosekilde LI, Justesen J, et al . Troglitazone treatment increases bone marrow adipose tissue volume but does not affect trabecular bone volume in mice. Calcif Tissue Int. 2001; 69: 46–50. [DOI] [PubMed] [Google Scholar]
- 11. Sciaudone M, Gazzerro E, Priest L, et al . Notch 1 impairs osteoblastic cell differentiation. Endocrin-ology. 2003; 144: 5631–9. [DOI] [PubMed] [Google Scholar]
- 12. Garces C, Ruiz‐Hidalgo MJ, Font de Mora J, et al . Notch‐1 controls the expression of fatty acid‐activated transcription factors and is required for adipogenesis. J Biol Chem. 1997; 272: 29729–34. [DOI] [PubMed] [Google Scholar]
- 13. Gong Y, Slee RB, Fukai N, et al . LDL receptor‐related protein 5 (LRP5) affects bone accrual and eye development. Cell. 2001; 107: 513–23. [DOI] [PubMed] [Google Scholar]
- 14. Boyden LM, Mao J, Belsky J, et al . High bone density due to a mutation in LDL‐receptor‐related protein 5. N Engl J Med. 2002; 346: 1513–21. [DOI] [PubMed] [Google Scholar]
- 15. Little RD, Carulli JP, Del Mastro RG, et al . A mutation in the LDL receptor‐related protein 5 gene results in the autosomal dominant high‐bone‐mass trait. Am J Hum Genet. 2002; 70: 11–9. [DOI] [PMC free article] [PubMed] [Google Scholar]
- 16. Fux C, Mitta B, Kramer BP, et al . Dual‐regulated expression of C/EBP‐alpha and BMP‐2 enables differential differentiation of C2C12 cells into adipocytes and osteoblasts. Nucleic Acids Res . 2004; 32: e1. [DOI] [PMC free article] [PubMed] [Google Scholar]
- 17. Kang S, Bennett CN, Gerin I, et al . Wnt signaling stimulates osteoblastogenesis of mesenchymal precursors by suppressing CCAAT/enhancer‐binding protein alpha and peroxisome proliferator‐activated receptor gamma. J Biol Chem. 2007; 282: 14515–24. [DOI] [PubMed] [Google Scholar]
- 18. Johnson PF, Landschulz WH, Graves BJ, et al . Identification of a rat liver nuclear protein that binds to the enhancer core element of three animal viruses. Genes Dev. 1987; 1: 133–46. [DOI] [PubMed] [Google Scholar]
- 19. Landschulz WH, Johnson PF, Adashi EY, et al . Isolation of a recombinant copy of the gene encoding C/EBP. Genes Dev. 1988; 2: 786–800. [DOI] [PubMed] [Google Scholar]
- 20. Birkenmeier EH, Gwynn B, Howard S, et al . Tissue‐specific expression, developmental regulation, and genetic mapping of the gene encoding CCAAT/enhancer binding protein. Genes Dev. 1989; 3: 1146–56. [DOI] [PubMed] [Google Scholar]
- 21. Cornelius P, MacDougald OA, Lane MD. Regulation of adipocyte development. Annu Rev Nutr. 1994; 14: 99–129. [DOI] [PubMed] [Google Scholar]
- 22. MacDougald OA, Lane MD. Transcriptional regulation of gene expression during adipocyte differentiation. Annu Rev Biochem. 1995; 64: 345–73. [DOI] [PubMed] [Google Scholar]
- 23. Kaestner KH, Christy RJ, Lane MD. Mouse insulin‐responsive glucose transporter gene: characterization of the gene and trans‐activation by the CCAAT/enhancer binding protein. Proc Natl Acad Sci USA. 1990; 87: 251–5. [DOI] [PMC free article] [PubMed] [Google Scholar]
- 24. Kaestner KH, Ntambi JM, Kelly TJ Jr, et al . Differentiation‐induced gene expression in 3T3‐L1 preadipocytes. A second differentially expressed gene encoding stearoyl‐CoA desaturase. J Biol Chem. 1989; 264: 14755–61. [PubMed] [Google Scholar]
- 25. Lin FT, Lane MD. CCAAT/enhancer binding protein alpha is sufficient to initiate the 3T3‐L1 adipocyte differentiation program. Proc Natl Acad Sci USA. 1994; 91: 8757–61. [DOI] [PMC free article] [PubMed] [Google Scholar]
- 26. Lin FT, Lane MD. Antisense CCAAT/enhancer‐binding protein RNA suppresses coordinate gene expression and triglyceride accumulation during differentiation of 3T3‐L1 preadipocytes. Genes Dev. 1992; 6: 533–44. [DOI] [PubMed] [Google Scholar]
- 27. Samuelsson L, Stromberg K, Vikman K, et al . The CCAAT/enhancer binding protein and its role in adipocyte differentiation: evidence for direct involvement in terminal adipocyte development. EMBO J. 1991; 10: 3787–93. [DOI] [PMC free article] [PubMed] [Google Scholar]
- 28. Wang ND, Finegold MJ, Bradley A, et al . Impaired energy homeostasis in C/EBP alpha knockout mice. Science. 1995; 269: 1108–12. [DOI] [PubMed] [Google Scholar]
- 29. Wu H, Sun YE. Epigenetic regulation of stem cell differentiation. Pediatr Res . 2006; 59: 21R–5R. [DOI] [PubMed] [Google Scholar]
- 30. Reed BC, Lane MD. Insulin receptor synthesis and turnover in differentiating 3T3‐L1 preadipocytes. Proc Natl Acad Sci USA. 1980; 77: 285–9. [DOI] [PMC free article] [PubMed] [Google Scholar]
- 31. Student AK, Hsu RY, Lane MD. Induction of fatty acid synthetase synthesis in differentiating 3T3‐L1 preadipocytes. J Biol Chem. 1980; 255: 4745–50. [PubMed] [Google Scholar]
- 32. Laverrière JN, Muller M, Buisson N, et al . Differential implication of deoxyribonucleic acid methylation in rat prolactin and rat growth hormone gene expressions: a comparison between rat pituitary cell strains. Endocrinology. 1986; 118: 198–206. [DOI] [PubMed] [Google Scholar]
- 33. Frommer M, McDonald LE, Millar DS, et al . A genomic sequencing protocol that yields a positive display of 5‐methylcytosine residues in individual DNA strands. Proc Natl Acad Sci USA. 1992; 89: 1827–31. [DOI] [PMC free article] [PubMed] [Google Scholar]
- 34. Clark SJ, Harrison J, Paul CL, et al . High sensitivity mapping of methylated cytosines. Nucleic Acids Res. 1994; 22: 2990–7. [DOI] [PMC free article] [PubMed] [Google Scholar]
- 35. Feil R, Charlton J, Bird AP, et al . Methylation analysis on individual chromosomes: improved protocol for bisulphite genomic sequencing. Nucleic Acids Res. 1994; 22: 695–6. [DOI] [PMC free article] [PubMed] [Google Scholar]
- 36. Reznikoff CA, Brankow DW, Heidelberger C. Establishment and characterization of a cloned line of C3H mouse embryo cells sensitive to postconfluence inhibition of division. Cancer Res . 1973; 33: 3231–8. [PubMed] [Google Scholar]
- 37. Ahrens M, Ankenbauer T, Schroder D, et al . Expression of human bone morphogenetic proteins‐2 or ‐4 in murine mesenchymal progenitor C3H10T1/2 cells induces differentiation into distinct mesenchymal cell lineages. DNA Cell Biol. 1993; 12: 871–80. [DOI] [PubMed] [Google Scholar]
- 38. Atkinson BL, Fantle KS, Benedict JJ, et al . Combination of osteoinductive bone proteins differentiates mesenchymal C3H/10T1/2 cells specifically to the cartil‐ age lineage. J Cell Biochem . 1997; 65: 325–39. [PubMed] [Google Scholar]
- 39. Denker AE, Haas AR, Nicoll SB, et al . Chondrogenic differentiation of murine C3H10T1/2 multipotential mesenchymal cells: I. Stimulation by bone morphogenetic protein‐2 in high‐density micromass cultures. Differentiation. 1999; 64: 67–76. [DOI] [PubMed] [Google Scholar]
- 40. Katagiri T, Yamaguchi A, Komaki M, et al . Bone morphogenetic protein‐2 converts the differentiation pathway of C2C12 myoblasts into the osteoblast lineage. J Cell Biol. 1994; 127: 1755–66. [DOI] [PMC free article] [PubMed] [Google Scholar]
- 41. Katagiri T, Yamaguchi A, Ikeda T, et al . The non‐osteogenic mouse pluripotent cell line, C3H10T1/2, is induced to differentiate into osteoblastic cells by recombinant human bone morphogenetic protein‐2. Biochem Biophys Res Commun. 1990; 172: 295–9. [DOI] [PubMed] [Google Scholar]
- 42. Shea CM, Edgar CM, Einhorn TA, et al . BMP treatment of C3H10T1/2 mesenchymal stem cells induces both chondrogenesis and osteogenesis. J Cell Biochem. 2003; 90: 1112–27. [DOI] [PubMed] [Google Scholar]
- 43. Wang EA, Israel DI, Kelly S, et al . Bone morphogenetic protein‐2 causes commitment and differentiation in C3H10T1/2 and 3T3 cells. Growth Factors. 1993; 9: 57–71. [DOI] [PubMed] [Google Scholar]
- 44. Yeh WC, Cao Z, Classon M, et al . Cascade regulation of terminal adipocyte differentiation by three members of the C/EBP family of leucine zipper proteins. Genes Dev. 1995; 9: 168–81. [DOI] [PubMed] [Google Scholar]
- 45. Umek RM, Friedman AD, McKnight SL. CCAAT‐enhancer binding protein: a component of a differentiation switch. Science. 1991; 251: 288–92. [DOI] [PubMed] [Google Scholar]
- 46. Baksh D, Song L, Tuan RS. Adult mesenchymal stem cells: characterization, differentiation, and application in cell and gene therapy. J Cell Mol Med. 2004; 8: 301–16. [DOI] [PMC free article] [PubMed] [Google Scholar]
- 47. Jager M, Fischer J, Dohrn W, et al . Dexamethasone modulates BMP‐2 effects on mesenchymal stem cells in vitro . J Orthop Res. 2008; 26: 1440–8. [DOI] [PubMed] [Google Scholar]
- 48. Jin ZL, Zhang YK, Sun HY, et al . Osteogenic‐related gene expression profiles of human dental follicle cells induced by dexamethasone. Acta Pharmacol Sin. 2008; 29: 1013–20. [DOI] [PubMed] [Google Scholar]
- 49. Li LC, Dahiya R. MethPrimer: designing primers for methylation PCRs. Bioinformatics. 2002; 18: 1427–31. [DOI] [PubMed] [Google Scholar]
- 50. Bednarik DP, Cook JA, Pitha PM. Inactivation of the HIV LTR by DNA CpG methylation: evidence for a role in latency. EMBO J. 1990; 9: 1157–64. [DOI] [PMC free article] [PubMed] [Google Scholar]
- 51. Boyes J, Bird A. Repression of genes by DNA methylation depends on CpG density and promoter strength: evidence for involvement of a methyl‐CpG binding protein. EMBO J. 1992; 11: 327–33. [DOI] [PMC free article] [PubMed] [Google Scholar]
- 52. Pei L, Tontonoz P. Fat’s loss is bone’s gain. J Clin Invest. 2004; 113: 805–6. [DOI] [PMC free article] [PubMed] [Google Scholar]
- 53. Beresford JN, Bennett JH, Devlin C, et al . Evidence for an inverse relationship between the differentiation of adipocytic and osteogenic cells in rat marrow stromal cell cultures. J Cell Sci. 1992; 102: 341–51. [DOI] [PubMed] [Google Scholar]
- 54. Akune T, Ohba S, Kamekura S, et al . PPARgamma insufficiency enhances osteogenesis through osteoblast formation from bone marrow progenitors. J Clin Invest. 2004; 113: 846–55. [DOI] [PMC free article] [PubMed] [Google Scholar]
- 55. Kawaguchi H, Akune T, Yamaguchi M, et al . Distinct effects of PPARgamma insufficiency on bone marrow cells, osteoblasts, and osteoclastic cells. J Bone Miner Metab. 2005; 23: 275–9. [DOI] [PubMed] [Google Scholar]
- 56. Rhee EJ, Oh KW, Lee WY, et al . The effects of C161–>T polymorphisms in exon 6 of peroxisome proliferator‐activated receptor‐gamma gene on bone mineral metabolism and serum osteoprotegerin levels in healthy middle‐aged women. Am J Obstet Gynecol. 2005; 192: 1087–93. [DOI] [PubMed] [Google Scholar]
- 57. Kawamura C, Kizaki M, Ikeda Y. Bone morphogenetic protein (BMP)‐2 induces apoptosis in human myeloma cells. Leuk Lymphoma. 2002; 43: 635–9. [DOI] [PubMed] [Google Scholar]
- 58. von Bubnoff A, Cho KW. Intracellular BMP signaling regulation in vertebrates: pathway or network Dev Biol. 2001; 239: 1–14. [DOI] [PubMed] [Google Scholar]
- 59. Iwasaki S, Iguchi M, Watanabe K, et al . Specific activation of the p38 mitogen‐activated protein kinase signaling pathway and induction of neurite outgrowth in PC12 cells by bone morphogenetic protein‐2. J Biol Chem. 1999; 274: 26503–10. [DOI] [PubMed] [Google Scholar]
- 60. ten Dijke P, Fu J, Schaap P, et al . Signal transduction of bone morphogenetic proteins in osteoblast differentiation. J Bone Joint Surg Am. 2003; 85‐A: 34–8. [DOI] [PubMed] [Google Scholar]
- 61. Ichida F, Nishimura R, Hata K, et al . Reciprocal roles of MSX2 in regulation of osteoblast and adipocyte differentiation. J Biol Chem. 2004; 279: 34015–22. [DOI] [PubMed] [Google Scholar]
- 62. Zhang W, Yang N, Shi XM. Regulation of mesenchymal stem cell osteogenic differentiation by glucocorticoid‐induced leucine zipper (GILZ). J Biol Chem. 2008; 283: 4723–9. [DOI] [PubMed] [Google Scholar]
- 63. Cao Z, Umek RM, McKnight SL. Regulated expression of three C/EBP isoforms during adipose conversion of 3T3‐L1 cells. Genes Dev. 1991; 5: 1538–52. [DOI] [PubMed] [Google Scholar]
- 64. Thomas D, Kansara M. Epigenetic modifications in osteogenic differentiation and transformation. J Cell Biochem. 2006; 98: 757–69. [DOI] [PubMed] [Google Scholar]
- 65. Takai N, Kawamata N, Walsh CS, et al . Discovery of epigenetically masked tumor suppressor genes in endometrial cancer. Mol Cancer Res. 2005; 3: 261–9. [DOI] [PubMed] [Google Scholar]
- 66. Tada Y, Brena RM, Hackanson B, et al . Epigenetic modulation of tumor suppressor CCAAT/enhancer binding protein alpha activity in lung cancer. J Natl Cancer Inst. 2006; 98: 396–406. [DOI] [PubMed] [Google Scholar]
- 67. Bennett KL, Hackanson B, Smith LT, et al . Tumor suppressor activity of CCAAT/enhancer binding protein alpha is epigenetically down‐regulated in head and neck squamous cell carcinoma. Cancer Res. 2007; 67: 4657–64. [DOI] [PubMed] [Google Scholar]
- 68. Bararia D, Trivedi AK, Zada AA, et al . Proteomic identification of the MYST domain histone acetyltransferase TIP60 (HTATIP) as a co‐activator of the myeloid transcription factor C/EBPalpha. Leukemia. 2008; 22: 800–7. [DOI] [PubMed] [Google Scholar]
- 69. Razin A. CpG methylation, chromatin structure and gene silencing‐a three‐way connection. EMBO J. 1998; 17: 4905–8. [DOI] [PMC free article] [PubMed] [Google Scholar]
- 70. Razin A, Cedar H. Distribution of 5‐methylcytosine in chromatin. Proc Natl Acad Sci USA. 1977; 74: 2725–8. [DOI] [PMC free article] [PubMed] [Google Scholar]
- 71. Keshet I, Lieman‐Hurwitz J, Cedar H. DNA methylation affects the formation of active chromatin. Cell. 1986; 44: 535–43. [DOI] [PubMed] [Google Scholar]
- 72. Buschhausen G, Wittig B, Graessmann M, et al . Chromatin structure is required to block transcription of the methylated herpes simplex virus thymidine kinase gene. Proc Natl Acad Sci USA. 1987; 84: 1177–81. [DOI] [PMC free article] [PubMed] [Google Scholar]
- 73. Zuo Y, Qiang L, Farmer SR. Activation of CCAAT/enhancer‐binding protein (C/EBP) alpha expression by C/EBP beta during adipogenesis requires a peroxisome proliferator‐activated receptor‐gamma‐associated repression of HDAC1 at the C/ebp alpha gene promoter. J Biol Chem. 2006; 281: 7960–7. [DOI] [PubMed] [Google Scholar]