

Abstract
In Alzheimer’s disease (AD), the control of translation is dysregulated, precisely, two opposite pathways: double‐stranded RNA‐dependent protein kinase (PKR) is up‐regulated and mammalian target of rapamycin (mTOR) is down‐regulated. These biochemical alterations were found at the periphery in lymphocytes of AD patients and were significantly correlated with cognitive and memory test scores. However, the molecular crosslink between these two opposite signalling pathways remains unknown. The tumour suppressor p53 and Redd1 (regulated in development and DNA damage response) could be two downstream targets of active PKR to explain the breakdown of translation in AD patients. In this study, the protein and gene levels of p53 and Redd1 were assayed in lymphocytes of AD patients and in age‐matched controls by Western blotting and RT‐PCR. Furthermore, correlations were analysed with both the level of active PKR and the Mini Mental State Examination score (MMSE). The results show that the gene and protein levels of p53 and Redd1 were significantly increased about 1.5‐fold for both gene and Redd1 protein and 2.3‐fold for active p53 in AD lymphocytes compared to age‐matched controls. Furthermore, statistical correlations between proteins and genes suggest that active PKR could phosphorylate p53 which could induce the transcription of Redd1 gene. No correlations were found between MMSE scores and levels of p53 or Redd1, contrary to active PKR levels. PKR represents a cognitive decline biomarker able to dysregulate translation via two consecutive targets p53 and Redd1 in AD lymphocytes.
Keywords: PKR, p53, Redd1, MMSE, Alzheimer's disease, lymphocytes
Introduction
Alzheimer’s disease (AD) is a neurodegenerative disease characterized by a cognitive impairment including memory disturbances followed by aphasia, apraxia, agnosia and executive function disturbances. In addition, major neuropathological lesions are described and include senile plaques, neurofibrillary tangles and regional atrophy caused by neuronal loss. As AD has large social and economic consequences, it is crucial to detect the disease as early as possible in turn to avoid dementia. Many cellular processes such as oxidative stress, glutamate exitotoxicity, inflammation, ubiquitin‐proteasome and ionic currents were explored to explain the neuronal death and to find some molecular targets for diagnosis and/or neuroprotective strategies [1, 2, 3, 4, 5]. In the last 7 years, many works reported a dysregulation of the control of translation, in particular, two pathways which control the initiation: PKR (double‐stranded RNA‐dependent protein kinase) and mTOR (mammalian target of rapamycin). Activated PKR phosphorylates the α subunit of eIF‐2, and inhibits the protein synthesis [6, 7] and are associated with degenerating neurons in AD brains [8, 9, 10]. mTOR signalling is characterized by the phosphorylation of eIF4E binding proteins (4E‐BPs) leading to the release of eIF4E and its participation in the initiation of translation [11, 12]. mTOR phosphorylates also another translation effector protein: p70S6K (p70 ribosomal S6 kinase) [13]. Our pre‐vious results [14, 15, 16, 17] showed that activated PKR and eIF‐2α were significantly increased in lymphocytes of AD patients while mTOR and p70S6K were significantly decreased in comparison with controls. The levels of these kinases were significantly correlated with cognitive and memory test scores performed in AD patients [14, 15, 16, 17]. However, the molecular crosslink between the up‐regulation of PKR and the down‐regulation of mTOR in lymphocytes of AD patients remains unknown. Some molecular factors such as the tumour suppressor p53 and Redd1 (regulated in development and DNA damage response) could be a link between PKR and mTOR pathways. It is known that PKR is physically associated with tumour suppressor p53 and phosphorylates it in vitro and in vivo[18, 19]. In addition, some authors showed that Redd1 is a transcriptional target of p53 [20, 21]. Redd1 (named also RTP801) is a new stress‐induced protein and appears to be a negative regulator of mTOR [22, 23, 24, 25].
The goals of the present work were (1) to analyse and compare the protein and gene levels of p53 and Redd1 in lymphocytes of AD patients and in aged‐matched controls and (2) to study the correlations of these protein and gene levels with both the level of active PKR and the memory test scores (Mini Mental State Examination score [MMSE]) in AD patients.
The results show that the expression of p53 and Redd1 genes, the activation of p53 and the levels of Redd1 protein were significantly higher in lymphocytes of AD patients compared to age‐matched controls. Furthermore, statistical correlations between proteins and genes suggest that active PKR could phosphorylate p53 which could induce the transcription of Redd1 gene. However, p53 and Redd1 at transcriptional and translational levels were not correlated with the MMSE score. PKR is a molecular factor linked to the severity of the disease whereas p53 and Redd1 are two downstream targets of PKR which could explain the mechanism of the dysregulated translational control in AD.
Patients and methods
Chemicals
Sodium dodecyl sulphate, sodium fluoride (NaF), phenylmethylsulfonyl fluoride (PMSF), protease and phosphatase inhibitors, dithiothreitol (DTT) were obtained from Sigma (St Quentin Fallavier, France). All reagent‐grade chemicals for buffers were obtained from VWR International (Strasbourg, France). Primary antibodies and secondary anti‐rabbit IgG antibody conjugated with horseradish peroxydase were purchased from Cell Signaling (Ozyme distributor, St Quentin Yvelines, France), anti‐actin antibody from Sigma, peroxidase‐conjugated anti‐mouse IgG from Amersham Biosciences (Orsay, France). Molecular biology reagents were obtained from Promega (Charbonnières, France).
Selection of patients and cognitive tests
A total of 53 patients (34 F, 19 M) (mean age: 80, range: 66–90 years) suffering from AD were selected from the departments of Geriatrics and Neurology (Poitiers University Hospital) according to the National Institute of Neurological and Communicative Disorders and Stroke and the Alzheimer’s Disease and Related Disorders Association (NINCDS‐ADRDA) clinical criteria as well as 44 control patients (33 F, 11 M) (mean age: 83, range: 63–93 years) without neurological disorders. All patients and controls gave their written informed consent before inclusion in the study. All control individuals had a MMSE above 26 (mean MMSE: 28). AD patients had a MMSE below 25 (mean MMSE: 18). Blood samples (20 ml) were drawn at the same time as MMSE was performed. This study was approved by the regional ethics committee of the Region Poitou‐Charentes (France) (CCPPRB, DGS 2006/0357).
Preparation of lymphocyte cells
Peripheral venous blood was obtained from control patients and AD patients. Blood diluted in phosphate buffer saline (PBS) (1/1, v/v) was deposed on Ficoll‐Histopaque 1077 (2/1, v/v). Mononuclear cells were isolated using Ficoll‐Histopaque 1077 density gradient centrifugation, 1000 ×g for 20 min. at 4°C. The lymphocyte cells were washed three times in PBS and centrifuged 300 ×g for 5 min. Then, cells were counted with Kova’s cells and re‐suspended in 200 μl of lysis buffer (50 mM Tris‐HCl, 50 mM NaCl pH 6.8, 1% [v/v] Triton X‐100, 1 mM PMSF 50 mM, NaF, 1 μl protease inhibitor cocktail for 1 × 10⁶ cells, 1% [v/v] phosphatase inhibitor cocktail). After 10 min. on ice, lysates were sonicated for 10 sec. and centrifuged at 15,000 ×g for 15 min. at 4°C. The supernatant was saved and analysed for protein determination using a protein assay kit (Biorad, Marnes‐la‐Coquette, France). Aliquots of 50 μl were frozen at –80°C until further analysis. In order to report the phosphorylated form to total form of the studied protein performed in two different blots, we prepared an internal control which was a lysate from SH‐SY5Y human neuroblastoma cells cultured in 75‐cm2 flask with minimum essential medium (Gibco‐Invitrogen, Cergy Pontoise, France) mixed with F12 (1:1, v/v, Gibco‐Invitrogen), supplemented with 10% heat‐inactivated foetal bovine serum (Gibco‐Invitrogen) and 1% antibiotics (50 U/ml penicillin + 50 μg/ml streptomycin, Gibco‐Invitrogen). At confluence, cells were lysed in the same experimental conditions for human lymphocytes as indicated above.
Immunoblottings
Proteins were separated on 7% or 12% Tris‐glycine polyacrylamide gels with 3% and 5% stacking gels, respectively, and transferred to polyvinylidene difluoride membranes (Immobilon Millipore, Invitrogen, Fisher distributors, Illkirsh, France). Immunoblots were blocked for 2 hrs in Tris‐buffered saline Tween‐20 (TBST, 20 mM Tris‐HCl, 150 mM NaCl, pH 7.5, 0.05% Tween 20) containing 5% non‐fat milk and 0.21% NaF. The blots were incubated with primary antibody in blocking buffer at 4°C overnight. The primary antibodies used were rabbit anti‐phosphorylated p53 at serine 15 (polyclonal, 1:500 dilution), rabbit anti‐p53 (monoclonal, 1:1000 dilution), rabbit anti‐phosphorylated PKR at threonine 451 (polyclonal, 1:500 dilution), rabbit anti‐PKR (polyclonal, 1:1000 dilution) and goat anti‐Redd1 (polyclonal, 1:500 dilution, Santa Cruz Tebubio distributor, Le Perray‐ en‐Yvelines, France). Membranes were washed twice with TBST and then incubated with the peroxidase‐conjugated secondary antibody anti‐rabbit IgG (1:1000 dilution, Cell Signaling) or peroxidase‐conjugated secondary antibody anti‐goat IgG (1:1000 dilution, Santa Cruz Tebubio distributor) during 1 hr at room temperature (RT). Then, membranes were washed again and developed with the chemiluminescence ECL plus Western blotting system (Amersham Biosciences), followed by signal’s capture by Gbox system (GeneSnap software, Syngene Ozyme Distributors). After two washes in TBST, membranes were probed with monoclonal antibody against actine (1:100,000, Sigma) for 2 hrs at RT. Then, they were washed with TBST, incubated with peroxidase‐conjugated secondary antibody antimouse (1:1000 dilution) for 1 hr, developed and captured. Automatic image analysis software is supplied with Gene Tools (Syngene system). Data of each protein were reported to data of the corresponding actin and to the internal control. Then, the ratio phosphorylated protein/total protein was calculated to determine the activation of the protein.
RT‐PCR semi‐quantitative
Total RNA from lymphocytes were isolated from 1 ml of whole blood without red blood cells by using SV Total RNA isolation System according to the manufacturer’s instructions (Promega, Charbonnieres, France). Total RNA isolate was converted into first strand cDNA using ImProm‐IIw™ Reverse Transcription System. The primers were elaborated by Eurogentec (Seraing, Belgium). Redd1 primers are: forward 5′‐TCACCATGCCTAGCCTTTG‐3′ and reverse 5′‐CCCCCTCAGGTTGAAGTTC‐3′. p53 primers are: forward 5′‐AGCCAAGTCTGTGACTTGCA‐3′ and reverse 5′‐CTATGTCGAAAAAGTGTTTCTGT‐3′. GAPDH (glyceraldehyde‐3‐phosphate dehydrogenase) primers are: forward 5′‐ACCACCATGGAGAAGGCTGG‐3′ and reverse 5′‐CTCAGTGTAGCCCAGGATGC‐3′. The GAPDH gene was used as internal control to normalize for quality differences between samples. Every PCR reaction was performed in a total volume of 25 μl containing 2.5 μl of first strand cDNA, 22.5 μl of PCR mix (Go Taq Flexi DNA polymerase) according to the manufacturer’s instructions. Program used 35 cycles of: denaturation 1 min. at 95°C; hybridation 1 min. at 58°C for Redd1 and GAPDH gene and 60°C for p53 gene; elongation 2 min. at 72°C. The products of RT‐PCR are deposed on 1.5% agarose/ethidium bromide (BET) gel. Then, signals were captured and analysed under UV with geldoc software (Biorad). Data of each gene were reported to data of corresponding GAPDH.
Statistical analysis
All analyses were performed with STATVIEW software (v 5.0, SAS Institute, Berkeley, CA) and graphs were built with GraphPad Prism® software (GraphPad software, v 3.0, San Diego, CA, USA).
Quantitative values are expressed as means and S.E.M. and qualitative data are reported as numbers and corresponding frequencies. Some continuous variables were recoded into categorical variables according to their median value or an appropriate cut‐off.
Comparisons of continuous variables between AD patients and control patients were performed with Student t‐tests (or Mann‐Withney non‐parametric tests if data were not normally distributed).
Correlations between protein levels, gene levels and MMSE scores were estimated by the Spearman’s coefficient correlation (ρ). A P‐value of <0.05 was considered significant.
Results
Expression of p53 gene in lymphocytes of Alzheimer patients
The expression of p53 gene was analysed by RT‐PCR in lymphocytes of 39 control individuals and 46 AD patients (Fig. 1). The scattergram shows that the expression of p53 gene was significantly increased by 56% in lymphocytes of AD patients compared with controls (AD patients: 1.75 ± 0.18, controls: 1.12 ± 0.05; P < 0.05). When categorizing p53 value according to 1.6 value, only 5% of controls (n= 2) but 43% of AD patients (n= 20) had a p53 value >1.6 (P < 0.0001).
Figure 1.
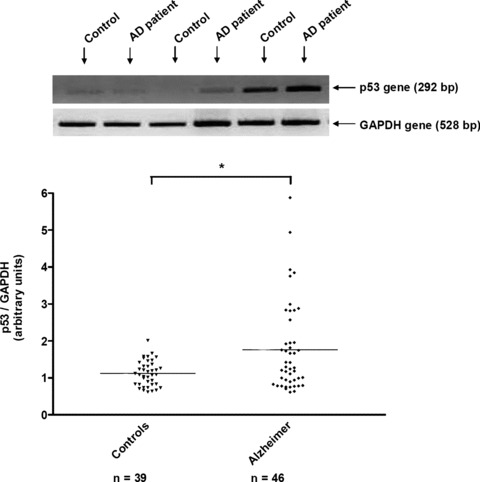
RT‐PCR analysis of p53 gene in lymphocytes of control individuals and Alzheimer patients. Representative agarose gel of p53 gene expression was shown in lymphocytes of four individuals and four Alzheimer, alternatively. The specific bands at 292 pb and 528 pb correspond to p53 and GAPDH genes, respectively. The bands were quantified by using Geldoc software. The results were expressed as arbitrary units and the line represented the mean of 39 controls and 46 Alzheimer patients. *P < 0.05 statistical difference from control individuals (Mann‐Whitney’s test). ▾ Control individuals, ♦ Alzheimer patients.
Activation of p53 in lymphocytes of Alzheimer patients
The expression of phospho‐p53S15 and total p53 were analysed by Western blotting in lymphocytes of 36 control individuals and 48 Alzheimer patients (Fig. 2A and B). Means depicted in Fig. 2C indicate that the p53 activation, measured by the ratio phospho‐ p53S15/p53, was significantly higher (127%) in lymphocytes of AD patients than in control individuals’ lymphocytes (AD patients: 2.23 ± 0.46, controls: 0.98 ± 0.27, P < 0.005). This significant difference was due, both to a higher level of the phosphorylated form of p53 in AD patients (Fig. 2A) but also to a lower level of total p53 in AD patients (Fig. 2B). The scattergram (Fig. 2A) shows that the mean value of phospho‐p53S15 expression was significantly higher (198%) in lymphocytes of AD patients compared with control lymphocytes (AD patients: 1.64 ± 0.39, controls: 0.55 ± 0.12; P < 0.05). In addition, 25% of AD patients (n= 12) and 3% of controls (n= 1) had a value of phospho‐p53S15 above the value of 2.38, (P < 0.005). For p53 total values in Fig. 2B, we noted a lower value in AD compared to controls (AD patients: 0.70 ± 0.10, controls: 1.26 ± 0.27; P < 0.05).
Figure 2.
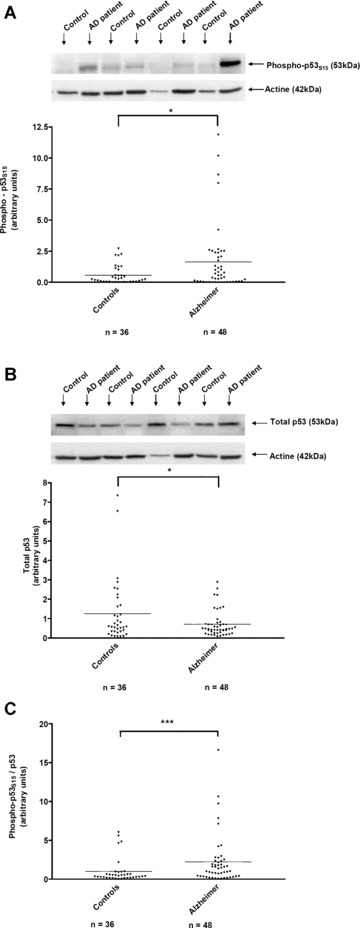
Western blot analysis of p53 activation in lymphocytes of control individuals and Alzheimer patients. Representative immunoblots of phospho‐p53S15 and total p53 expression are shown in lymphocytes of four individuals and four Alzheimer, alternatively (A and B, respectively). The antibodies recognize a specific bands of 53kD for phospho‐p53S15, total p53 and 42 kD for actin. The bands were quantified by using Genetools software and the results were expressed as arbitrary units (scattergram in A and B). p53 activation measured by the ratio phospho‐p53S15/total p53, is summarized as a scattergram (C). Line corresponded to mean of 36 control and 48 Alzheimer patients. *P < 0.05, ***P < 0.005 statistical difference from control individuals (unpaired t‐test for A and B, Mann Whitney’s test for C). ▾ Control individuals, ♦ Alzheimer patients.
Expression of Redd1 gene and Redd1 protein in lymphocytes of Alzheimer patients
The expression of Redd1 gene was analysed by RT‐PCR in lymphocytes of 41 control individuals and 51 AD patients (Fig. 3A). The scattergram shows that the mean value of Redd1 gene expression was significantly higher (47%) in lymphocytes of AD patients compared with controls (AD patients: 1.18 ± 0.11, controls: 0.80 ± 0.06; P < 0.01, Fig. 3A). 63% of AD patients (n= 32) and 34% controls (n= 14) had a Redd1 gene level >0.89 (the median value) (P < 0.01).
Figure 3.
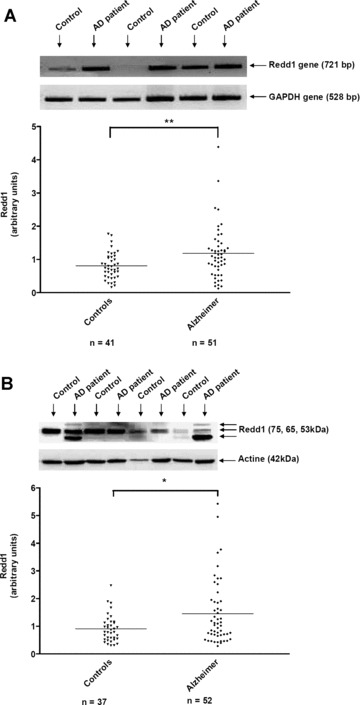
RT‐PCR analysis of Redd1 gene in lymphocytes of control individuals and Alzheimer patients. Representative gel of Redd1 gene expression was shown in lymphocytes of four individuals and four Alzheimer, alternatively (A). The specific bands of 721 pb and 528 pb are Redd1 and GAPDH genes, respectively. The bands were quantified by using Geldoc software and the results were expressed as arbitrary units (A). Line represented the mean of 41 control and 51 Alzheimer patients. **P < 0.01 statistical difference from control individuals (Mann Whitney’s test). (B) Western blot analysis of Redd1 expression in lymphocytes of 37 control individuals and 52 Alzheimer patients. Three isoforms of Redd1 (75, 65 and 53 kD) were detected with the polyclonal goat antibody against Redd1 and actin was shown at 42 kD. The bands were quantified by using Genetools software. Line represented the mean (B). *P < 0.05 statistical difference from control individuals (Mann Whitney’s test). ▾ Control individuals, ♦ Alzheimer patients.
The expression of Redd1 protein was analysed by Western blotting in lymphocytes of 37 control individuals and 52 Alzheimer patients (Fig. 3B). The molecular weight of Redd1 protein is not clearly indicated in the literature and mostly corresponded to a DNA construct. Furthermore, the estimated size of 35 kD according to its mobility in gels was not in accordance with the predicted molecular weight 25 kD (232 amino acids) [21, 25]. In the GeneCards® database, four splice patterns are indicated for Redd1 gene. This protein recently discovered could have some post‐translational modifications unknown at the moment that could influence greatly the molecular weight of Redd1 in various cellular systems. Thus, we determined the size of the three bands of Redd1 detected in human lymphocytes by Western blotting with the specific polyclonal antibody anti‐human Redd1. By using the Gene Tools software (Syngene system) and the precision plus protein standard (Biorad), we found that these three bands run in gel at 75, 65 and 53 kD, respectively. All bands have been analysed and taken into account for the statistical analysis in our study. It was the first time that the Redd1 protein was studied in human samples by Western blotting.
The scattergram (Fig. 3B) shows that the mean value of Redd1 expression was significantly increased by 60% in lymphocytes of Alzheimer patients compared with control lymphocytes (AD patients: 1.46 ± 0.16, controls: 0.91 ± 0.08; P < 0.05). When looking at the frequency distribution of Redd1 protein we showed that this value was greater than 1.3 in 38% of AD patients (n= 20) versus in 16% of control patients (n= 6), (P < 0.05).
Correlation between these molecular factors in lymphocytes of Alzheimer patients
According to the results published by Paccalin et al.[15], phospho‐PKRT451 was significantly higher in AD patients than in controls (n= 49 AD: 5.26 ± 0.73, n= 40 controls: 2.68 ± 0.35, P < 0.01).
Correlation analyses were carried out between protein/protein, protein/gene and gene/gene using a Spearman’s test in the group of AD patients. The values of phospho‐PKRT451 were significantly correlated with phospho‐p53S15 (ρ= 0.33, P < 0.05) in 46 AD patients (Fig. 4A). When categorizing phospho‐PKRT451 value according to 5 value and phospho‐p53S15 to 2.38, we found 44% of AD patients in this range (P < 0.05). Furthermore, there was a significant correlation between phospho‐p53S15 and Redd1 (n= 49 AD patients, ρ= 0.28, P < 0.05), (Fig. 4B). No other significant correlations were found between the values of the other proteins (data not shown).
Figure 4.
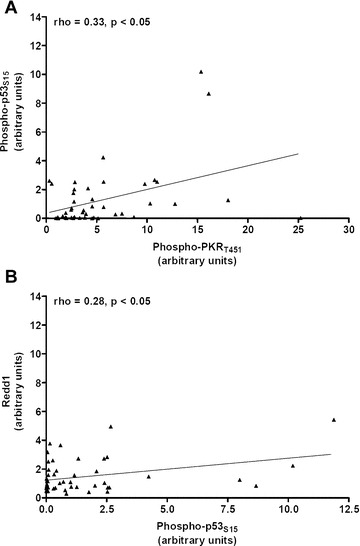
(A) Positive correlation between phospho‐p53S15 and phospho‐PKRT451 levels in the lymphocytes of 46 Alzheimer patients. (B) Positive and significant correlation between phospho‐p53S15 and Redd1 protein in the lymphocytes of 49 Alzheimer patients. Correlations were analysed by using the Spearman’s test. ▴ Alzheimer patients.
The correlations between protein and gene levels were not significant excepted for the ratio phospho‐ p53S15/p53 and p53 gene (ρ= 0.31, P < 0.05 in 43 AD patients, Fig. 5A). Furthermore, data showed a significant correlation between Redd1 and p53 gene values (ρ= 0.53, P < 0.0005, n= 46, Fig. 5B).
Figure 5.
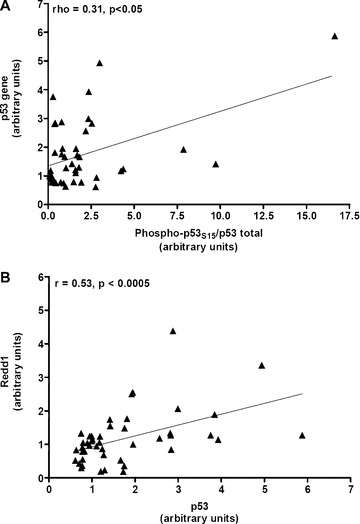
(A) Significant correlation between the ratio phospho‐p53S15/total p53 and p53 gene in the lymphocytes of 43 Alzheimer patients. (B) Significant correlation between genes of p53 and Redd1 in the lymphocytes of 46 Alzheimer patients. Spearman’s test was used for analyse correlations. ▴ Alzheimer patients.
No correlation was observed between p53, Redd1 levels and MMSE test scores, while we showed a negative and significant correlation between P‐PKR values and MMSE scores (ρ=–0.31, P < 0.05, n= 49 AD patients, Fig. 6) as Paccalin et al.[15].
Figure 6.

Negative and significant correlation between the phospho‐PKR3T451 and MMSE test scores in the lymphocytes of 49 Alzheimer patients. Spearman’s test was used for analyse correlations. ▴ Alzheimer patients.
Discussion
AD cannot be diagnosed until dementia appears and the specificity in the discrimination of AD and other dementia with cerebrospinal fluid biomarkers (total‐tau, phospho‐tau and Aβ 1–42) is not absolute. Thus, the identification of early disease‐related biomarkers is crucial to improve diagnostic accuracy and/or to facilitate the development of new drug therapies. Candidate biomarkers should be molecules representing the altered cerebral molecular and cellular processes observed in AD. Furthermore, these biomarkers should be easily accessible. In this regard, many reports underline the great importance of the peripheral cells such as fibroblasts, platelets, mononuclear cells [14, 15, 16, 26, 27, 28, 29, 30]. Furthermore, the increasing understanding of the pathogenesis of this disease originates targets to be used as biomarkers. In the last 4 years, we have shown that the control of translation through PKR/eIF‐2α and mTOR/p70S6K signalling pathways is altered in AD lymphocytes as it was observed in brain of AD patients [9, 10]. In addition, we showed a negative and significant correlation between PKR, eIF‐2α and the severity of the disease and on the opposite a positive correlation for mTOR and p70S6K levels and the memory and cognitive tests scores [14, 15, 16]. The results reported herein, suggest that these two pathways could be linked by the molecular factors p53 and Redd1.
Growing literature data show that p53 may be involved in neurodegenerative processes. Uberti et al.[31] showed that stimulation of ionotropic glutamate receptors in neurons results in a p53‐dependent apoptosis. McGahan et al.[32] reported that proteins, such as c‐Myc and p53 may also contribute to delayed neuronal death following an episode of transient forebrain ischemia. Culmsee et al.[33] studied the neuroprotective properties of a p53 inhibitor (pifithrin‐α) in experimental models of neurodegeneration. They observed that this compound in the presence of DNA‐damaging agents, including β‐amyloid peptide and glutamate, was able to induce neuronal protection, in correlation with a decrease of p53 DNA‐binding activity, a decrease of the expression of p53 target gene BAX and suppressions of mitochondrial dysfunction and caspase activation. In this regard, other authors showed also the protective role of the inhibitor of p53 in various brain injuries and neurodegenerative processes [34, 35, 36, 37], thus suggesting that such local action of p53 might contribute to the dysfunction and degeneration of synapses in various neurodegenerative disorders. Previous post‐mortem studies suggested an involvement of p53 in degenerating neurons in AD with increased amount of p53 in specific populations of cortical neurons and in glial cells [38, 39, 40, 41]. Here, we showed that the levels of p53 gene and p53 activation are significantly increased in lymphocytes of AD patients compared to age‐matched controls. These data demonstrate again lymphocytes as useful peripheral cells to study the dynamic alterations of metabolic and biochemical processes occurring in AD brain. Emerging data in the literature describe a link between the Amyloid Precursor peptide (APP) metabolism and p53 in AD. Authors described that p53 is controlled at transcriptional level by the secretase‐derived intracellular C‐terminal domain fragments and its ability and expression are increased in cells harbouring FAD mutations [42, 43]. Among the APP processing products, another interesting study showed a novel effect of intracellular Aβ 1–42 in AD, able to cause a p53 dependent neuronal apoptosis through binding and activation of the p53 promoter [44]. However, we do not know if p53 phosphorylated at S15 is functional in AD lymphocytes. This post‐translational modification occurs mainly in response to DNA damage and appears to represent a ‘priming event’ for the subsequent series of post‐translational modifications [45]. Lanni et al.[26] recently found that fibroblasts derived from AD patients expressed an altered conformational status of p53 and were less sensitive to p53‐dependent apoptosis compared to fibroblasts from non‐AD patients. Furthermore, authors found that the exposure to nanomolar concentrations of amyloid‐β 1–40 peptide induced the expression of an unfolded p53 protein isoform in fibroblasts derived from non‐AD patients and in HEK cells [46, 47]. This change in the conformational state of p53 was not linked to a mutation of the p53 gene in AD fibroblasts. These authors used blood mononuclear cells from AD patients, as a more accessible cellular model than fibroblats, and showed also that these peripheral cells expressed markedly high levels of conformationally altered p53 positively correlated with age of patients. However, the expression of p53 was independent from the length of illness and from the MMSE values [27]. According to these data, our results of the levels of p53 gene or those of phospho‐p53S15 or p53 activation did not show any correlation with the MMSE scores. However, we showed a significant correlation between phospho‐PKRT451 and phospho‐p53S15, suggesting a role of PKR in this post‐translational modification of p53. Interestingly, Cuddihy et al.[19] have found that PKR was physically associated with p53. Gil and Esteban [48] have reported that expression of different genes, like Fas, Bax and p53, is up‐regulated by PKR in cells infected with recombinant virus. Here, we also found a significant correlation between the activation of p53 and the expression of p53 gene in lymphocytes of AD patients.
It is largely known that p53 senses a variety of cellular stresses such as DNA damage and inappropriate proliferation and leads to cell cycle arrest or apoptosis. In addition, recent works demonstrated that p53 detects also ribogenesis alterations to maintain normal cell homeostasis [49, 50]. However, our data showed that the number of mononuclear cells was significantly higher (43%) in AD patients than in controls (n= 52 AD: 19.33 ± 1.44 × 10⁶ cells/ml, n= 44 controls: 13.57 ± 1.47 × 10⁶ cells/ml, P < 0.005). These results are in accordance with other studies [51, 52]. While the lymphocyte proliferation could be link to various pathological process (inflammation, immune system, infection), one may propose that active PKR associated with a ribogenesis alteration by down‐regulation of mTOR/p70S6K signalling pathway [14, 15] could control the phosphorylation of p53 in AD lymphocytes. However, this conformational state of p53 in lymphocytes of AD patients may suppress its control on cell proliferation. Recently, authors showed that the eIF‐2α kinases such as PKR induce glycogen synthase kinase 3 to promote the nuclear export and proteasomal degradation of p53 [18].
Unlike p53, Redd1 has been discovered more recently. Our data showed a significant increase of the Redd1 gene and the Redd1 protein in lymphocytes of AD patients compared to age‐matched controls. In addition, we have found that there is a significant correlation between amounts of p53 gene and those of Redd1 gene in AD patients. The levels of phosphorylated state of p53 at S15 were also significantly correlated with Redd1 protein levels. Ellisen et al.[21] identified Redd1 as a novel gene expressed broadly in adult cells and transcriptionally regulated by p53. Redd1 appears to function in the regulation of cellular reactive oxygen species, a pathway linked to both stress responses and modulation of growth factor signalling [25]. Several recent reports have identified the stress response gene Redd1 as an essential regulator of mTOR activity in both Drosophila and mammalian cells through TSC1 and TSC2 tumour suppressor complex [22, 24, 53, 54, 55, 56]. Interestingly, it is known that p53 is able to inhibit the activity of mTOR through TSC1/TSC2 complex [57]. Sofer et al.[23] demonstrated that endogenous Redd1 is induced following energy stress and inhibition of endogenous Redd1 by short interfering RNA increases cell size in a rapamycin‐sensitive manner, and Redd1−/− cells are defective in cell growth regulation following ATP depletion. Authors showed that human neuroblastoma CHP134 cells treated with Aβ overexpressed Redd1 and the expression of the antisense Redd1 gene protected the cells from Aβ neurotoxicity [58].
As for the p53 target, no correlation was found between Redd1 gene or Redd1 protein and MMSE test scores. Furthermore, there was no correlation with active PKR. These results complete our hypothesis initiated above: PKR may phosphorylate p53, leading to its transcriptional activity inducing the Redd1 gene expression. These results point out PKR as the best molecular factor correlated with the cognitive decline in AD and p53 and Redd1, two consecutive downstream targets of PKR to explain the dysregulation of the control of translation in AD lymphocytes. p53 could also represent a corrective factor to limit the dysregulation of protein synthesis, in particular ribogenesis. However, the number of lymphocytes is increased compared to age‐matched controls, so the phosphorylation at S15 and subsequent post‐translational modifications could suppress its transcription‐independent activities of cell repair. However, its transcriptional activity by Redd1 gene expression seems not to be altered and Redd1 can exert its functions by down‐regulating the mTOR/p70S6K signalling pathway (Fig. 7).
Figure 7.
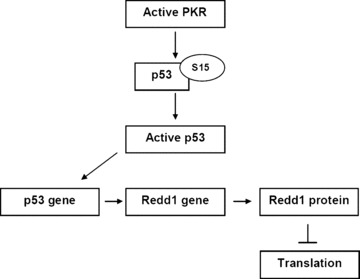
Diagram represents the hypothetic mechanism of the control of PKR in translation via two consecutive molecular targets p53 and Redd1 in lymphocytes of AD patients.
Our results are lent weight to argument that the brain’s pathological events are reflected in the blood excepted for Redd1 not yet studied in post‐mortem brain of AD patients. It is the first time that this new stress‐protein is studied in AD lymphocytes.
Ray et al.[59] have found 18 signalling proteins in blood plasma that can be used to classify blinded samples from Alzheimer’s and control patients with close to 90% accuracy and to identify patients with mild cognitive impairment that progressed to AD 2–6 years later. Biological analysis of the 18 proteins points to systemic dysregulation of haematopoiesis, immune responses, apoptosis and neuronal support in pre‐symptomatic AD [59]. PKR and Redd1 are known to induce apoptosis; however, in these peripheral cells of AD, they reflect the dysregulation of protein synthesis. In addition, our results showed that active PKR represents the initiator of this dysregulation and the only one correlated with the severity of the disease. In brains of APPSL/PS1 (presenilin 1) knock in mice, we showed that PKR was activated at 3 months of age before the significant CA1 neuronal loss (50%) observed at 6 months of age [60]. Thus, it was interesting now to develop molecules able to cross the blood brain barrier in order to target this early active kinase not only for the diagnosis but also for the treatment of the disease which represents a great problem of public health.
Acknowledgements
The authors would like to thank Fanny Abriat for the clinical monitoring and Raymond Pontcharraud for technical help. This study was mainly supported by the grant of Ligue Européenne contre la maladie d’Alzheimer (LECMA) and by the Poitiers University Hospital.
References
- 1. Rojo LE, Fernandez JA, Maccioni AA, et al . Neuroin‐flammation: implications for the pathogenesis and molecular diagnosis of Alzheimer’s disease. Arch Med Res . 2008; 39: 1–16. [DOI] [PubMed] [Google Scholar]
- 2. Shi Q, Gibson GE. Oxidative stress and transcriptional regulation in Alzheimer disease. Alzheimer Dis Assoc Disord . 2007; 21: 276–91. [DOI] [PMC free article] [PubMed] [Google Scholar]
- 3. Pannaccione A, Boscia F, Scorziello A, et al . Up‐regulation and increased activity of KV3.4 channels and their accessory subunit MinK‐related peptide 2 induced by amyloid peptide are involved in apoptotic neuronal death. Mol Pharmacol . 2007; 72: 665–73. [DOI] [PubMed] [Google Scholar]
- 4. Shen Y, He P, Zhong Z, et al . Distinct destructive signal pathways of neuronal death in Alzheimer’s disease. Trends Mol Med . 2006; 12: 574–9. [DOI] [PubMed] [Google Scholar]
- 5. van Leeuwen FW, Hol EM, Fischer DF. Frameshift proteins in Alzheimer’s disease and in other conformational disorders: time for the ubiquitin‐proteasome system. J Alzheimers Dis . 2006; 9: 319–25. [DOI] [PubMed] [Google Scholar]
- 6. Clemens MJ, Elia A. The double‐stranded RNA‐dependent protein kinase PKR: structure and function. J Interferon Cytokine Res . 1997; 17: 503–24. [DOI] [PubMed] [Google Scholar]
- 7. Williams BR. PKR; a sentinel kinase for cellular stress. Oncogene . 1999; 18: 6112–20. [DOI] [PubMed] [Google Scholar]
- 8. Peel AL. PKR activation in neurodegenerative disease. J Neuropathol Exp Neurol . 2004; 63: 97–105. [DOI] [PubMed] [Google Scholar]
- 9. Onuki R, Bando Y, Suyama E, et al . An RNA‐dependent protein kinase is involved in tunicamycin‐induced apoptosis and Alzheimer’s disease. EMBO J . 2004; 23: 959–68. [DOI] [PMC free article] [PubMed] [Google Scholar]
- 10. Chang RC, Wong AK, Ng HK, et al . Phosphorylation of eukaryotic initiation factor‐2alpha (eIF2alpha) is associated with neuronal degeneration in Alzheimer’s disease. Neuroreport . 2002; 13: 2429–32. [DOI] [PubMed] [Google Scholar]
- 11. Clemens MJ. Targets and mechanisms for the regulation of translation in malignant transformation. Oncogene . 2004; 23: 3180–8. [DOI] [PubMed] [Google Scholar]
- 12. Raught B, Gingras AC, Sonenberg N. The target of rapamycin (TOR) proteins. Proc Natl Acad Sci USA . 2001; 98: 7037–44. [DOI] [PMC free article] [PubMed] [Google Scholar]
- 13. Dufner A, Thomas G. Ribosomal S6 kinase signaling and the control of translation. Exp Cell Res . 1999; 253: 100–9. [DOI] [PubMed] [Google Scholar]
- 14. Paccalin M, Pain‐Barc S, Pluchon C, et al . The relation between p70S6k expression in lymphocytes and the decline of cognitive test scores in patients with Alzheimer disease. Arch Intern Med . 2005; 165: 2428–9. [DOI] [PubMed] [Google Scholar]
- 15. Paccalin M, Pain‐Barc S, Pluchon C, et al . Activated mTOR and PKR kinases in lymphocytes correlate with memory and cognitive decline in Alzheimer’s disease. Dement Geriatr Cogn Disord . 2006; 22: 320–6. [DOI] [PubMed] [Google Scholar]
- 16. Paccalin M, Al Khidir F, Barc SP, et al . Peripheral p70S6k levels and emotional memory in patients with Alzheimer’s disease. Neurosci Lett . 2006; 410: 162–4. [DOI] [PubMed] [Google Scholar]
- 17. Lafay‐Chebassier C, Paccalin M, Page G, et al . mTOR/p70S6k signalling alteration by Abeta exposure as well as in APP‐PS1 transgenic models and in patients with Alzheimer’s disease. J Neurochem . 2005; 94: 215–25. [DOI] [PubMed] [Google Scholar]
- 18. Baltzis D, Pluquet O, Papadakis AI, et al . The eIF2alpha kinases PERK and PKR activate glycogen synthase kinase 3 to promote the proteasomal degradation of p53. J Biol Chem . 2007; 282: 31675–87. [DOI] [PubMed] [Google Scholar]
- 19. Cuddihy AR, Wong AH, Tam NW, et al . The double‐stranded RNA activated protein kinase PKR physically associates with the tumor suppressor p53 protein and phosphorylates human p53 on serine 392 in vitro . Oncogene . 1999; 18: 2690–702. [DOI] [PubMed] [Google Scholar]
- 20. Jin HO, An S, Lee HC, et al . Hypoxic condition‐ and high cell density‐induced expression of Redd1 is regulated by activation of hypoxia‐inducible factor‐1alpha and Sp1 through the phosphatidylinositol 3‐kinase/Akt signaling pathway. Cell Signal . 2007; 19: 1393–403. [DOI] [PubMed] [Google Scholar]
- 21. Ellisen LW, Ramsayer KD, Johannessen CM, et al . REDD1, a developmentally regulated transcriptional target of p63 and p53, links p63 to regulation of reactive oxygen species. Mol Cell . 2002; 10: 995–1005. [DOI] [PubMed] [Google Scholar]
- 22. Corradetti MN, Inoki K, Guan KL. The stress‐inducted proteins RTP801 and RTP801L are negative regulators of the mammalian target of rapamycin pathway. J Biol Chem . 2005; 280: 9769–72. [DOI] [PubMed] [Google Scholar]
- 23. Sofer A, Lei K, Johannessen CM, et al . Regulation of mTOR and cell growth in response to energy stress by REDD1. Mol Cell Biol . 2005; 25: 5834–45. [DOI] [PMC free article] [PubMed] [Google Scholar]
- 24. Brugarolas J, Lei K, Hurley RL, et al . Regulation of mTOR function in response to hypoxia by REDD1 and the TSC1/TSC2 tumor suppressor complex. Genes Dev . 2004; 18: 2893–904. [DOI] [PMC free article] [PubMed] [Google Scholar]
- 25. Shoshani T, Faerman A, Mett I, et al . Identification of a novel hypoxia‐inducible factor 1‐responsive gene, RTP801, involved in apoptosis. Mol Cell Biol . 2002; 22: 2283–93. [DOI] [PMC free article] [PubMed] [Google Scholar]
- 26. Lanni C, Uberti D, Racchi M, et al . Unfolded p53: a potential biomarker for Alzheimer’s disease. J Alzheimers Dis . 2007; 12: 93–9. [DOI] [PubMed] [Google Scholar]
- 27. Lanni C, Racchi M, Mazzini G, et al . Conformationally altered p53: a novel Alzheimer’s disease marker Mol Psychiatry . 2007. [DOI] [PubMed] [Google Scholar]
- 28. Tang K, Hynan LS, Baskin F, et al . Platelet amyloid precursor protein processing: a bio‐marker for Alzheimer’s disease. J Neurol Sci . 2006; 240: 53–8. [DOI] [PMC free article] [PubMed] [Google Scholar]
- 29. Eckert A, Schindowski K, Leutner S, et al . Alzheimer’s disease‐like alterations in peripheral cells from presenilin‐1 transgenic mice. Neurobiol Dis . 2001; 8: 331–42. [DOI] [PubMed] [Google Scholar]
- 30. Schindowski K, Kratzsch T, Peters J, et al . Impact of aging: sporadic, and genetic risk factors on vulnerability to apoptosis in Alzheimer’s disease. Neuro-molecular Med . 2003; 4: 161–78. [DOI] [PubMed] [Google Scholar]
- 31. Uberti D, Belloni M, Grilli M, et al . Induction of tumour‐suppressor phosphoprotein p53 in the apoptosis of cultured rat cerebellar neurones triggered by excitatory amino acids. Eur J Neurosci . 1998; 10: 246–54. [DOI] [PubMed] [Google Scholar]
- 32. McGahan L, Hakim AM, Robertson GS. Hippocampal Myc and p53 expression following transient global ischemia. Brain Res Mol Brain Res . 1998; 56: 133–45. [DOI] [PubMed] [Google Scholar]
- 33. Culmsee C, Zhu X, Yu QS, et al . A synthetic inhibitor of p53 protects neurons against death induced by ischemic and excitotoxic insults, and amyloid beta‐peptide. J Neurochem . 2001; 77: 220–8. [DOI] [PubMed] [Google Scholar]
- 34. Gilman CP, Chan SL, Guo Z, et al . p53 is present in synapses where it mediates mitochondrial dysfunction and synaptic degeneration in response to DNA damage, and oxidative and excitotoxic insults. Neuromolecular Med . 2003; 3: 159–72. [DOI] [PubMed] [Google Scholar]
- 35. Biswas SC, Ryu E, Park C, et al . Puma and p53 play required roles in death evoked in a cellular model of Parkinson disease. Neurochem Res . 2005; 30: 839–45. [DOI] [PubMed] [Google Scholar]
- 36. Nair VD. Activation of p53 signaling initiates apoptotic death in a cellular model of Parkinson's disease. Apoptosis . 2006; 11: 955–66. [DOI] [PubMed] [Google Scholar]
- 37. Nair VD, McNaught KS, Gonzalez‐Maeso J, et al . p53 mediates nontranscriptional cell death in dopaminergic cells in response to proteasome inhibition. J Biol Chem . 2006; 281: 39550–60. [DOI] [PubMed] [Google Scholar]
- 38. Sajan FD, Martiniuk F, Marcus DL, et al . Apoptotic gene expression in Alzheimer’s disease hippocampal tissue. Am J Alzheimers Dis Other Demen . 2007; 22: 319–28. [DOI] [PMC free article] [PubMed] [Google Scholar]
- 39. de la Monte SM, Sohn YK, Wands JR. Correlates of p53‐ and Fas (CD95)‐mediated apoptosis in Alzheimer’s disease. J Neurol Sci . 1997; 152: 73–83. [DOI] [PubMed] [Google Scholar]
- 40. Kitamura Y, Shimohama S, Kamoshima W, et al . Changes of p53 in the brains of patients with Alzheimer’s disease. Biochem Biophys Res Commun . 1997; 232: 418–21. [DOI] [PubMed] [Google Scholar]
- 41. Hooper C, Meimaridou E, Tavassoli M, et al . p53 is upregulated in Alzheimer’s disease and induces tau phosphorylation in HEK293a cells. Neurosci Lett . 2007; 418: 34–7. [DOI] [PMC free article] [PubMed] [Google Scholar]
- 42. Checler F, Sunyach C, Pardossi‐Piquard R, et al . The gamma/epsilon‐secretase‐derived APP intracellular domain fragments regulate p53. Curr Alzheimer Res . 2007; 4: 423–6. [DOI] [PubMed] [Google Scholar]
- 43. Alves da Costa C, Sunyach C, Pardossi‐Piquard R, et al . Presenilin‐dependent gamma‐secretase‐mediated control of p53‐associated cell death in Alzheimer’s disease. J Neurosci . 2006; 26: 6377–85. [DOI] [PMC free article] [PubMed] [Google Scholar]
- 44. Ohyagi Y, Asahara H, Chui DH, et al . Intracellular Abeta42 activates p53 promoter: a pathway to neurodegeneration in Alzheimer’s disease. FASEB J . 2005; 19: 255–7. [DOI] [PubMed] [Google Scholar]
- 45. Lavin MF, Gueven N. The complexity of p53 stabilization and activation. Cell Death Differ . 2006; 13: 941–50. [DOI] [PubMed] [Google Scholar]
- 46. Uberti D, Lanni C, Carsana T, et al . Identification of a mutant‐like conformation of p53 in fibroblasts from sporadic Alzheimer’s disease patients. Neurobiol Aging . 2006; 27: 1193–201. [DOI] [PubMed] [Google Scholar]
- 47. Uberti D, Cenini G, Olivari L, et al . Over‐expression of amyloid precursor protein in HEK cells alters p53 conformational state and protects against doxorubicin. J Neurochem . 2007; 103: 322–33. [DOI] [PubMed] [Google Scholar]
- 48. Gil J, Esteban M. Induction of apoptosis by the dsRNA‐dependent protein kinase (PKR): mechanism of action. Apoptosis . 2000; 5: 107–14. [DOI] [PubMed] [Google Scholar]
- 49. Opferman JT, Zambetti GP. Translational research? Ribosome integrity and a new p53 tumor suppressor checkpoint. Cell Death Differ . 2006; 13: 898–901. [DOI] [PubMed] [Google Scholar]
- 50. Horton LE, Bushell M, Barth‐Baus D, et al . p53 activation results in rapid dephosphorylation of the eIF4E‐binding protein 4E‐BP1, inhibition of ribosomal protein S6 kinase and inhibition of translation initiation. Oncogene . 2002; 21: 5325–34. [DOI] [PubMed] [Google Scholar]
- 51. Lombardi VR, Garcia M, Rey L, et al . Characterization of cytokine production, screening of lymphocyte subset patterns and in vitro apoptosis in healthy and Alzheimer’s Disease (AD) individuals. J Neuroimmunol . 1999; 97: 163–71. [DOI] [PubMed] [Google Scholar]
- 52. Shalit F, Sredni B, Brodie C, et al . T lymphocyte subpopulations and activation markers correlate with severity of Alzheimer’s disease. Clin Immunol Immunopathol . 1995; 75: 246–50. [DOI] [PubMed] [Google Scholar]
- 53. Ellisen LW. Growth control under stress: mTOR regulation through the REDD1‐TSC pathway. Cell Cycle . 2005; 4: 1500–2. [DOI] [PubMed] [Google Scholar]
- 54. Jozwiak J, Jozwiak S, Grzela T, et al . Positive and negative regulation of TSC2 activity and its effects on downstream effectors of the mTOR pathway. Neuromolecular Med . 2005; 7: 287–96. [DOI] [PubMed] [Google Scholar]
- 55. Wang H, Kubica N, Ellisen LW, et al . Dexamethasone represses signaling through the mammalian target of rapamycin in muscle cells by enhancing expression of REDD1. J Biol Chem . 2006; 281: 39128–34. [DOI] [PubMed] [Google Scholar]
- 56. Kimball SR, Do AN, Kutzler L, et al . Rapid turnover of the mTOR complex 1 (mTORC1) repressor REDD1 and activation of mTORC1 signaling following inhibition of protein synthesis. J Biol Chem . 2008; 283: 3465–75. [DOI] [PMC free article] [PubMed] [Google Scholar]
- 57. Feng Z, Zhang H, Levine AJ, Jin S. The coordinate regulation of the p53 and mTOR pathways in cells. Proc Natl Acad Sci USA . 2005; 102: 8204–9. [DOI] [PMC free article] [PubMed] [Google Scholar]
- 58. Kim JR, Lee SR, Chung HJ, et al . Identification of amyloid beta‐peptide responsive genes by cDNA microarray technology: involvement of RTP801 in amyloid beta‐peptide toxicity. Exp Mol Med . 2003; 35: 403–11. [DOI] [PubMed] [Google Scholar]
- 59. Ray S, Britschgi M, Herbert C, et al . Classification and prediction of clinical Alzheimer’s diagnosis based on plasma signaling proteins. Nat Med . 2007; 13: 1359–62. [DOI] [PubMed] [Google Scholar]
- 60. Page G, Rioux Bilan A, Ingrand S, et al . Activated double‐stranded RNA‐dependent protein kinase and neuronal death in models of Alzheimer’s disease. Neuroscience . 2006; 139: 1343–54. [DOI] [PubMed] [Google Scholar]