Abstract
Animals choose between sensory stimuli, a highly complex behavior which includes detection, discrimination, preference, and memory processes. Rodents are reported to display robust preferences for some odors, for instance in the context of choosing among possible mates or food items. In contrast to the apparent robustness of responses towards these and other ‘ethologically relevant’ odors, little is known about the robustness of behaviors towards odors which have no overt role in the rodent ecological niche, so-called ‘non-ethologically relevant’ odors. We developed an apparatus for monitoring the nose-poking behavior of mice and used this apparatus to explore the prevalence and stability of choices among different odors both across mice, and within mice over successive days. Mice were tested to either a panel of ethologically relevant or non-ethologically relevant odors in an olfactory multiple choice test. Significant preferences to non-ethologically relevant odors were observed across the population of mice, with longer investigation durations to some odors more than to others. However, we found substantial inter-mouse variability in these responses, and that responses to these odors even varied within mice across days of testing. Tests with ethologically-relevant odors revealed that responses towards these odors were also variable across mice, but within individual mice responses were somewhat stable. This work establishes an olfactory multiple choice test for monitoring odor investigation, choice, and preference behaviors and the application of this apparatus to assess across and within-mouse odor preference choice stability. These results highlight that odor preferences, as assayed by measuring choice behaviors, are variable.
Introduction
Sensory stimuli are well known to elicit strong physiological and behavioral responses. These responses depend on the features of the stimulus itself (e.g., its intensity), the number of stimuli presented, our discrimination capacity among them, and our previous experiences. Indeed, different responses can be observed based upon whether or not the stimulus has been previously associated with a reinforcer, unconditioned, or novel. For instance, pairing a tone with a palatable reinforcer results in the tone gaining a positive valence. In other cases, stimuli may evoke unlearned, sometimes called ‘innate’ responses, such as the disgust elicited by drinking a highly bitter beverage.
Chemical stimuli are particularly capable of eliciting robust behavioral responses. The hedonic quality of an odor, which is highly variant across odors, is a primary feature whereby humans conceptualize olfaction (Yeshurun & Sobel, 2010). Hedonics impact odor-guided behavior of other animals too, including rodents. By measuring the duration of time the animal investigates an odor or is in proximity to an odor, one can operationally define attraction or ‘preference’ for an odor. Mice and other rodents are known to display, on average, preferences to some odors (e.g., (Baum & Keverne, 2002; Devore, Lee, & Linster, 2013; Drickamer, 1989; Isles, Baum, Ma, Keverne, & Allen, 2001; Kermen et al., 2016; Kobayakawa et al., 2007; Lydell & Doty, 1972; Mandairon, Poncelet, Bensafi, & Didier, 2009; Sullivan, 2003; Yuan, Harley, Darby-King, Neve, & McLean, 2003)). In the majority of studies to date, the results used to support odor ‘preferences’ are presented as mean durations of investigation times averaged across animals. One such well known example is the preference of a male mouse for the odor of conspecific female urine (e.g., (Baum & Keverne, 2002)), with male mice investigating conspecific female urine longer than that of males. Another example seen at the population level is avoidance of mice for the odors of predators (Ferrero et al., 2011). Additionally, mice display preferences at the population level to synthetic odors with little to no known ethological value (Mandairon et al., 2009; Kermen et al., 2016). Thus, odor hedonics inform odor driven behaviors in mice. Little literature is available, however, on how diverse these responses are among animals. Do all mice, or even most mice, show strong preferences towards the same odors? Within a mouse, does it stably choose to dominantly investigate the same odor across days? One might assume that genetically inbred lines of mice, all reared in similar contexts, would share preferences towards similar odors. In contrast, even if mice share similar preferences at the population level, it is possible that mice have unique personalities in their display of odor preferences.
In addition to investigating the basis of hedonics, studying the behaviors of animals in the presence of multiple stimuli will provide important clues needed to unravel how the brain informs preferences across different stimuli and thereby guides behavioral choices. As described above, making a choice necessitates identification of a stimulus, discriminating between one stimulus among others, as well as reflections upon whether or not either stimulus has an associated memory. If a mouse is allowed to investigate a panel of odors, one might assume it may choose a given odor, and therefore indicate its preference for that odor. Investigating odor choices of mice among panels of diverse odors would allow insights into the basis of odor choices in mice and how this may reflect preference.
In order to test whether odor preferences are 1) maintained across mice, and 2) stable within mice, in this study we developed an apparatus that allows for an animal to freely investigate, and choose among, up to 5 odors in a given behavioral session. We used this apparatus to monitor investigation behaviors of mice to panels of both non-ethologically relevant odors (those with no clear role in the rodent ecological niche) and ethologically relevant odors in an olfactory multiple choice paradigm. Our results provide a compelling example for olfactory choices and how they contribute to variability of odor preferences, both between and within mice.
Materials and Methods
Experimental Subjects
Thirty-seven adult male C57BL/6 mice (2–4 months of age) obtained from Envigo (Indianapolis, Indiana, U.S.A.) and maintained within the Case Western Reserve University animal facility were used. Mice were group housed in cohorts of 2–5 mice/cage. Mice were allowed food and water ad libitum throughout the study, and housed on a 12 h light/dark cycle with behavior testing occurring during the light phase (11:00–17:00 h). All experiments were conducted in accordance with the guidelines of the National Institutes of Health and were approved by both the University of Florida and Case Western Reserve University Institutional Animal Care and Use Committee.
5-Port Behavioral Apparatus
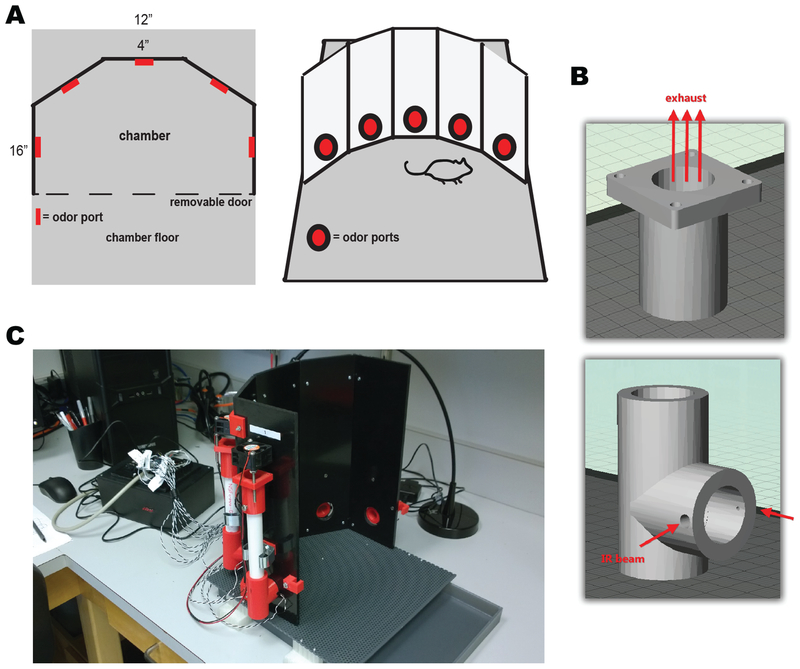
In order to directly monitor nose-poking towards odors, we developed a behavioral apparatus (Fig 1) with 5 odor ports wherein nose-poking into each port is monitored by 880nm infrared photobeams and digitized for later analysis. The apparatus was made of black acrylonitrile butadiene styrene (ABS) plastic, consisting of a 30.5 × 40.6cm (W × L) gray perforated floor (0.3cm perforations, ~0.5cm spaced) and a guillotine style ABS door to allow gentle insertion and removal of the mouse from the testing apparatus. The ceiling was ‘open’ to allow flexibility for those who may wish to monitor animals with video. Five 4 × 30.5cm thick black ABS panels formed the walls of the chamber which each housed a 3D printed odor port (Fig 1B). The odor port was T-shaped with a 2cm opening which faced into the behavioral apparatus to allow nose-entry and monitoring of infrared beam breaks. The two other ends of the T-shaped port were 2.5cm openings designed as the top and bottom of the port. The bottom of each port allowed insertion of a disposable odorless plastic cup (flanged plastic cap, MOCAP, Park Hills, MO) which allowed the user to dispense a small volume or mass of odor, and at the top of the odor port was a ‘silent’ 40mm exhaust fan (Scythe Mini KAZE ULTRA, SY124020L) connected by a manifold and an ~ 20cm long piece of odorless plastic pipe (Fig 1B). Due to the fan, air flows from within the behavioral arena into the port entrance thereby requiring animals to nose poke to obtain odors. The odor port design restricted direct interaction with the odor, and prevented acquisition of visual, somatosensory, or gustatory cues. The result is a semi-circle arena which allows for free choice in investigating one of five odor ports at a time (Fig 1C). The data from the photobeams were acquired using an Arduino Mega microcontroller board (ATmega 2560) running custom code written in the Arduino open source language (Arduino, https://www.arduino.cc). The microcontroller, with a 16Mhz clock speed, was programmed to monitor photobeam interruptions and their timing (with 10ms resolution) and to send that data onto an SD (secure digital) card or via a USB cable onto a computer.
Figure 1. Design of the 5-port behavioral apparatus used to monitor odor investigation behaviors.
(A) Top-down (left) and front view (right) of the 5-port odor investigation apparatus. This apparatus allows a mouse to freely explore and sample among 5 different odors in a single behavioral session which the timing of no-poking behavior to sample the odors is acquired by a microcontroller. See Materials and Methods for a complete description. (B) Renderings of the 3D printed odor exhaust manifold (top) and odor port (bottom). Location of the infrared (IR) photobeams is depicted on the odor port rendering. (C) Picture of the assembled 5-port apparatus which is wire connected to a project enclosure box (towards the left of the apparatus) which houses the Arduino microcontroller allowing for data acquisition onto a removable SD card or onto a computer connected by a USB cable.
Stimuli
Three different sets of odors were used. Two sets consisted of monomolecular odorants obtained in their highest available purity (Sigma Aldrich, St. Louis, MO) diluted to 1Pa vapor pressure in mineral oil. Odor set 1 included guaiacol, l-carvone, thioglycolic acid, heptanal, and 1-decanol. Odor set 2 included (+)-limonene, 2-methylbutyraldehyde, geraniol, isopentyl acetate, and mineral oil as a semi-odorless (Gamble & Smith, 2009) comparison since the odors were diluted in mineral oil. Odorant dilutions were determined using EPI Suite Software (EPIWEB 4.0). Diluted odors were stored at room temperature under nitrogen gas until testing. 20 μL of each odorant was pipetted into a single plastic cup immediately prior to the beginning of testing. The third set of odors consisted of odors with ethological relevance to mice. These included feces collected from a gonadally intact adult male domestic cat, urine collected from adult female mice who were gonadally intact, pieces from a red delicious apple, pieces of unsalted peanut, and honey. With the exception of honey, which was stored at room temperature, all of these stimuli were aliquoted into similar masses (<1g), placed into odorless plastic storage tubes, and stored at −20°C prior to being thawed at least 15 minutes prior to behavioral testing. Urine was collected as previously described (Wesson, Keller, Douhard, Baum, & Bakker, 2006). Urine was pooled across 4–6 gonadally intact female mice per day. Since these female mice were presumably normally cycling, the samples were homogenized across multiple collection days to control for variations in timing of the estrous cycle relative to the collections. 20 μL of urine and each of the 1g samples were placed into separate new plastic cups prior to testing.
Behavioral Testing
Mice were acclimated to the 5 port behavioral apparatus by allowing them 30 minutes of free exploration for 3 consecutive days. Clean plastic cups were present in the odor ports during this acclimation phase. Next, across 5 consecutive days, mice were individually placed in the apparatus with odors available for 30 minutes (either odor set 1, odor set 2, or the ethologically relevant odor set). Mice were tested in pseudo-random order each day. Odorants were arranged in the apparatus such that no odor repeated the same port throughout the testing phase. An approximately two-week duration occurred between the last test day of the first odor set, and the first test day of the second odor set. Prior to testing with the second set of odors, mice were re-acclimated to the apparatus for 30 minutes one day before the first test day. The apparatus was thoroughly cleaned with 70% ethanol at the beginning and end of each testing session. Odorants remained in the testing apparatus until conclusion of testing for the last subject each day. The door of the apparatus was closed during all acclimation and testing sessions.
Data Analysis
Raw data (ms poking/port) was imported into Microsoft Excel and organized by port number, session number, and mouse number. To normalize the data as a means to overcome possible influences of port location (possible spatial bias) and for testing day acclimation/habituation on analyses, we developed what we term an ‘I-value’ metric. I-values were calculated within mice. First, we summed the total amount of time each mouse spent nose-poking into each port. Next, within odors, the amount of time that mouse spent nose-poking for that odor on a given day was divided by the total amount of time spent nose-poking across all odors on a given port and multiplying this by 100. Finally, in order to get a mean ‘I-value’ for a single given odor across all testing days, the previous result was averaged across all five testing days. Statistical measures included ANOVA and repeated measures ANOVA followed with Fisher’s PLSD post-hoc test where indicated.
Results
We began our investigation by monitoring the nose-poking behavior of 4 cohorts of mice (n = 18 total, cohort sizes of 4–5) in response to successive testing days with the panel of non-ethologically relevant odorants. As described in detail in Materials & Methods, each mouse was acclimated to the 5-port apparatus (Fig 1) over 3 days in the absence of any odors prior to being presented with the first panel of odors over 5 successive days (30mins/day). Following, the mice were left untested for two weeks before the acclimation and testing repeated with an independent panel of non-ethologically-relevant odors.
Habituation of nose-poking behaviors and influence of port location on nose-poking
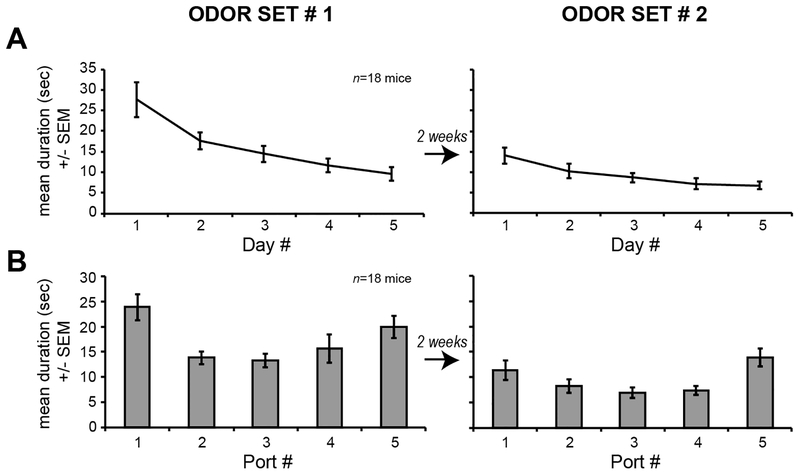
To help optimally assess the later odor-guided behavioral results, we first analyzed the effect of testing day number and port location on the nose-poking behaviors of the mice across all mice tested with non-ethologically relevant odors. Across all ports and mice, the mean duration of nose-poking decreased across repeated testing days, reflecting habituation to the apparatus and/or task (odor set 1, (F(4,68) = 17.881, p < 0.001); odor set 2 (F(3.886,66) = 11.557, p < 0.001)) (Fig 2A). Greater mean duration of nose-pokes occurred on testing day 1 than day 5 for both odor sets (odor set one: Fisher’s PLSD p < 0.001), odor set two: Fisher’s PLSD p < 0.001)). We used the same sessions of data as above to next analyze the impact of port spatial location on the nose-poking behavior of the mice. We found a significant effect of port location on the mean duration of nose-poking (odor set 1: (F(4,85) = 4.45, p = 0.003), odor set 2: (F(4,85) = 4.166, p = 0.004)) (Fig 2B). Pooling data across the odor sets, this effect was due to longer poking into the side ports 1 and 5 than the center ports (Fischer’s PLSD port 1 vs 2 p = 0.002, port 1 vs 3 p < 0.001, port 1 vs 4 p = 0.003, port 5 vs 2 p = 0.005, port 5 vs 3 p = 0.001, port 5 vs 4 p = 0.009) (Fig 2B).
Figure 2. Habituation and port spatial location influence nose-poking behavior in the presence of non-ethologically relevant odors.
(A) Line graph representing the mean duration of time mice spent nose-poking across all ports as a function of testing day. In this experiment, 18 mice in total (in several cohorts) were tested for their investigation towards a panel of 5 non-ethologically relevant odors (odor set 1) and then after 2 weeks of break, a different panel of non-ethologically relevant odors (odor set 2). (B) The same data from the same mice, but plotted as a function of port number, with data averaged across all 5 testing days. Nose-poking was greater in the side ports (1 and 5) for both odor sets reflecting a spatial bias.
Preferences for non-ethologically relevant odors are evident, yet highly variable across and within mice
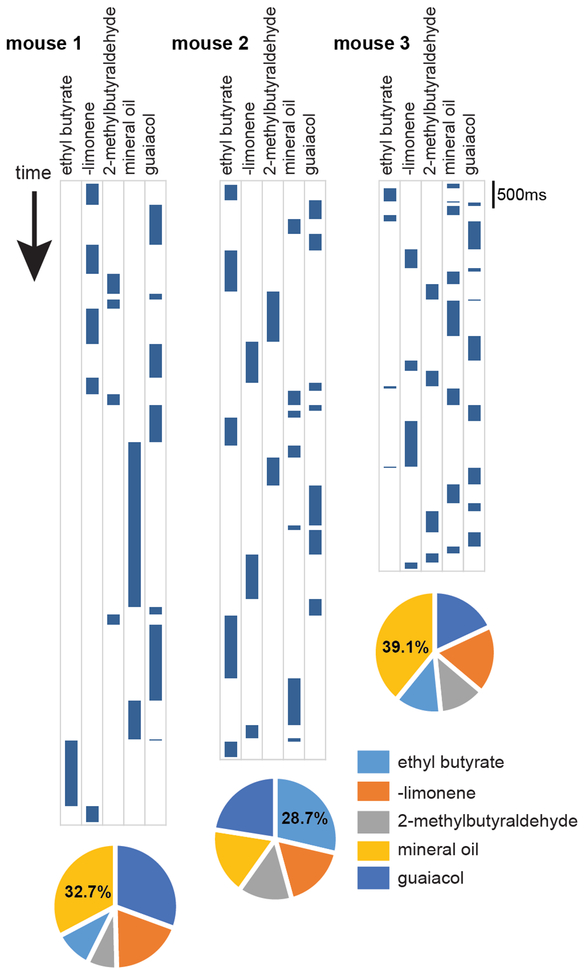
Mice displayed a variety of patterns of investigation behavior while allowed to freely explore the 5 port apparatus. Figure 3 illustrates the nose-poking activity of three mice (which are not included in other analyses) while allowed to investigate one odor set. These plots show that mice have different tendencies to poke in ports, including varieties of transitions from port to port (sometimes entering back into the previous port) and ranges of nose-poke bout durations. Across these three mice, no clear preferred stimulus is apparent.
Figure 3. Example of diversity in odor-directed nose-poking behavior between mice.
Example poking strategies of 3 mice in one behavioral session. In this example, the odors were in the same spatial location for all 3 mice. Only the times the mice nose-poked are plotted as blue bars, with time refraining from poking not indicated. In these examples, one can appreciate the diversity across mice in their tendencies to sample odors. Below are pie charts representing the percentage of total time each mouse spent investigating (nose-poking) each odor. The percentage displayed indicates the maximum percentage of total time investigating a given odor.
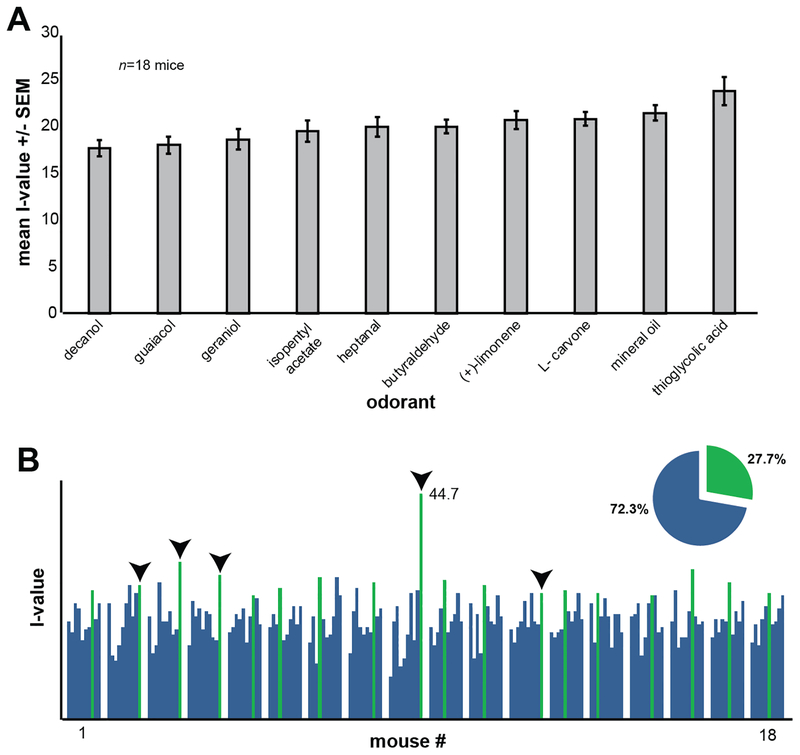
We next sought to assess the possibility for preferences towards non-ethologically relevant odors in the five port apparatus across the entire population of mice. As shown in Figure 2, testing day and port location greatly impact investigation behaviors of mice in the 5 port apparatus. To overcome this, we calculated odor investigation behaviors using an ‘I-value’ metric which defines for each mouse, on each day, odor investigation as the percent of total time nose-poking in one port, independent of day or spatial location (see Materials and Methods). Across all mice and both panels of non-ethologically relevant odors, we found a significant effect of odor type on I-values (F(9,170) = 4.582, p = 0.003) (Fig 4A). Mice investigated thioglycolic acid longer than other stimuli, including guaiacol (p < 0.001), 1-decanol (p < 0.001), and geraniol (p < 0.001) (Fig 4A). Interestingly, a large mean I-value was observed in response to mineral oil which, while not entirely ‘odorless’ (Gamble & Smith, 2009), was selected as a comparison stimulus since the odors were diluted in mineral oil.
Figure 4. Population level ‘preferences’ for non-ethologically relevant odors are not observed at the individual mouse level.
(A) Histogram of mean I-values which control for the influences of port location and testing day habituation (see Materials and Methods) illustrating that as a population, mice display preferences towards some odors more so than others. The mean I-value across all mice and stimuli (including mineral oil) was 20.0 +/− 4.49 s.d. (B) Spark plot of each mouse’s I-value showing that at the individual animal level, animals display their highest I-value (green bars) towards a variety of non-ethologically relevant odors. Downward arrowheads indicate which mice displayed their highest I-value towards thioglycolic acid, which according to the population-level data in (A) is the ‘preferred’ odor. Note that most mice did not contribute their highest I-value towards thioglycolic acid. Pie chart in (B) presents the % of mice which displayed their highest I-value towards thioglycolic acid (green) compared to those which did not (blue). One mouse contributed an I-value of 44.7 to the population-level effect of thioglycolic acid in (A).
It is notable that no single odor very clearly and robustly showed dominance in the mean I-values. We predicted this was due to inter-mouse variability and therefore we asked how robust preferences for thioglycolic acid and the other stimuli were across the mice. To do this, we determined the odor which contributed the greatest I-value for each mouse. As shown in Figure 4B, thioglycolic acid only contributed the highest I-value for 27.7% of mice (4/18). The majority of mice (72.3%, 14/18) displayed their highest I-value for odors other than thioglycolic acid (Fig 4B), with l-carvone, heptanal, and mineral oil being second-most ranked. No mice displayed their highest I-values for decanol or 2-methyl butyraldehyde. Thus, there is great inter-mouse variability in preferences for non-ethologically relevant odors.
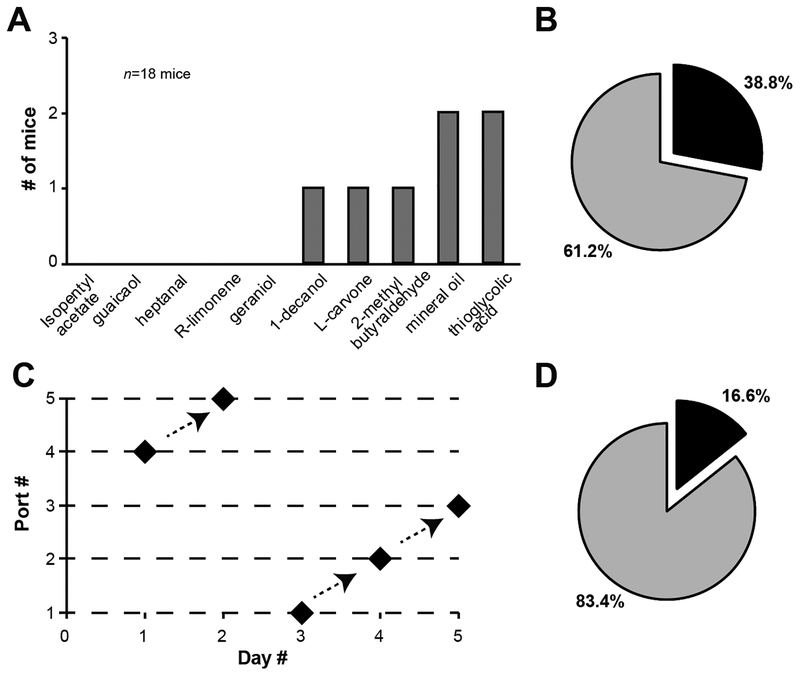
Since our paradigm involves testing each mouse to the same odor panel across 5 days, we next asked within mice, whether their ‘preferred’ odor is stable across days. Since I-value takes into account across-day variations, for this analysis we used the total percentage of time nose-poking towards each odor as a measure of preference. Further, since each mouse was presented with each odor over five sessions, we defined a mouse as ‘preferring’ a single odor if they displayed their greatest investigation time to that odor over three or more days (consecutive or otherwise). We found that only 38.8% (7/18) of mice display stable odor preferences across the five testing days (Figs 5A&B). The majority of mice (61.2%, 11/18) displayed variations on which odor they ‘preferred’ on a day-to-day basis. Among all 18 mice, only one (5.5%) displayed a stable odor-specific preference across all five testing days (Fig 5C), with this mouse following thioglycolic acid across all five days regardless of port location. Of those mice which did display odor-specific preferences, 4 involved at least 2 days wherein the preferred odor was in ports 1 and 5 (those with significant spatial biases [Fig 2B]). After eliminating those mice from the population, only 16.6% would contribute odor-specific preferences across the majority of days (Fig 5D). Thus, investigation times, and thereby choices, for non-ethologically relevant odors are not only variable across mice (Fig 4B), but as shown here, also variable within mice.
Figure 5. The preferred non-ethologically relevant odor varies within most mice on a day-to-day basis.
(A) Histogram illustrating the number of mice which ‘preferred’ the same odor across 3 or more of the 5 testing days (viz., displayed a stable odor-specific preference). No mice displayed stable odor-specific preferences for isopentyl acetate, guaiacol, heptanal, (+)-limonene, or geraniol in this analysis. (B) pie chart displaying the % of all mice which displayed stable odor specific preferences (black = mice with stable preferences, gray = mice which did not). (C) An example of one mouse (the same contributing the high I-value towards thioglycolic acid in Fig 4) who across all 5 testing days spent its greatest percentage of time investigating thioglycolic acid. The data are plotted as a function of port number, to illustrate that the mouse ‘followed’ thioglycolic acid regardless of port location/number. (D) Pie chart displaying the % of all mice which displayed stable odor preferences (same color scale as in (B), but after removing data from mice which may have been influenced by port location (see Results).
Preferences for ethologically-relevant odors are more conserved across, and stable within, mice
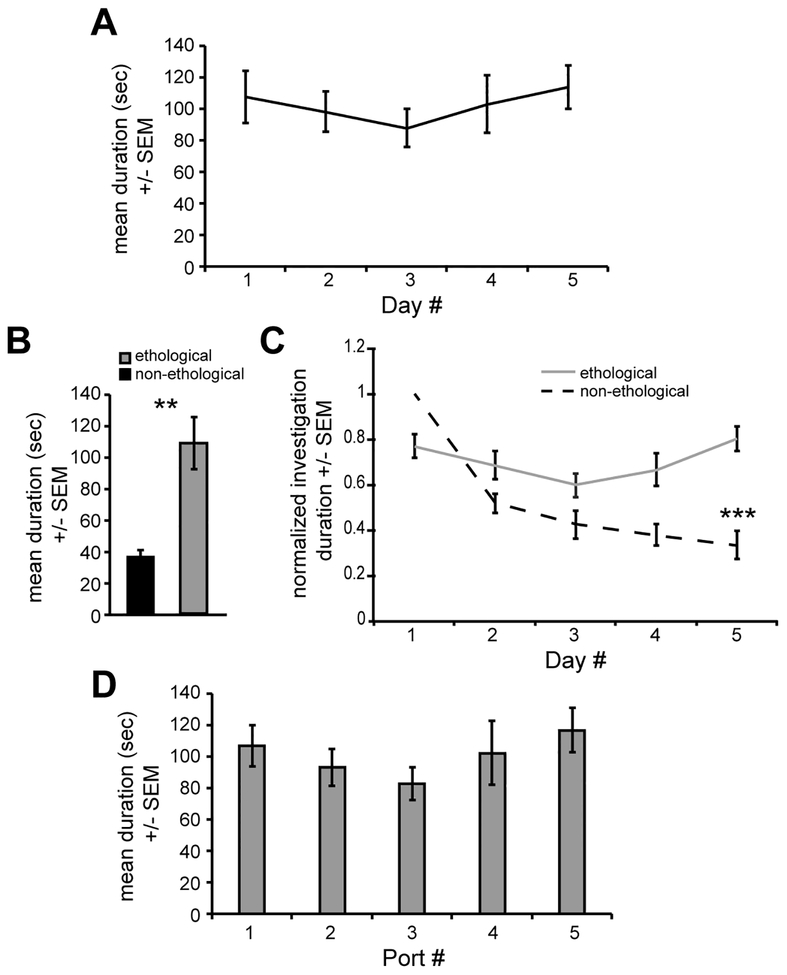
We next sought to test the hypothesis that mice display more robust and less variable preferences to ethologically-relevant odors, versus what we found for non-ethologically relevant odors. Therefore, we used three additional cohorts of mice (n = 16 total, cohort sizes of 4–7). We first began by analyzing task acclimation and port spatial preferences as we did for the previous cohorts of mice (Fig 2). In contrast to what we found in the context of non-ethologically relevant odors, mice did not habituate in their investigation towards ethologically relevant odors. Across all ports and mice, the mean duration of nose-poking was maintained across repeated testing days (F(4,60) = 1.228, p = 0.309) (Fig 6A). While from different cohorts of mice, animals spent greater amounts of time sampling ethologically-relevant versus non-ethologically relevant odors (t(27)=3.85, p = 0.0007) (Fig 6B). Therefore, we normalized the data within animals, among both odor sets, to the maximum duration of sampling on any of the 5 testing days to test for differences in habituation to the odors. This analysis revealed a significant interaction between testing days and the odor set type (F(1,4) = 13.288, p ≤ 0.0001).Specifically, mice persevered in investigating ethologically-relevant odors over successive testing days to similar levels (t(15)=−1.04, p = 0.316; day 1 vs. day 5) and in manners not observed towards the non-ethologically relevant odor set (t(12)=9.66, p ≤ 0.0001; day 1 vs. day 5) (Fig 6C).
Figure 6. Ethologically-relevant odor directed nose-poking behavior is not impacted by habituation or port spatial location.
(A) Line graph representing the mean duration of time mice spent nose-poking across all ports as a function of testing day. In this experiment, several cohorts of mice were tested for their investigation towards a panel of 5 ethologically relevant odors. (B) Mean investigation durations for mice (earlier 4 cohorts of 18 mice) in response to non-ethologically relevant odor set 1 and from the present cohorts of mice in response to the ethologically relevant odor set. **p<0.001. (C) Normalized investigation durations of mice (same as in (B)) revealing an effect of testing day on investigation durations towards non-ethologically relevant, but not ethologically relevant odors. ***p<0.0001. (D) The same data from the same mice as in (A), but plotted as a function of port number, with data averaged across all 5 testing days. There was no effect of port location or testing day on mean duration of investigations.
We used the same sessions of data as above to next analyze the impact of port spatial location on the nose-poking behavior of the mice. Again in contrast to the results acquired in the non-ethologically relevant odor tests, there was no effect of port location on the mean duration of nose-poking of mice towards these ethologically relevant odors (F(4,75) = 0.833, p = 0.509) (Fig 6D). Directly comparing these data with those from the non-ethologically relevant odor sets (Fig 2B), no significant interaction effect is observed between port number and odor set type (F(1,250) = 1.121, p = 0.347). Together, the above data highlight a striking difference in behavioral responses when compared between non-ethologically relevant and ethologically relevant odors.
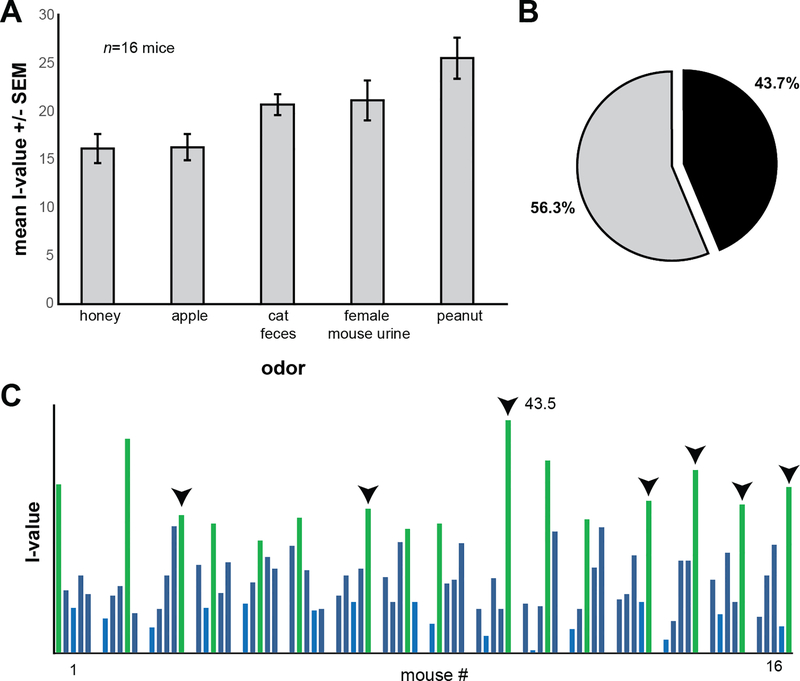
We next analyzed for effects of odor type on the investigation behavior of these mice. We found a significant effect of odor type on I-values (F(4,75) = 5.572, p < 0.001) (Fig 7A). As a population, the highest I-value was displayed towards peanut (Fig 7A). The lowest I-value across mice was observed for honey (Fig 7A). Thus, as with non-ethologically relevant odors, at the population level, mice display odor preferences.
Figure 7. Population level ‘preferences’ for ethologically relevant odors are not observed at the individual mouse level.
(A) Histogram of mean I-values illustrating that as a population, mice display preferences towards some ethologically-relevant odors more so than others. The mean I-value across all mice and stimuli was 20.0 +/− 7.40 s.d.. Pie chart in (B) presents the % of mice which displayed their highest I-value towards peanut (black) compared to those which did not (gray). (C) Spark plot of each mouse’s I-value showing that at the individual animal level, animals display their highest I-value (green bars) towards a variety of non-ethologically relevant odors. Downward arrowheads indicate which mice displayed their highest I-value towards peanut, which according to the population-level data in (A) is the ‘preferred’ odor. Note that most mice did not contribute their highest I-value towards peanut.
We next asked how robust preferences for peanut odor and the other odors were across mice. To do this, we determined the odor which contributed the greatest I-value for each mouse. 43.7% of mice (7/16) displayed their greatest I-value to peanut (Figs 7B). No mice displayed their highest I value to honey (Fig 7C). Thus, as with non-ethologically relevant odors, there is inter-mouse variability on preferences for ethologically relevant odors (Fig 7C).
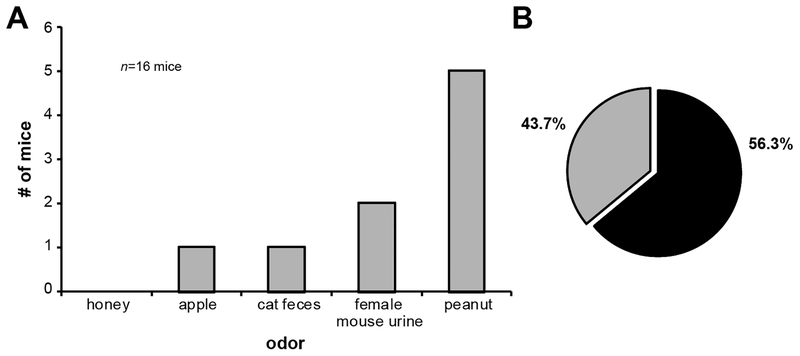
We next asked, within mice, whether preference for their ‘preferred’ ethologically-relevant odor is stable across days. As with the non-ethologically relevant odors, for this analysis we used the total percentage of time nose-poking in each session as a measure of preference. Again, we defined a mouse as ‘preferring’ a single odor if they displayed their greatest investigation percentage to that odor over three or more days (Fig 8A). The majority of mice (9/16, 56.3%) displayed an odor-specific preference (Fig 8B). Of those mice which did display odor-specific preferences, these were mostly displayed towards peanut odor (Fig 8A). In fact, among all 16 mice, 5 (31.3%) displayed a stable odor-specific preference across all five testing days to peanut odor. Thus, while variability exists, mice display somewhat stable preferences to these ethologically-relevant odors.
Figure 8. Most mice display stable preferences for ethologically relevant odors from day-to-day.
(A) Histogram illustrating the number of mice which ‘preferred’ the same odor across 3 or more of the 5 testing days (viz., displayed a stable odor-specific preference). No mice displayed stable odor-specific preferences for honey in this analysis. (B) Pie chart displaying the % of all mice which displayed stable odor specific preferences (black = mice with stable preferences, gray = mice which did not).
Discussion
In this study we used a novel behavioral apparatus to investigate the behaviors of mice to panels of both non-ethologically relevant odors (those with no clear role in the rodent ecological niche) and ethologically relevant odors. We found that 1) at the population level mice do display odor preferences in the multiple choice task, 2) that these preferences are variable at the individual mouse level, and 3) these preferences are modulated by experience. It is important to note our finding that, on average, mice display ‘preferences’ towards some odors more than others is consistent with previous reports (Baum & Keverne, 2002; Devore et al., 2013; Drickamer, 1989; Isles et al., 2001; Kermen et al., 2016; Kobayakawa et al., 2007; Lydell & Doty, 1972; Mandairon et al., 2009; Yuan et al., 2003). This, in part, validates the 5-port apparatus for monitoring odor preferences. The main novelty of this work rests in highlighting that these preferences are not observed when inspecting individual mice within the population, nor within individual mice across days. This finding may in part be explained by the unique paradigm we designed, wherein mice must choose between multiple stimuli in the multiple choice task design, and also our measures of preferences across multiple days of experience with the odors.
Implications for understanding odor hedonics
Many studies have provided insights into odor preferences in rodents; however, most do not present data in a manner allowing for assessing individual-animal differences (e.g., (DiBenedictis, Olugbemi, Baum, & Cherry, 2015; Kermen et al., 2016; Kobayakawa et al., 2007; Mandairon et al., 2009; Qiu et al., 2014). At least one previous study documented variability in odor preferences (Tabuchi, Ono, Uwano, Takashima, & Kawasaki, 1991). In that study, rats had to bar press to gain access to one of several food odors (cheese, black pepper odor, milk, and peppermint). The authors reported that all rats, with some variation, displayed preferences to the food odors and that these were influenced by hunger. In our study, we used multi-day testing without experimentally-induced changes in hunger, to reveal that mice spontaneously change their preferences towards odors, and in fact only in rare cases do they maintain preferences towards the same odor across multiple testing days. It will be important in future studies to determine if this across-day change in odor choices reflects that the mouse remembered the previous odor more and thus was seeking novel stimuli, or, perhaps that the odors selected among were not readily discriminated between and therefore the mouse generalized between the two.
Given that the non-ethologically relevant odors used in our task were not paired to predict rewarding or aversive outcomes, we assume all of these odors to have a neutral valence. This assumption is further supported by the low likelihood that the mice ever experienced these odors during rearing in the laboratory environment. Additionally, all of the odors were diluted to 1Pa, rendering them as ligands for the main olfactory epithelium, yet likely eliminating the trigeminal stimulation yielded by odors at high intensities. A neutral valence might translate behaviorally, as we observed herein, to a high degree of inter- and intra-animal variability in odor choices.
Our results suggest that ethologically-relevant odors are more robust at eliciting stable odor preferences. While still not all mice displayed preferences towards the same ethologically-relevant odors, many mice displayed consistent preferences across repeated testing days. One limitation in this study, and in our ability to directly compare the results from the ethologically-relevant and non-ethologically relevant odors, is that we used differed cohorts of mice to test preferences towards these odor categories. That said, since we used several cohorts of mice in testing towards both types of odor sets, the comparisons between odor sets is fair. Further, while we found no mice to display odor specific preferences to odors including geraniol, limonene, heptanal, and more, it is very likely that with the considerable inter-mouse variability we report here, some mice will display strong preferences towards these odors. Additional studies will be needed to assess the basis of this difference between the two categories of odors (ethologically relevant vs non-relevant odors). For instance, it is possible that the non-ethologically relevant odors are more perceptually similar compared to the ethologically relevant odors and therefore, there may be a role for olfactory generalization in the mice choosing between one non-ethologically relevant odor and another.
Contributions of the 5-port apparatus
Various measures are used to assess preferences to odors. These can include the physical location of the animal’s body in relation to the odor and the time the animal spends investigating the odor (often defined as ‘snout-oriented investigation’). While it is possible that an animal being in physical proximity to an odor coincides with it sampling an odor, the measures using the physical location of the body in relation to the odor are problematic, since this certainly does not coincide with preference. For example, just because a mouse remains in a select zone of an apparatus, does not mean it is doing so in response to the hedonics of the stimulus present in that zone.
We developed the 5-port nose-poke behavioral apparatus in an effort to quantify, specifically, nose-directed investigation behaviors of mice to odors. By requiring the mice to poke their noses in the port to acquire the odor, we were allowed a direct read-out of investigation which adds precision beyond manual or video-based measures of monitoring investigation behaviors, and especially those based upon whole-body proximity. Importantly, a critical caveat to consider in comparing these results to those of previous studies, is that the different context which this behavioral apparatus provides likely alters preference behavior in a substantial manner from studies using other testing apparatuses (e.g., (Devore et al., 2013; Mandairon et al., 2009; Tabuchi et al., 1991)), or those using home cage testing (Baum & Keverne, 2002). The 5-port apparatus introduces a novel context in which the mice must be acclimated, and additionally, introduces the experimental variable of choice which impacts these results. That stated, we propose that additional studies using this 5-port apparatus, and the olfactory multiple choice test, will yield additional important insights into the basis of hedonics in mice and how they are shaped with experience.
Possible mechanisms underlying variable odor hedonics
What underlies these individual differences? Is it possible these results, especially those found in response to non-ethologically relevant odors, are due to individual-animal differences in odor discrimination capacity? Indeed, while the odor preference task used here did not test specifically for odor discrimination, one possible explanation for the variability in preference to the odors is that it is an effect of olfactory generalization. Olfactory generalization can be defined as the degree to which any two odorants are perceptually confused with one another (Mandairon et al., 2010) and a recent study using a go/no-go operant task linked olfactory generalization to the structural similarity of odorants (Yoder, Setlow, Bizon, & Smith, 2014). Whether the levels of individual differences we observed in odor choices may be reflected by differences in odor tuning functions by olfactory system neurons, and therefore discrimination capacity, are both unknown. That said, this would not explain the day-to-day variations uncovered in preferences. While it is likely animals are seeking novelty from day-to-day, as rodents are well-known to do (e.g., (Kabbaj, Devine, Savage, & Akil, 2000)), an alternative possibility for this would be an interplay between the investigation duration on one day followed by memory for that odor (and even the spatial location of that odor) on a subsequent day. Additional studies utilizing long intervals between subsequent testing days (>2 weeks) will be informative in understanding the basis in variations in odor preference within mice.
Conclusion
Our finding on the diversity and variability of odor preferences in mice may be surprising to some, especially considering the common-place manner of presenting odor preference data from mice averaged as a group. However, just as humans display diverse and personal preferences towards odors, we should not be surprised to observe these same behaviors in rodents.
Acknowledgements:
This work was supported by NIH/NIDCD grants R01DC014443 and R01DC016519 to D.W. and CNRS and Lyon 1 University funding to N.M. S.L. and K.P. were supported by SOURCE fellowships at Case Western Reserve University.
References
- Baum MJ, & Keverne EB (2002). Sex difference in attraction thresholds for volatile odors from male and estrous female mouse urine. Hormones and Behavior, 41(2), 213–219. [DOI] [PubMed] [Google Scholar]
- Devore S, Lee J, & Linster C (2013). Odor preferences shape discrimination learning in rats. Behavioral Neuroscience, 127(4), 498–504. 10.1037/a0033329 [DOI] [PMC free article] [PubMed] [Google Scholar]
- DiBenedictis BT, Olugbemi AO, Baum MJ, & Cherry JA (2015). DREADD-Induced Silencing of the Medial Olfactory Tubercle Disrupts the Preference of Female Mice for Opposite-Sex Chemosignals. Eneuro, 2(5). Retrieved from http://eneuro.org/content/2/5/ENEURO.0078-15.2015.abstract [DOI] [PMC free article] [PubMed] [Google Scholar]
- Drickamer LC (1989). Odor preferences of wild stock female house mice (Mus domesticus) tested at three ages using urine and other cues from conspecific males and females. Journal of Chemical Ecology, 15(7), 1971–1987. 10.1007/bf01207431 [DOI] [PubMed] [Google Scholar]
- Ferrero DM, Lemon JK, Fluegge D, Pashkovski SL, Korzan WJ, Datta SR, … Liberles SD (2011). Detection and avoidance of a carnivore odor by prey. Proceedings of the National Academy of Sciences, 108(27), 11235–11240. 10.1073/pnas.1103317108 [DOI] [PMC free article] [PubMed] [Google Scholar]
- Gamble KR, & Smith DW (2009). Discrimination of “Odorless” Mineral Oils Alone and as Diluents by Behaviorally Trained Mice. Chemical Senses, 34(7), 559–563. 10.1093/chemse/bjp036 [DOI] [PubMed] [Google Scholar]
- Isles AR, Baum MJ, Ma D, Keverne EB, & Allen ND (2001). Urinary odour preferences in mice. Nature, 409, 783–784. [DOI] [PubMed] [Google Scholar]
- Kabbaj M, Devine DP, Savage VR, & Akil H (2000). Neurobiological Correlates of Individual Differences in Novelty-Seeking Behavior in the Rat: Differential Expression of Stress-Related Molecules. The Journal of Neuroscience, 20(18), 6983 LP-6988. Retrieved from http://www.jneurosci.org/content/20/18/6983.abstract [DOI] [PMC free article] [PubMed] [Google Scholar]
- Kermen F, Midroit M, Kuczewski N, Forest J, Thevenet M, Sacquet J, … Mandairon N (2016). Topographical representation of odor hedonics in the olfactory bulb. Nat Neurosci, 19(7), 876–878. Retrieved from 10.1038/nn.4317 [DOI] [PubMed] [Google Scholar]
- Kobayakawa K, Kobayakawa R, Matsumoto H, Oka Y, Imai T, Ikawa M, … Sakano H (2007). Innate versus learned odour processing in the mouse olfactory bulb. Nature, 450(7169), 503–508. Retrieved from http://www.ncbi.nlm.nih.gov/entrez/query.fcgi?cmd=Retrieve&db=PubMed&dopt=Citation&list_uids=17989651 [DOI] [PubMed] [Google Scholar]
- Lydell K, & Doty RL (1972). Male rat of odor preferences for female urine as a function of sexual experience, urine age, and urine source. Hormones and Behavior, 3(3), 205–212. [DOI] [PubMed] [Google Scholar]
- Mandairon N, Peace ST, Boudadi K, Boxhorn CE, Narla VA, Suffis SD, & Cleland TA (2010). Compensatory responses to age-related decline in odor quality acuity: Cholinergic neuromodulation and olfactory enrichment. Neurobiology of Aging, In Press,. Retrieved from http://www.sciencedirect.com/science/article/B6T09-4Y5H5X6-2/2/b92590ddab8253723f6fa3f7a561b372 [DOI] [PMC free article] [PubMed] [Google Scholar]
- Mandairon N, Poncelet J, Bensafi M, & Didier A (2009). Humans and Mice Express Similar Olfactory Preferences. PLoS ONE, 4(1), e4209 10.1371/journal.pone.0004209 [DOI] [PMC free article] [PubMed] [Google Scholar]
- Qiu Q, Scott A, Scheerer H, Sapkota N, Lee DK, Ma L, & Yu CR (2014). Automated Analyses of Innate Olfactory Behaviors in Rodents. PLoS ONE, 9(4), e93468 10.1371/journal.pone.0093468 [DOI] [PMC free article] [PubMed] [Google Scholar]
- Sullivan RM (2003). Developing a sense of safety: the neurobiology of neonatal attachment. Ann N Y Acad Sci, 1008, 122–131. [DOI] [PMC free article] [PubMed] [Google Scholar]
- Tabuchi E, Ono T, Uwano T, Takashima Y, & Kawasaki M (1991). Rat preference for food-related odors. Brain Research Bulletin, 27(3–4), 387–391. 10.1016/0361-9230(91)90130-C [DOI] [PubMed] [Google Scholar]
- Wesson DW, Keller M, Douhard Q, Baum MJ, & Bakker J (2006). Enhanced urinary odor discrimination in female aromatase knockout (ArKO) mice. Horm Behav, 49(5), 580–586. Retrieved from http://www.ncbi.nlm.nih.gov/entrez/query.fcgi?cmd=Retrieve&db=PubMed&dopt=Citation&list_uids=16448653 [DOI] [PMC free article] [PubMed] [Google Scholar]
- Yeshurun Y, & Sobel N (2010). An Odor is Not Worth a Thousand Words: From Multidimensional Odors to Unidimensional Odor Object. Ann Rev Neurosci, 61, 219–241. [DOI] [PubMed] [Google Scholar]
- Yoder WM, Setlow B, Bizon JL, & Smith DW (2014). Characterizing olfactory perceptual similarity using carbon chain discrimination in Fischer 344 rats. Chemical Senses, 39(4), 323–331. JOUR. [DOI] [PMC free article] [PubMed] [Google Scholar]
- Yuan Q, Harley CW, Darby-King A, Neve RL, & McLean JH (2003). Early odor preference learning in the rat: bidirectional effects of cAMP response element-binding protein (CREB) and mutant CREB support a causal role for phosphorylated CREB. J Neurosci, 23(11), 4760–4765. Retrieved from http://www.ncbi.nlm.nih.gov/entrez/query.fcgi?cmd=Retrieve&db=PubMed&dopt=Citation&list_uids=12805315 [DOI] [PMC free article] [PubMed] [Google Scholar]


