

Abstract
Small cell lung cancer (SCLC) is a recalcitrant, aggressive neuroendocrine-type cancer for which little change to first-line, standard of care treatment has occurred within the last few decades. Unlike nonsmall cell lung cancer (NSCLC), SCLC harbors few actionable mutations for therapeutic intervention. Lysine-specific demethylase 1A (LSD1, also known as KDM1A) inhibitors were previously shown to have selective activity in SCLC models, but the underlying mechanism was elusive. Here, we found that exposure to the selective LSD1 inhibitor ORY-1001 activated the NOTCH pathway, resulting in the suppression of the transcription factor ASCL1 and the repression of SCLC tumorigenesis. Our analyses revealed that LSD1 bound to the NOTCH1 locus, thereby suppressing NOTCH1 expression and downstream signaling. Reactivation of NOTCH signaling with the LSD1 inhibitor reduced the expression of ASCL1 and neuroendocrine cell-lineage genes. Knockdown studies confirmed the pharmacological inhibitor-based results. In vivo, sensitivity to LSD1 inhibition in SCLC patient–derived xenograft (PDX) models correlated with the extent of consequential NOTCH pathway activation and repression of a neuroendocrine phenotype. Complete and durable tumor regression occurred with ORY-1001–induced NOTCH activation in a chemoresistant PDX model. Our findings reveal how LSD1 inhibitors function in this tumor and support their potential as a new and targeted therapy for SCLC.
Introduction
Small cell lung cancer (SCLC) is a high-grade neuroendocrine carcinoma characterized by initial chemosensitivity followed by the rapid emergence of chemoresistance (1). There has been limited improvement in first-line SCLC treatment in the past 30 years and no targeted therapies are currently available. The high death rate and lack of treatment options have led the National Cancer Institute to designate SCLC as a “Recalcitrant Cancer” to underscore the need for new therapeutic frameworks. SCLC does not harbor frequent mutations in “druggable” oncogenic drivers or tumor suppressors (2–4). Instead, this neuroendocrine tumor type co-opts the same transcriptional programs necessary for normal lung neuroendocrine cell development to sustain tumor cell growth. Achaete-scute homolog 1 (ASCL1) is a transcription factor that promotes neuroendocrine transcriptional programs (5, 6) and deletion of Ascl1 strongly suppresses tumorigenesis in a genetically engineered mouse model of SCLC (5). During lung development, NOTCH signaling negatively regulates ASCL1 (6) and activation of NOTCH family members also potently suppresses SCLC in mouse models (2). Knowledge of these genetic dependencies have not clinically impacted the progression of SCLC, given the challenges of activating NOTCH or suppressing ASCL1 using conventional pharmacological approaches. SCLC exhibits frequent mutations in chromatin regulating genes (2–4) leading to proposals to target the altered epigenetic landscapes of SCLC for therapeutic vulnerabilities. Lysine-specific histone demethylase 1A (LSD1, also known as KDM1A), is a flavin adenine dinucleotide (FAD)-dependent demethylase that is highly expressed in SCLC (7) and demethylates the monomethylated and dimethylated forms of histone H3 at lysine 4 (H3K4me1 and H3K4me2) (8). The demethylation of H3K4me1 has been linked to the decommissioning of transcriptional enhancers in embryonic stem cells (9). LSD1 is a component of multiple large repressive complexes, including CoREST [cofactor of RE1-silencing transcription factor (REST)] and NuRD (nucleosome remodeling and histone deacetylase), coordinating histone acetylation and methylation to control target gene transcription (10, 11). In preclinical studies, LSD1 inhibition exhibits selective activity in acute myeloid leukemia (AML) and SCLC models, which led to the subsequent clinical evaluation of LSD1 inhibitors in these respective indications (7, 12, 13). However, the mechanism of action underlying LSD1 inhibitor efficacy in SCLC remained elusive. In this study, we evaluated the mechanism of action of LSD1 inhibitor ORY-1001 (also known as ladademstat, formerly RG6016), a novel, highly potent, orally available and irreversible LSD1 inhibitor that exhibits strong selectivity for LSD1 over LSD2 and monoamine oxidase enzymes (12). Our findings revealed that LSD1 inhibition modulates the NOTCH-ASCL1 axis to suppress SCLC tumorigenesis.
Results
ORY-1001 is antiproliferative in a subset of SCLC cell lines
Screening of ORY-1001 across a broad panel of 275 cell lines representing 14 tumor histologies, resulted in anti-proliferative activity in a subset of SCLC and AML cell lines (Fig. 1A). This finding is similar to the reported effects of LSD1 inhibitor GSK2879552 (7). The activity of ORY-1001 was assessed in a larger panel of SCLC cell lines. ORY-1001 induced growth inhibition in a subset of SCLC cell lines, corresponding to anti-proliferative EC50s within the sub-nanomolar to nanomolar range (table S1). Four responsive SCLC cell lines, NCI-H510A, NCI-H1417, NCI-H146, and NCI-H187 were treated with ORY-1001 and RNAseq analyses were performed. ORY-1001 treatment resulted in 1400 differentially expressed genes (FDR<0.05) (table S2). Pathway analyses using Enrichr (14) revealed enrichment in NOTCH pathway genes, and in gene sets related to neuronal differentiation and signaling post ORY-1001 treatment (Fig. 1B). The expression of multiple NOTCH family member genes and NOTCH-target genes were upregulated upon ORY-1001 treatment while that of ASCL1, a target that is negatively regulated by NOTCH, decreased (Fig. 1C). Thus, LSD1 inhibition modulated the expression of key neuroendocrine genes, specifically a decrease in ASCL1 and an increase in the expression of NOTCH family members and downstream targets (Fig. 1C).
Fig. 1. ORY-1001 exhibits anti-proliferative activity in a subset of SCLC cell lines.
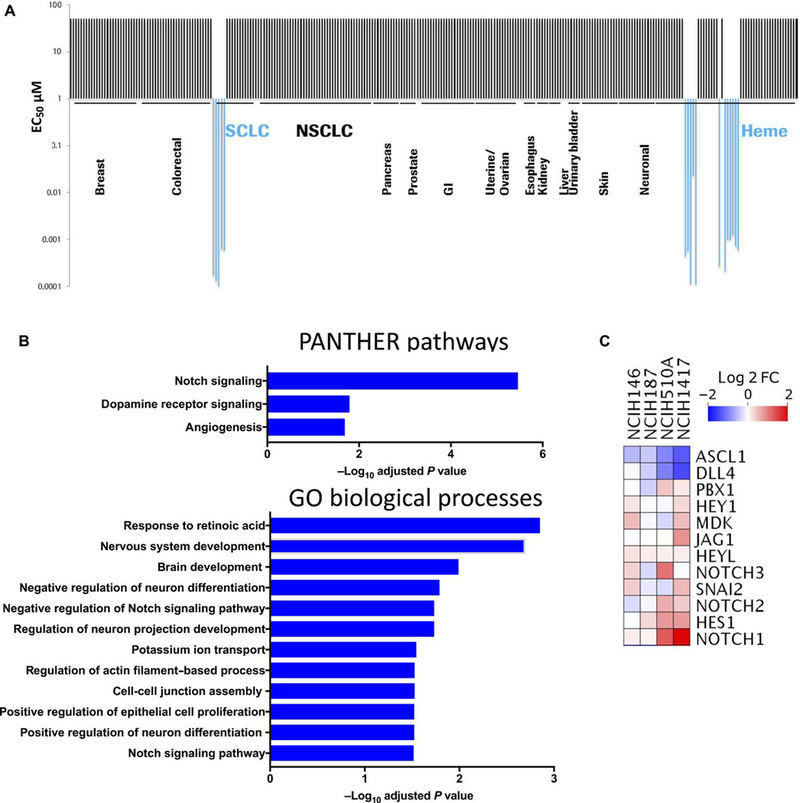
(A) Anti-proliferative activity of ORY-1001 (in concentrations of up to 10μM) was screened across a panel of 275 cell lines in a 4-day cell viability assay (CellTiter-Glo). Half-maximal effective concentration (EC50) values in responsive cell lines ranged from 0.1–23nM. (B) RNA-Seq analyses performed using DeSeq2(47) in SCLC cell lines (NCI-H146, NCI-H187, NCI-H510A, and NCI-H1417) treated with 10nM ORY-1001 for 96 hours. 1400 differentially expressed genes (table S2) with FDR<0.05 were used for enrichment analysis with the online tool Enrichr (14), assigned according to the PANTHER and Gene Ontology Biological Processes databases. For the PANTHER pathways listed, all significant pathways with FDR<0.05 are shown. For GO Biological Processes, a subset of significant processes with FDR<0.05 are shown, including Notch signaling (GO:0007219). (C) Heat map showing differentially expressed genes in Notch pathway (GO:0007219), showing log2 fold change in ORY-1001–treated relative to vehicle-treated cells.
ORY-1001 upregulates NOTCH and REST while suppressing ASCL1
As long-term culture and passage of cell lines can lead to irreversible changes(15), the selective responses to ORY-1001 were further explored in clinically relevant PDX SCLC models cultured transiently ex vivo. PDX explants, previously passaged only as xenografts in mice, were briefly plated in tissue culture and exposed to ORY-1001 ex vivo. The collection of PDX models used for ex vivo studies included three novel models; FHSC04 and FHSC14 were generated from SCLC patient circulating tumor cell (CTC) populations, and MSK-LX227C was generated from transbronchial needle biopsy. Images from our CTC-derived PDX model is shown as fig. S1. The remaining PDX models used have been previously described (15–18), and the properties of all the PDX models are shown in table S3. These SCLC PDX cell models survived and proliferated ex vivo. Cultured FHSC04 cells were found to be markedly sensitive to ORY-1001 treatment with an IC50 of 13nM (Fig. 2A). For all other PDX cells examined ex vivo, the IC50 for ORY-1001 was above 1μM (Fig. 2A). FHSC04 grows as a mixed population of cell clusters and adherent neuroendocrine cells; morphological changes consistent with cell death occurred at 96 hours after treatment of the suspension cell population with 1nM ORY-1001 (Fig. 2B, bottom). These observations were consistent with increased detection of cleaved caspase 3 and cleaved PARP at this time point (Fig. 2B, top). In contrast, models with lower sensitivity to ORY-1001 (JHU-LX48 and JHU-LX108) retained viable cell clusters at 96-hours of treatment with no evidence of apoptosis based on cell morphology and Western blot analysis of cleaved Caspase 3 and PARP (Fig. 2, C and D).
Fig. 2. LSD1 inhibition with ORY-1001 results in the activation of NOTCH signaling.
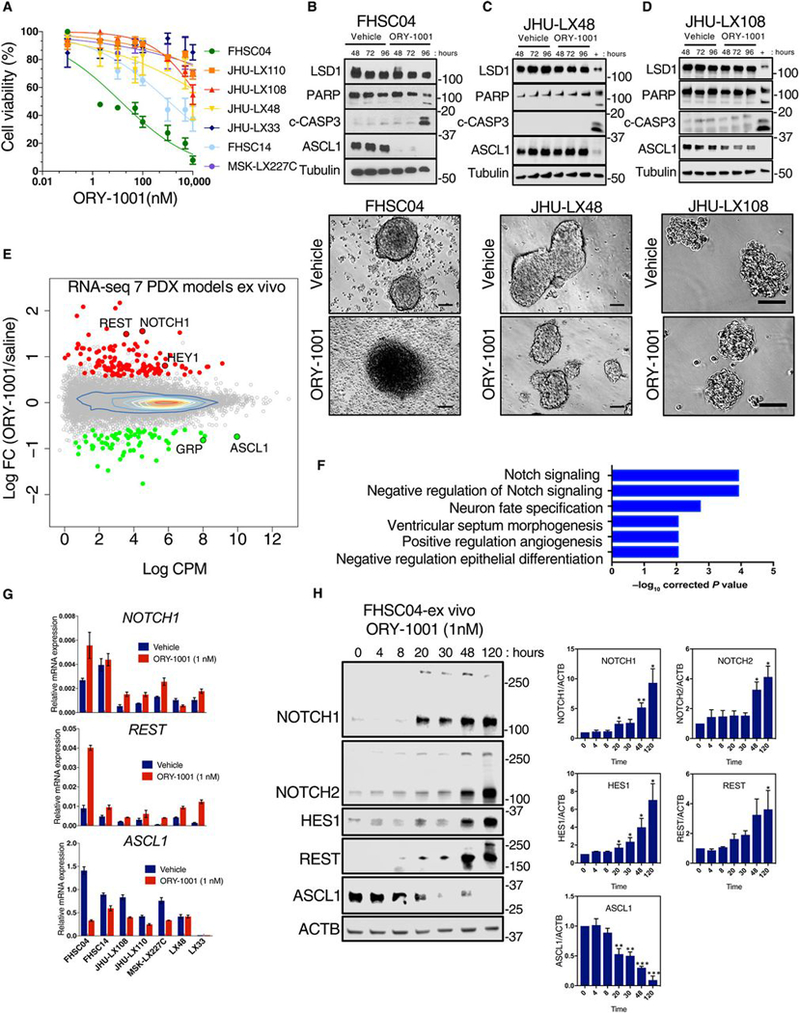
(A) Dose response curves of 7 PDX model-derived cells cultured and treated ex vivo with ORY-1001 over 120 hours. Viability was assessed with the CellTiter-Glo assay and calculated relative to the vehicle control. Data are mean ± S.E.M. from at least n=3 biological replicates. (B) Immunoblots (above) and photomicrographs (below) for FHSC04 cells treated ex vivo with ORY-1001. Protein abundance was assessed at 48, 72 and 96 hours of 1nM ORY-1001 treatment and photomicrographs taken at 96 hours. Blots are representative of two independent experiments. c-CASP3, cleaved caspase 3. Scale bar, 100μM. (C and D) As described in (B) for JHU-LX48 (C) and JHU-LX108 (D) cells. As a positive control for cleaved caspase 3 and PARP, lysates from FHSC04 cells treated 96 hours with 1nM ORY-1001 (also represented in B) was run on the same blot (“+” lane). Blots are representative of two independent experiments. (E) RNA-Seq MA plot showing differentially expressed genes across the 7 PDX models treated ex vivo with 1nM ORY-1001. Red, upregulated genes; green, downregulated genes; each with log2 fold change >0.585 and FDR <0.05 as identified using edgeR. (F) Gene Ontology (GO) analysis using GOseq (19) showing the top 6 significant GO terms in the genes differentially expressed with FDR <0.05 (see Methods; table S4 for full list). (G) Abundance of NOTCH1, REST and ASCL1 transcripts in the PDX models ex vivo assessed using real time PCR, with expression plotted relative to that of GAPDH (n=3 independent experiments). (H) Immunoblot showing kinetics of changes in NOTCH1, NOTCH2, REST and ASCL1 protein abundance in the drug-sensitive FHSC04 model treated ex vivo with1 nM ORY-1001 over 120 hours. Data are mean ± SD from three independent experiments. * P<0.05, ** P<0.01, and *** P<0.005 by a two-tailed unpaired Student’s t-test.
To identify LSD1-regulated signaling pathways that may contribute to observed responses, we analyzed transcriptional changes in the panel of PDX models treated with 1nM ORY-1001 ex vivo. Cells were treated for 48 hours, a time point that precedes cell death in treated FHSC04 cells (Fig. 2B). EdgeR analyses revealed 518 differentially expressed genes upon ORY-1001 treatment: 289 upregulated and 229 downregulated (FDR < 0.05) (Fig. 2E and table S4). Consistent with the cell line models, gene ontology analyses using GOseq (19) revealed strong enrichment in NOTCH signaling pathways (e.g. NOTCH1, NOTCH2, HES1, HEY1, DLL1, DLL3, DLL4) and neuron fate specification (e.g. ASCL1, POU4F1, EYA1, NKX2–2) (Fig. 2F and table S5). Similar directional changes in NOTCH1, HES1, REST and ASCL1 occurred in almost all of the models, although the magnitude of these changes was greatest in FHSC04, as shown by both real-time PCR analyses (Fig. 2G) and FPKM values from the RNA-Seq analyses (fig. S2). NOTCH1 has been previously shown to suppress ASCL1 (20, 21), a master regulator of neuroendocrine cell fate recently found to be essential for SCLC cell survival/viability (5). It has also been shown that REST, a repressor of neural gene expression, is a direct target of NOTCH1 and REST upregulation contributes to NOTCH-mediated ASCL1 suppression in SCLC (21). Following LSD1 inhibition with ORY-1001, we observed an increase in REST transcripts most prominently in the FHSC04 model (Fig. 2G). We next examined the kinetics of changes in ASCL1 and negative regulators of ASCL1, using Western blot analysis in the sensitive FHSC04 model. A sharp drop in ASCL1 protein abundance occurred with an increase in active NOTCH1 intracellular domain (N1ICD) and REST protein abundance by 20 hours of ORY-1001 treatment (Fig. 2H). Increases in the NOTCH2 intracellular domain (N2ICD) were delayed relative to N1ICD, being observed after 48 hours of ORY-1001 treatment (Fig. 2H). Further evidence of NOTCH pathway activation upon LSD1 inhibition included the induction of NOTCH1 target gene HES1 (Fig. 2H).
LSD1 inhibition results in altered H3K27Ac at key target genes
As transcriptional data revealed NOTCH pathway activation in sensitive SCLC models, we followed with ChIP-Seq analyses to evaluate the mechanism of NOTCH pathway deregulation in response to LSD1. We employed antibodies to LSD1 and to key histone modification marks in SCLC cell lines, following 96-hour treatment with 1nM ORY-1001 or vehicle control. We focused on the ORY-1001 responsive cell line NCI-H510A and the less sensitive NCI-H526 cell line. LSD1 demethylates H3K4 and changes in H3K4 dimethylation (H3K4me2) can be found in putative LSD1 target genes in some cell types following LSD1 knockdown or inhibition (22–24). However, in the SCLC cells examined, ChIP-Seq analysis revealed that increased mRNA expression of NOTCH1 with ORY-1001 treatment in NCI-H510A cells was not associated with changes in locus-specific H3K4me2 deposition (Fig. 3A). Notably, LSD1 is a component of the CoREST complex that also includes histone deacetylases (HDAC1,2) (25). This led to an evaluation of histone acetylation marks in response to LSD1 inhibition. We detected an increased abundance of histone H3K27 acetylation (H3K27Ac) along the NOTCH1 locus in NCI-H510A cells (Fig. 3A), the peak of which overlapped with a peak in LSD1 binding, suggesting that LSD1 may regulate H3K27Ac at this site (Fig. 3A). We also found increased NOTCH1 locus H3K27Ac upon ORY-1001 treatment in cells from the highly sensitive FHSC04 PDX model treated ex vivo with 1nM ORY-1001 for 48 hours (Fig. 3B), which correlated with the changes seen in NOTCH1 abundance at both the mRNA and protein levels. Of note, the less sensitive line NCI-H526 did not display any H3K27Ac changes at the NOTCH1 locus in response to ORY-1001 treatment (Fig. 3A), and the lack of H3K27Ac changes was consistent with a failure to activate NOTCH1 in this line (fig. S3). REST expression also increased in our PDX ex vivo studies upon ORY-1001 treatment (Fig. 2, E, G, and H). ChIP-Seq analyses revealed a substantial LSD1 peak around the REST transcriptional start site, which was associated with the H3K27Ac peak in the NCI-H510A SCLC cell line (fig. S4). These findings were confirmed by ChIP-PCR in SCLC cell lines and in the FHSC04 model ex vivo (Fig. 3, C and D). Thus, LSD1 inhibition with ORY-1001 leads to upregulation of NOTCH1 and REST expression, which correlates with increased H3K27Ac at sites of prominent LSD1 binding in SCLC cells.
Fig. 3. Differential histone acetylation of LSD1-regulated genes.
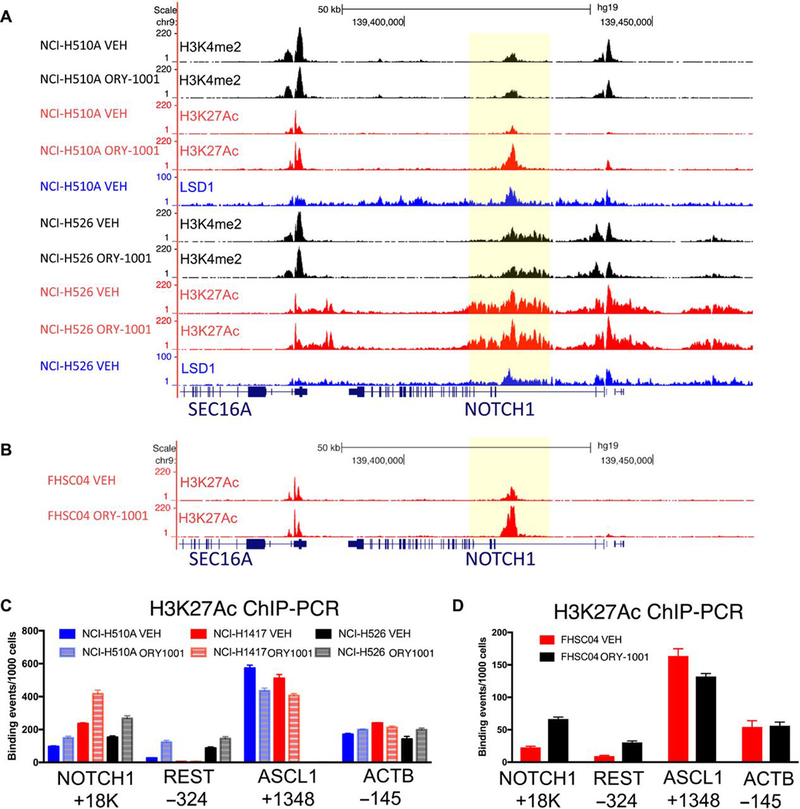
(A) Read-density tracks, visualized using UCSC genome browser, of normalized ChIP-Seq for H3K4me2 (black), H3K27Ac (red) and LSD1 (blue) in NCI-H510A and NCI-H526 cell lines. Cells were treated with vehicle (VEH) or 1nM ORY-1001 for 96 hours. Shaded area highlights region in NOTCH1 with LSD1 binding and increased H3K27Ac upon ORY-1001 treatment in the NCI-H510A cell line. (B) Read-density tracks of normalized ChIP-Seq for H3K27Ac in cells derived from FHSC04 PDXs, a markedly ORY-1001–responsive model. Cells were treated ex vivo with vehicle (VEH) or 1nM ORY-1001 for 48 hours. Shaded area highlights region in NOTCH1 with increased H3K27Ac. (C and D) ChIP-PCR validation of H3K27Ac changes in NOTCH1, REST, ASCL1 and as a control, ACTB in vehicle in SCLC cell lines treated for 96 hours (C) or FHSC04 cells treated for 48 hours (D) with vehicle or 1nM ORY-1001 for 96 hours. Data are mean ± SD from n=3 experiments.
The LSD1-NOTCH-ASCL1 axis is important for SCLC cell viability
To investigate the relationship between LSD1, NOTCH and ASCL1 in SCLC cells, we utilized genetic perturbation studies. Lentiviral shRNA-mediated knockdown of LSD1 in neuroendocrine SCLC cell line NCI-H510A resulted in increased abundance of NOTCH1 and decreased abundance of ASCL1 (Fig. 4A). Knockdown of LSD1 also led to reduced cell viability, as assessed by the CellTiter-Glo assay (Fig. 4B). The functional importance of decreased ASCL1 abundance was evaluated by shRNA-mediated knockdown. Two independent ASCL1-targeting shRNAs reduced protein abundance and led to a decrease in viability in NCI-H510A cells (Fig. 4, C and D; left panels). The FHSC04 PDX model is also amenable to lentiviral vector infection when grown ex vivo; in this model, genetic knockdown of either LSD1 or ASCL1 also resulted in decreased cell viability (Fig. 4, A to D; right panels). The role of NOTCH1 activation in SCLC cell survival was assessed in the FHSC04 model using an inducible system to overexpress N1ICD (Fig. 4E). Doxycycline-induced expression of N1ICD led to substantial suppression of ASCL1 and decreased cell viability, denoted by an increase in cleaved caspase 3 (Fig. 4E) and a significant decrease in cell proliferation (Fig. 4F). Thus, genetic perturbation of LSD1, NOTCH1, and ASCL1 supports the relevance of an LSD1-NOTCH-ASCL1 axis as a functional regulator of tumorigenesis in SCLC.
Fig. 4. Genetic perturbation of LSD1, ASCL1 and NOTCH1 in SCLC cells.
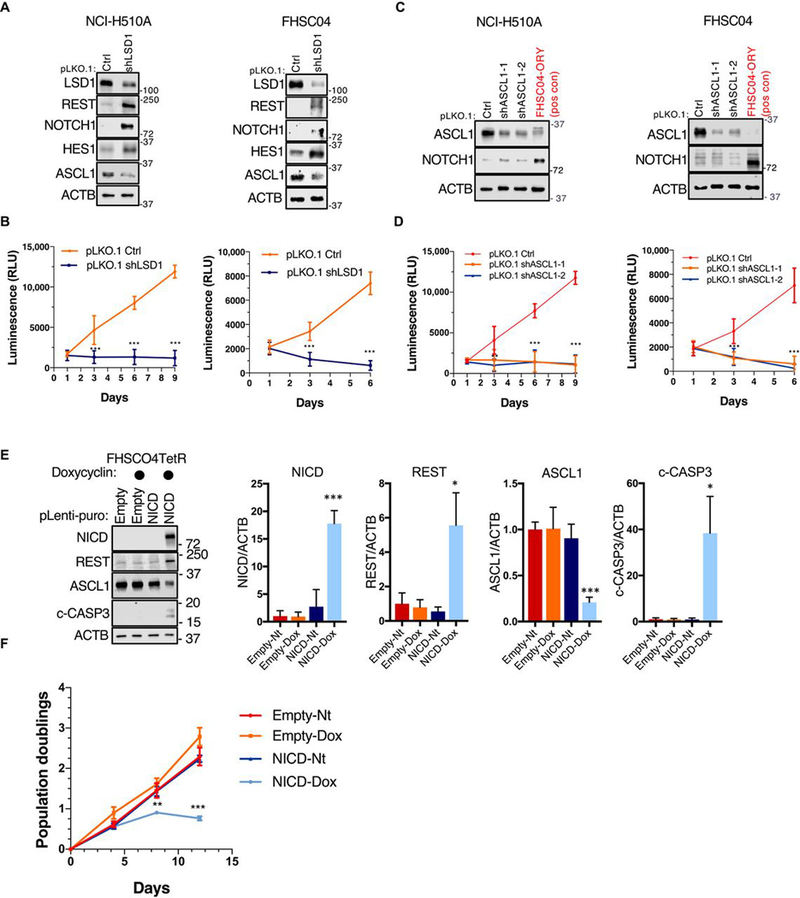
(A) Immunoblot analysis of the indicated proteins in response to lentiviral LSD1 knockdown in NCI-H510A SCLC cell line and FHSC04 PDX model ex vivo. ACTB is used as a loading control. Blots are representative of two independent experiments. (B) Proliferation analysis using CellTiter-Glo in response to LSD1 knockdown, analyzed as summarized below. (C) Immunoblot analysis of the indicated proteins in response to ASCL1 knockdown in NCI-H510A SCLC cell line and FHSC04 PDX model ex vivo. An ORY-1001 treated FHSC04 protein extract is used as a positive control for NOTCH1 and REST. Blots are representative of two independent experiments. (D) Proliferation analysis in response to ASCL1 knockdown, as in (B). (E) Immunoblot analysis of the indicated proteins in FHSC04TetR cells in response to an inducible expression of N1ICD (1μg/μl doxycycline for 96 hours). (F) Growth curve analysis of FHSC04TetR in response to N1ICD expression. All data are mean ± SD from n=3 experiments. *P<0.05, **P<0.01, and ***P<0.005 by a two-tailed unpaired Student’s t-test.
Pharmacological inhibition of NOTCH signaling partially prevents ORY-1001–mediated SCLC growth suppression
To determine whether activation of NOTCH signaling is important for anti-tumorigenic effects of ORY-1001, we took advantage of well characterized γ-secretase inhibitors (GSIs). GSIs target NOTCH1–4 receptor activation resulting in the pan NOTCH signaling inhibition (26). We tested the effect of two GSIs, DBZ (27) and RO4929097 (28), each in combination with ORY-1001. For these experiments, we chose two SCLC cell lines and two ex vivo PDX models that displayed activation of NOTCH signaling in response to ORY-1001. Treatment with either DBZ or RO4929097 inhibited NOTCH signaling that was induced by ORY-1001, as demonstrated by the lack of abundance of N1ICD and key NOTCH target gene product HES1 (Fig. 5, A and B). Notably, ORY-1001–induced suppression of ASCL1 abundance was at least partially prevented in the presence of either GSI compound (Fig. 5A). Additionally, GSI treatment partially rescued ORY-1001–induced cell death ex vivo in drug-sensitive FHSC04 PDX-derived cells (Fig. 5C), indicating that NOTCH activation is critical to the cytotoxic action of ORY-1001. In accordance, GSI-treated cells were less sensitive to ORY-1001; IC50 values for ORY-1001 and cell viability both markedly increased in the presence of either GSI compound (Fig. 5, C and D). Likewise, the amount of ORY-1001–induced apoptosis, as detected by the abundance of cleaved PARP, decreased in cells treated in the presence of GSIs (Fig. 5E). Together, these results highlight a key role for NOTCH signaling in regulating ASCL1 suppression and the response to ORY-1001. Notably, these assays (Fig. 5) assessed adherent FHSC04 cells ex vivo, which, like FHSC04 suspension cells, exhibited strong neuroendocrine features and marked sensitivity to ORY-1001 (fig. S5).
Fig. 5. Pharmacological inhibition of NOTCH signaling partially rescues effects of ORY-1001.
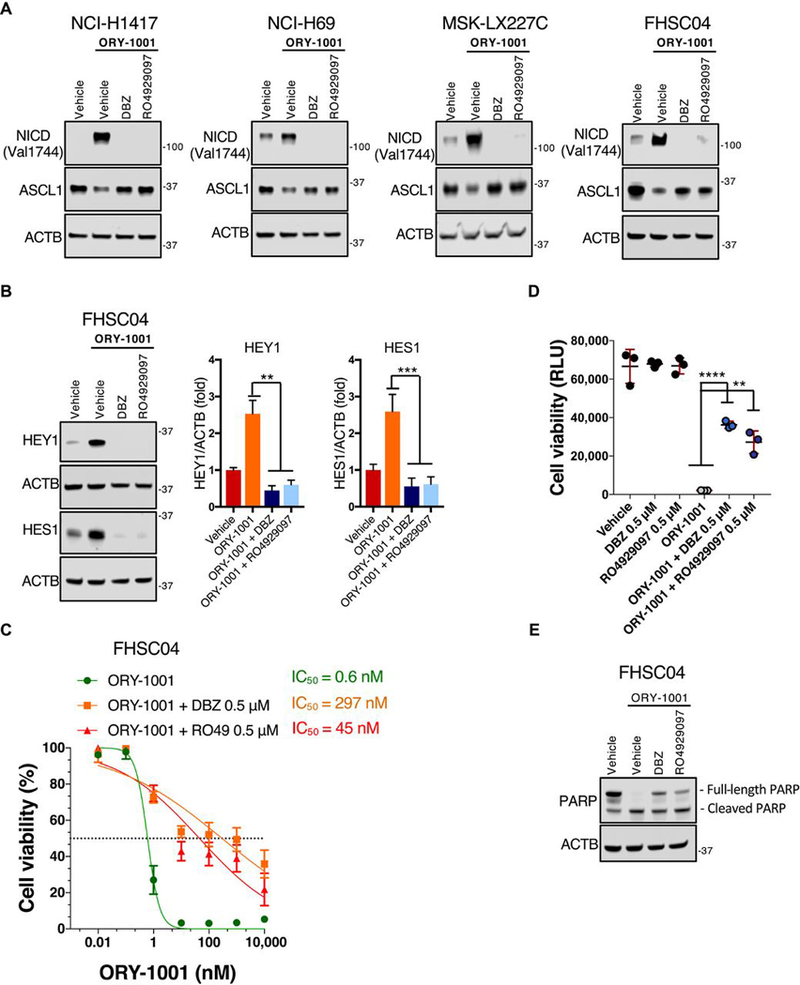
(A) Immunoblot analysis of the indicated proteins in response to ORY-1001 (1nM) with or without the GSIs RO4929097 or DBZ (0.5μM) for 48 hours in SCLC cell lines NCI-H1417 and NCI-H69 as well as ex vivo PDX models MSK-LX227C and FHSC04. ACTB is used as a loading control. Blots are representative of two independent experiments. (B) Immunoblot analysis of HEY1 and HES1 abundance in adherent FHSC04 cells treated as in (A). Data are mean ± SD from n=3 experiments. **P<0.01 and ***P<0.005 by a two-tailed unpaired Student’s t-test. (C) Dose response curves in adherent FHSC04 cells treated ex vivo for 120 hours. Viability was quantified relative to vehicle control using the CellTiter-Glo assay. Data are mean ± SD from n=4 biological replicates, each with 3 technical replicates. (D) An extension of (C), showing the viability of FHSC04 cells in response to ORY-1001 at the 10nM dose, alone and in the presence of RO4929097 or DBZ (0.5μM), with comparison each single GSI alone and vehicle. Data are mean ± SD from n=4 experiments, each with 3 technical replicates. **P<0.01 and ****P<0.0001 by a two-tailed unpaired Student’s t-test. (E) Immunoblot analysis of cleaved PARP in FHSC04 cells in response to 96 hours’ treatment with ORY-1001 (10 nM) alone or with RO4929097 or DBZ (0.5μM). Blots are representative of two independent experiments.
ORY-1001 is effective in PDX models of SCLC in vivo
The efficacy of ORY-1001 was next evaluated in vivo using seven SCLC PDX models (Fig. 6A and fig S6). PDX-bearing NOD scid gamma (NSG; immunodeficient) mice were orally administered ORY-1001 (at 400μg/kg) or saline once weekly. Histological analysis of a panel of organs from ORY-1001–treated and saline-control NSG mice revealed no evident tissue injury associated with oral administration of ORY-1001 for three weeks (fig. S7). Western blot analysis of the PDX models revealed that 6 out of the 7 were ASCL1-positive, with only the JHU-LX33 model lacking ASCL1 expression (fig. S6C). ORY-1001 showed tumor inhibitory effects in all six of the ASCL1-positive PDX models tested (Fig. 6A, fig S6, A and B). In each of these models we observed tumor growth inhibition and 5 of the 6 ASCL1-positive models exhibited significant reduction in the time it took tumors to grow to 6X their initial volume (Fig. 6A and fig. S6B). JHU-LX33, the only model lacking ASCL1 expression (Fig. 2E and fig. S6C), was unresponsive to ORY-1001 (Fig. 6A, bottom), consistent with the hypothesis that ASCL1 expression is a potential biomarker for ORY-1001 responsiveness. Remarkably, PDX model FHSC04 exhibited complete tumor regression with ORY-1001 monotherapy, which occurred following approximately two doses of ORY-1001 given within two weeks (Fig. 6A, top). Responses remained durable in this model after treatment cessation at 21 days; 6/10 animal remained tumor free for the duration of the study and tumor growth delay in the remaining four animals ranged from 80–299 days post treatment end (Fig. 6B). The effects of ORY-1001 treatment were compared to SCLC standard of care, cisplatin-etoposide (CIS-ETO) (Fig. 6C). Again, ORY-1001 treatment resulted in rapid regression of SCLC to a non-palpable state, while CIS-ETO resulted in modest tumor inhibition. Notably, CIS-ETO treatment resulted in significant body weight loss, which was not observed with the more effective ORY-1001 treatment (Fig. 6C, right). FHSC04 tumors treated with ORY-1001 were evaluated by immunohistochemistry for phospho-Ser10 histone H3 (PH3) and TUNEL staining to quantify proliferation and apoptosis, respectively. PH3 staining showed no significant changes in the proportion of mitotic cells, however TUNEL analyses revealed significantly increased cell death in ORY-1001 treated tumors (Fig. 6D). ORY-1001 treatment therefore has the potential to induce a pro-apoptotic response in highly sensitive SCLC patient populations similar to the FHSC04 PDX model.
Fig. 6. ORY-1001 efficacy in PDX models of SCLC.
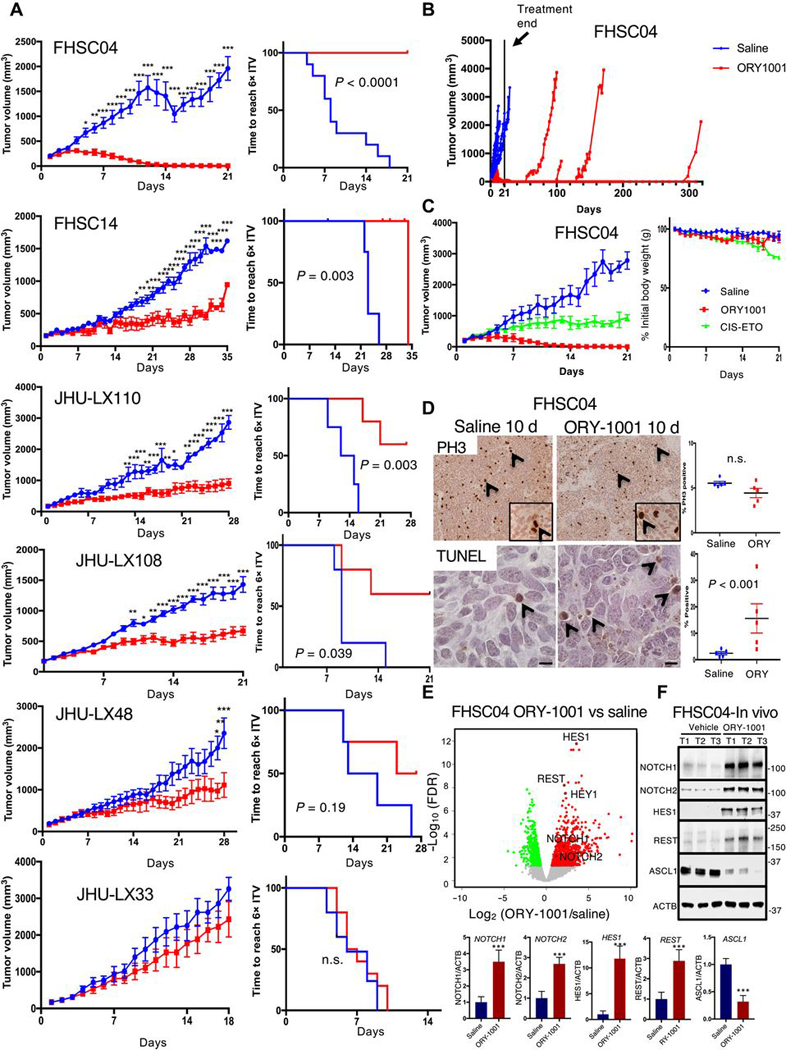
(A) Tumor growth inhibition curves over the treatment period (left) and Kaplan-Meier curves (right) showing time to reach 6X initial tumor volume (ITV) across 6 PDX models of SCLC treated with ORY-1001 (400μg/kg once weekly) or with saline. Mice were treated with saline or ORY-1001 once tumors reached 150mm3. Data are mean ± S.E.M.; n=10 animals total per treatment group for FHSC04 (pooled from two experiments, each with n=5 per group); for all others, n=5–6 per group. Tumor growth curves: *P<0.05, **P<0.005, and ***P<0.0005 by two-way ANOVA with Sidak’s post-test. Kaplan-Meier curves show P-value from log-rank test; n.s. not significant. (B) Tumor volume plots for mice in FHSC04 model treated with saline or ORY-1001 depicted in (A) extending beyond treatment end at 21 days (solid line). Mouse tumor volumes are individually plotted for response and durability of tumor regressions. (C) Repeat of ORY-1001 treatment in FHSC04 with comparison to a cisplatin-etoposide combination therapy (CIS-ETO) (left), n=5 mice per treatment group. Change in body weight is shown to right as CIS-ETO treatment led to reductions in body weight not seen with ORY-1001. Cisplatin was dosed at 5mg/kg once per week, and etoposide at 10mg/kg every 3 days. (D) TUNEL and PH3 immunohistochemistry analysis to assess proliferation and cell death in FHSC04 PDXs collected 10 days after treatment initiation. n=5 tumors per group; P-value, (n.s., not significant) assessed by Student’s t-test. (E) Volcano plot showing differentially expressed genes in FHSC04 PDXs after 10 days’ treatment with ORY-1001 as identified using EdgeR. N=5 control and 5 ORY-1001–treated mice. Red, upregulated genes; green, downregulated genes; FDR<0.01. (F) Western blot analyses and quantifications (below) of ASCL1 and NOTCH-pathway protein abundance in FHSC04 PDX in vivo. Data are mean ± S.E.M. from n = 3 mice per group; tumors harvested 10 days after treatment initiation. ***P<0.005 by two-tailed unpaired Student’s t-test.
To characterize genetic features of the exceptionally responding FHSC04 model, we performed copy number variation (CNV) analyses using low coverage whole genome sequencing and we performed targeted resequencing of a panel of 509 cancer-mutated genes (Ovation Cancer2.0 panel, NuGEN). CNV analyses revealed many regions of chromosomal gains/losses and the absence of focal amplifications in MYC family members in FHSC04 (Supplemental Fig. S8A). Targeted resequencing (fig. S8B) revealed homozygous truncating nonsense mutations in RB1, TP53, and a one base-pair frameshift deletion in CREBBP, a gene that we recently demonstrated to function as an SCLC tumor suppressor (29). Western blot analyses confirmed complete loss of CREBBP protein in FHSC04 and also revealed that another model, JHU-LX110, which exhibited growth inhibition but not regression upon ORY-1001 treatment, also exhibited lacked CREBBP protein abundance (fig. S8C). FHSC04 also harbored a missense mutation of unknown relevance in NOTCH1 (T1379M) and was wild-type for known SCLC-mutated genes, including PTEN, KMT2D and NOTCH2.
To better understand the molecular response to LSD1 inhibition in the highly sensitive FHSC04 in vivo model, we again performed RNAseq analyses. EdgeR was used to identify differentially expressed genes and revealed NOTCH1 pathway genes to be overexpressed upon 10 days of ORY-1001 treatment in vivo (Fig. 6E and fig. S9). Indeed, NOTCH targets genes HES1, HEY1 and REST were among the top 15 differentially expressed transcripts identified (Fig. 6E, table S6 and fig. S9). GOseq analyses identified the NOTCH signaling pathway and regulation of nervous system development as among the significantly over-represented terms (table S7). With ORY-1001 treatment, we observed decreased expression of neuroendocrine transcripts such as CALCA, GRP and INSM1, as well as neuronal transcripts (e.g. RELN, NEURL1, BDNF) (fig. S9). Similar to our ex vivo experiments, we found NOTCH1, NOTCH2, REST and HES1 to be upregulated at the protein level, while ASCL1 was suppressed with in vivo ORY-1001 treatment (Fig. 6F). Thus, the response to LSD1 inhibition in this drug-sensitive model included activation of the NOTCH pathway, suppression of ASCL1, and reduced expression of markers of neuroendocrine/neuronal lineages.
Discussion
Although SCLC often shows strong initial responses to cisplatin-etoposide, these effects are short lived and chemoresistance arises rapidly. There is an urgent need for improved SCLC therapies that take advantage of biological vulnerabilities recently identified in SCLC. LSD1 inhibition may prove to be an effective therapeutic strategy for SCLC by targeting chromatin to suppress neuroendocrine specific differentiation pathways that SCLC cells rely upon for survival.
Our mechanistic studies demonstrate that ASCL1 suppression through NOTCH activation is important for the response to LSD1 inhibition in SCLC. ASCL1 is a transcription factor required for lung neuroendocrine cell development and SCLC cell viability. Ascl1 knockout mice die during development and their fetal lungs completely lack neuroendocrine cells (30). Moreover, when Ascl1 is deleted in a mouse model of SCLC, striking suppression of tumorigenesis is observed in vivo (5). Tumor inhibitory effects are also observed in Ascl1 hemizygous animals, underscoring the importance of normal Ascl1 dosage for SCLC cell viability (5). Although the ASCL1 transcription factor is not classically “druggable”, this study shows that LSD1 inhibition provides a means to activate NOTCH family members, thus suppressing ASCL1 expression. An important finding in our PDX ex vivo and in vivo studies was that LSD1 inhibition in different models led to varied degrees of NOTCH pathway activation and ASCL1 suppression. LSD1 inhibition with ORY-1001 in the FHSC04 model resulted in a rapid and robust drop in ASCL1 protein along with stronger upregulation of NOTCH than seen with less sensitive models. These results were confirmed with genetic experiments, substantiating that these effects of ORY-1001 represent on-target consequences of LSD1 inhibition. Knockdown of ASCL1 in FHSC04 resulted in reduced viability, consistent with a number of reports showing that ASCL1 suppression in SCLC leads to impaired neoplastic potential (5, 21). A previous study linked LSD1 inhibition with suppression of ASCL1 in SCLC cells (13). We now demonstrate that it is NOTCH activation downstream of LSD1 inhibition that results in ASCL1 suppression, and that NOTCH regulation is functionally important for the apoptotic response to ORY-1001 (Fig. 4).
NOTCH pathway activation can be oncogenic in some contexts; however, in SCLC, NOTCH1 is frequently inactivated (2) and thought to function as a tumor suppressor. Indeed, overexpression of the N1ICD or N2ICD strongly inhibited tumor development in mouse SCLC models (2). These in vivo results are consistent with studies that found NOTCH activation in SCLC cells impairs proliferation and suppresses ASCL1 (20, 21). Furthermore, during mouse development, NOTCH signaling inhibits the differentiation of lung neuroendocrine cells from precursor cells (6). Genetic links between LSD1 and NOTCH have been previously made in studies that used Drosophila as a model system (31). Notch target genes were derepressed in dLSD1 inactivating mutants and genetic suppression of the Notch pathway could negate the developmental consequences of loss of function mutations in dLSD1 (31). In mammalian cells, intriguing connections between NOTCH and LSD1 have also been made. In cortical development, defects in neuronal migration caused by LSD1 suppression could be rescued by suppression of NOTCH (32). Physical interactions between LSD1 and NOTCH pathway components, such as RBPJ, have also been described (33). Our studies show that activation of NOTCH downstream of LSD1 inhibition is important for anti-tumorigenic effects of LSD1 inhibition in SCLC. Inhibition of LSD1 using ORY-1001 led to activation of NOTCH signaling, and the NOTCH pathway was one of the most significantly altered upon LSD1 inhibition in PDX models treated with ORY-1001 ex vivo. The activation of NOTCH1 following LSD1 inhibition did not appear to be mediated by changes in H3K4 dimethylation. Instead we demonstrate that LSD1 bound to a region within the NOTCH1 gene associated with increased H3K27 acetylation upon ORY-1001 treatment. The LSD1 CoREST complex includes histone deacetylases HDAC1 and HDAC2 and an outstanding question is whether impairment of these deacetylases upon LSD1 inhibition contributes to NOTCH1 activation. An implication of our data is that key effects of LSD1 inhibition may be unrelated to methylation of H3K4. A lack of change in H3K4 methylation in response to LSD1 inhibition was also found in a recent study of AML, where a LSD1 inhibitor disrupted association between LSD1 and a transcriptional repressor (GFI1) to result in rapid changes in gene expression and increased H3K27 acetylation without changes in H3K4 methylation (34). It will be critical for future work to determine whether LSD1-interacting transcriptional repressors such as GFI1 (or INSM1(13)) contribute to control of NOTCH1 expression in SCLC. The ability of LSD1 inhibition to activate the NOTCH pathway is likely to be highly context dependent. In embryonic stem cells, suppression of LSD1 was not associated with strong activation of NOTCH signaling (22). In contrast to SCLC, NOTCH signaling is oncogenic in T-cell acute lymphoblastic leukemia cells and LSD1 activates the NOTCH pathway under this context (35). In neuroendocrine SCLC, our data demonstrate that NOTCH signaling is activated in response to LSD1 inhibition and this activation contributes to the anti-tumorigenic responses to ORY-1001.
Based on the heterogeneity in responses across different PDX models, it is critical that we better define the factors that contribute to ORY-1001 sensitivity. Our data show that LSD1 inhibition can consistently activate NOTCH signaling and suppress ASCL1 expression, pointing to a mechanism underlying LSD1 activity in SCLC. Our data does not support LSD1 inhibition for the small subset of SCLC that lacks expression of ASCL1, because the one ASCL1-negative PDX model tested (JHU-LX33) was the only model found to be completely non-responsive. A key determinant of whether a tumor will respond well to LSD1 inhibition may be the magnitude of NOTCH activation and downstream suppression of ASCL1, which we found to differ greatly from tumor to tumor. Underlying reasons for different degrees of NOTCH activation in response to ORY-1001 in SCLC are to be explored. Genomic analyses on the exceptionally responsive model FHSC04 revealed the presence of a homozygous truncating deletion in CREBBP and loss of CREBBP protein (fig. S8). Future studies will determine whether mutations in CREBBP, or other features of FHSC04, could be used to help predict durable responses to ORY-1001 in SCLC patients. LSD1 inhibition may augment immune responses (36) and it will be critical for future studies to employ immune-competent models of SCLC to explore the impact of LSD1 inhibition on tumor immunity and response to immune checkpoint inhibitors. Overall, these results can inform future strategies that aim to enhance the activity of LSD1 inhibitors in SCLC through combination therapies that further act to increase NOTCH activity and/or decrease ASCL1 expression to induce synergistic anti-tumor effects.
The highly potent and selective LSD1 inhibitor ORY-1001 shows a robust anti-tumor effect in PDX models of SCLC with a favorable safety profile. Importantly, an exceptional response to ORY-1001 occurred in the PDX model FHSC04, which was derived from a chemoresistant SCLC patient. In this model, we observed complete and durable regression in response to ORY-1001 monotherapy for the duration of the experiment. Given this finding, patient selection to identify potential exceptional responses will be essential to maximize and sustain the clinical benefit of LSD1 inhibitors. Identification of key genetic and epigenetic features of exceptionally responsive SCLC could help direct LSD1 inhibitors to patients with the most clinical benefit.
Materials and Methods:
Experimental Design
This study was designed to evaluate the response of SCLC tumor cells to LSD1 inhibition. We evaluated the response to a novel LSD1 inhibitor, ORY-1001, in SCLC cell lines, SCLC PDX models ex vivo and SCLC PDX models in vivo. We designed experiments to understand the mechanisms underlying responses to ORY-1001. This included genetically perturbing candidate drivers of response to ORY-1001 in SCLC cells and PDX models studied ex vivo. All mouse experiments included the random assigning of mice into treatment groups at time of the initial expansion of the PDX model. In vivo experiments were not performed blinded. Mouse experiments were stopped either at a predetermined end date that differed from 3 to 5 weeks of treatment (dependent on the kinetics of the model) or earlier if tumors reached a maximum diameter of 2 cm or if poor mouse body condition or tumor ulceration necessitated euthanasia. The number of replicates and statistical analyses are reported below and in the figures. No data points were removed as outliers.
Broad cell line panel screen
The activity of ORY-1001 was assessed in a panel of 275 cell lines. All cell lines were grown in medium conditions recommended by ATCC and plated 24 hours prior to compound addition. The endpoint of cell viability was assessed after 96 hours in culture with ORY-1001 using the CellTiter-Glo assay according to manufacturer protocol (Promega). The assay was performed in a 384-well plate format with a final volume of 40μL. Cell lines were treated with 2μL single agent at 1:2 dilutions for a total of 18 doses included the vehicle only control. ORY-1001 and controls, 17-AAG and paclitaxel, were assessed at maximum dose of 50μM concentration diluted in 2% DMSO or PBS. The percentage of antiproliferative activity was calculated using the following formula [1 - (T - B) / (C - B) ] x 100 (%), where T- sample at each concentration, B is no CellTiter-Glo control, and C is the vehicle control. Data were fit with a four-parameter equation using XL-fit to generate a concentration response curve and relative half-maximal effective values (EC50) determined.
PDX model generation and expansion
Animal experiments were performed at the Fred Hutchinson Cancer Research Center following IACUC-approved protocols. The generation of PDX models from SCLC patient CTCs followed protocols approved by the Fred Hutchinson Institutional Review Board and patients provided informed consent for inclusion in the study. Three patient derived xenograft models, FHSC04, FHSC14 and FHSC36 were generated from blood samples obtained from patients with extensive-stage SCLC, following the methodology described by the Dive lab (37). FHSC14 was from a chemonaïve patient while FHSC04 and FHSC36 were from patients who had previously relapsed following first line chemotherapy. Briefly, blood from each patient (7.5 ml) was enriched for CTCs using the RosetteSep CTC Enrichment Cocktail Containing Anti-CD36/Anti-CD45, which enriches for circulating epithelial tumor cells from whole blood based on CD36/CD45 negative selection. The CTC-enriched mononuclear layer of peripheral blood was isolated using Ficoll-Paque separation media. The isolated mononuclear cell layer was washed (1:10 HITES:HBSS) and the resulting cell pellet was suspended 1:1 by volume in Matrigel and HITES media and injected into the left flank of NSG mice under isoflurane anesthesia. The initiation and characterization of additional PDX models used in this study (JHU-LX48, JHU-LX108, JHU-LX110, and JHU-LX33) have been described previously (16–18).
To propagate PDX models, resected tumors were digested in 25ml collagenase from clostridium (1 mg/ml) in PBS for 45 minutes at 37°C with occasional agitation by vortexing to dissociate tissue. To dissociate tissue to a single cell suspension, tissue fragments were diluted 1:1 with RPMI media containing 100U/ml penicillin and 100μg/ml streptomycin, strained through a 70μm strainer and centrifuged at 1250 × g for 10 min. The resulting pellet was resuspended in 20ml of RPMI and strained through a 40μm strainer. Dissociated cells were suspended 1:1 by volume in Matrigel and HITES media at a concentration of 1X10⁶ cells per 100μl final volume per injection site. Cells were implanted using a 28.5-gauge syringe, unilaterally, in the left flank of non-obese (NOD) severe combined immunodeficient (SCID) interleukin-2 receptor γ-deficient (NSG) mice, under isoflurane anesthesia.
PDX drug treatment studies
8 to 12-week-old NSG mice were implanted with 1.0×10⁶ disaggregated cells from one of 7 PDX models (FHSC04, FHSC14, FHSC36, JHU-LX33, JHU-LX48, JHU-LX110, JHU-LX108) in 100μl of 1:1 HITES media:Matrigel. Once palpable, flank tumors were measured in two dimensions (length and width) using digital calipers and volume was calculated using the formula for a prolate ellipsoid, length (mm) x width2 (mm)/2 = mm3. Once tumor volume reached 150–200 mm3, mice were randomly assigned to treatment groups for 21–35 days, depending on the kinetics of growth in the given model. Animals were treated with saline or with 400μg/kg ORY-1001 (Roche), delivered by oral gavage once every 7 days, dissolved to 10 ml/kg with 0.9% saline solution. For the 10-day treatment in FHSC04 used for molecular analyses, an additional dose of 400μg/kg ORY-1001 was given 4 hours before tissue collection. For the FHSC04 model in which complete tumor regressions were observed, ORY-1001 treated mice were monitored for tumor return off of treatment for an additional 300 days.
Histology and Immunohistochemistry
Resected lung tumors and PDX tissue were fixed in neutral buffered formalin for 48 hours before processing to paraffin. Paraffin blocks were sectioned to a thickness of 4μm and stained with hematoxylin and eosin. Immunohistochemical analysis was performed using anti-phospho-Ser10 histone H3 antibody (rabbit, 06–570, 1:300, EMD Millipore). Paraffin sections were processed from xylene through a graded ethanol series to PBS. Unmasking was performed using microwave heating in sodium citrate buffer (0.01 M at pH 6.0). Endogenous peroxidases were blocked with 3.5% H2O2, and immunohistochemical analysis was performed with overnight incubation in primary antibody at 4°C. Biotin-conjugated secondary antibodies (Vector Laboratories) were used at a dilution of 1:100, and detection was done via a biotin-peroxidase complex (Vectastain ABC; Vector Laboratories) with DAB substrate (Vector Laboratories). TUNEL assays were carried out according to the manufacturer’s instructions using the in situ cell death detection kit, POD (11684817910, Roche). Tissue was imaged on a Nikon E800 microscope and quantified at 40x with 3 fields per tissue slice.
Statistics
Two-way analysis of variance (ANOVA) was carried out to compare saline vs. ORY-1001 treatment on tumor volume across the drug treatment period with day and treatment as factors. Significant effects were followed up with Sidak’s multiple comparisons test. Kaplan-Meier curves of time for tumor volume to reach 6x initial tumor volume were generated using GraphPad Prism 7 (GraphPad Software), with a log-rank test to determine p-values for significance. Immunohistochemistry was analyzed using Student’s t-tests, comparing % positive antibody stained cells to total number of cells in each field. For cell growth experiments, statistical significance was determined using a two-tailed unpaired Student’s t-test.
Cell lines, culture and reagents
SCLC cell lines were obtained from the American Type Culture Collection (ATCC). Cells were maintained in accordance to the ATCC guidelines. NCI-H69 and NCI-H1417 were cultured in RPMI-1640 supplemented with 100U/ml penicillin, 100μg/ml streptomycin and 10% fetal bovine serum (FBS). NCI-H510A were cultured in DMEM-F12 supplemented with sodium pyruvate (1mM), insulin-transferrin-selenium (10μg/ml, 5.5μg/ml, 0.0067μg/ml), 30nM hydrocortisone, 10nM beta-estradiol, 100U/ml penicillin, 100 μg/ml streptomycin and 10% fetal bovine serum (FBS). Cells were maintained at 37 °C in a humidified atmosphere containing 5% CO2 and 95% air. All lines were STR profiled for authentication. Ex vivo PDX models were cultured in DMEM-F12 supplemented with sodium pyruvate (1mM), insulin-transferrin-selenium (10μg/ml, 5.5μg/ml, 0.0067μg/ml), 30nM hydrocortisone, 10nM beta-estradiol, 100U/ml penicillin, 100μg/ml streptomycin and 10% fetal bovine serum (FBS). All experiments were performed on low passage ex vivo PDX cultures. 293TN producer cell line was cultured in DMEM supplemented with 100U/ml penicillin, 100μg/ml streptomycin and 10% fetal bovine serum (FBS).
Lentivirus vector production, concentration and generation of stable lines
For lentiviral knockdown experiments, shRNA sequences targeting LSD1, ASCL1, NOTCH1 were selected and cloned into pLKO.1 puro vector (Addgene plasmid #8453) according to The RNAi Consortium’s recommendations (http://portals.broadinstitute.org/gpp/public/). A complete list of shRNA sequences can be found in table S8. Lentiviral vectors were produced by co-transfecting 293TN producer cells with the lentiviral vectors and helper plasmids psPAX2 (Addgene plasmid #12260) and pMD2.G (Addgene plasmid # 12259) (Ratio:1/1/0.67) using a calcium phosphate protocol. Viral supernatants were collected at 64-hours post transfection, filtered and concentrated through a Stericup-HV PVDF 0.45-μm filter. Virus was re-suspended in 1X sterile PBS. Viral transductions were performed for 16–24 hours in the presence of 8μg/ml polybrene. Equal viral titers were used. Puromycin selection was performed for 4–5 days and stable lines were maintained with minimal amount of puromycin (0.125 μg/ml). The FHSC04 TetR cells were generated by stable transduction of a TetR expressing lentiviral vector pLenti CMV TetR Blast (716–1) (Addgene plasmid #17492). A second transduction was performed to introduce a lentiviral vector expressing NOTCH1 NICD or a control vector under the regulation of Tet operator CMV promoter. The pLenti-puro NOTCH1 NICD was generated by PCR amplifying the NOTCH1-NICD cDNA from Tet-O-FUW-NICD (Addgene plasmid #61540) and cloning into the pLenti-Puro (Addgene plasmid 39481) using the SpeI and MluI restriction sites.
qRT–PCR
For ex vivo PDX samples, RNA was extracted in TRIzol (Invitrogen) and isolated according to the manufacturer’s protocol. cDNA was generated using the iScript synthesis kit (Bio-Rad) according to the manufacturer’s protocol. qPCR experiments were run on a Biorad qPCR instrument (CFX384). Data were normalized to GAPDH. A list of all the primers used for qRT–PCR can be found in table S9.
Drug treatment effects on cell proliferation and viability
To monitor proliferation, cells were seeded at 10,000 cells/well in 96-well plates. Live-cell content was estimated using a CellTiter-Glo assay (Promega) according to the manufacturer’s protocol at the times indicated in the figure legends. For each experiment, ORY-1001 was re-suspended in saline (vehicle) and used within 24 hours. Ex vivo ORY-1001 studies were performed in 96-well plates (10,000 cells/well) over 120 hours. CellTiter-Glo was used to determine the relative cell content and viability. GSIs RO4929097 and DBZ were purchased from Selleckchem and used at 0.5μM.
Growth curve analyses
Cells were plated in 12 well plates on day 0 in presence or absence of 1μg/ml of doxycycline (DOX). DOX was replenished every 2 days. Every 4 days, the number of cells was counted using an automated Z2 Series Coulter Counter (Beckman Coulter) and the same number of cells was re-plated for further counts. Experiments were carried out for a total of 12 days. Population doublings were calculated using the following formula: n = 3.32 (log UCY - log l) + X, where n = the final population doubling at end of a given subculture, UCY = the cell yield at that point, l = the cell number used as inoculum to begin that subculture, and X = the doubling of the inoculum used to initiate the subculture being quantitated.
Western blot analysis
Whole-cell protein extracts were prepared in cold cell-lysis buffer (50mM Tris-HCl pH 7.5, 150mM NaCl, 0.1% Sodium dodecyl sulfate, 1% Triton X-100, 0.5% Sodium deoxycholate, 5mM EDTA) supplemented with protease and phosphatase inhibitors. Proteins were quantified using BCA protein assay, resolved on SDS PAGE gels (4–20%) and transferred to nitrocellulose membranes. Alternatively, cells were counted and directly re-suspended in Laemmli buffer (1X). Protein samples were normalized to either tubulin or actin-beta. A detailed list of antibodies used in the study can be found in table S10.
ChIP-Seq experiments
Cells were treated with ORY-1001 or controls at the indicated timeframe and concentration. Cell pellets were submersed in 1% formaldehyde in PBS, capped and agitated at room temperature for 15 min. Fixation was stopped by the addition of 0.125 M glycine (final concentration). Cell pellets were washed twice with PBS, Igepal (0.5%), and PMSF (1mM) and kept on ice for the remainder of procedure. Chromatin was isolated by the addition of lysis buffer. Lysates were sonicated and the DNA sheared to an average length of 300–500 bp. Genomic DNA (Input) was prepared by treating aliquots of chromatin with RNase, proteinase K and heat for de-crosslinking, followed by ethanol precipitation. Pellets were re-suspended and the resulting DNA was quantified on a NanoDrop spectrophotometer. Extrapolation to the original chromatin volume allowed quantitation of the total chromatin yield. Aliquots of chromatin (20–30μg) were pre-cleared with protein A agarose beads (Invitrogen). Genomic DNA regions of interest were isolated using 5μl antibody against LSD1 (CST; 2184), or 4μg of antibody against H3K27Ac (Active Motif; 39133) and H3K4me2 (Active Motif; 39679). Complexes were washed, eluted from the beads with SDS buffer, and subjected to RNase and proteinase K treatment. Crosslinks were reversed by incubation overnight at 65°C, and ChIP DNA was purified by phenol-chloroform extraction and ethanol precipitation. Samples were subjected to subsequent Illumina sequence analysis or Quantitative PCR (qPCR) reactions were carried out by Active Motif in triplicate using SYBR Green Supermix (Bio-Rad; 170–8882) on a CFX Connect™ Real Time PCR system, using the probes indicated in table S9. Data are reported as “binding events per 1000 cells” which considers chromatin input, ChIP volumes and primer pair efficiencies. Illumina sequencing libraries were prepared from the ChIP and Input DNAs by the standard consecutive enzymatic steps of end-polishing, dA-addition, and adaptor ligation. After a final PCR amplification step, the resulting DNA libraries were quantified and sequenced on Illumina’s NextSeq 500 (75bp single ended reads). Reads were aligned to the human genome (hg19) using Burrows-Wheeler Aligner (38) with default settings. Duplicate reads were removed and only uniquely mapped reads (mapping quality ≥25) were used for further analysis. Alignments were extended in silico at their 3’-ends to a length of 200bp, which is the average genomic fragment length in the size-selected library and assigned to 32bp bins along the genome. The resulting histograms (genomic “signal maps”) were stored in bigWig files. Drosophila genome spike-in was used to downsample and normalize tag counts for comparisons across treated and untreated samples (Active Motif; ChIP Normalization Strategy) (39).
RNA-Seq analyses
For RNA-Seq analyses using PDX samples in vivo and ex vivo, the Ultra RNA Library Prep Kit for Illumina (New England BioLabs; catalog E753L) was used to generate libraries from total RNA. All library preparation was conducted according to the manufacturer’s instructions. Single-end sequencing (50bp) was performed using an Illumina HiSeq 2500, reads of low quality were filtered prior to alignment to the hg19 genome build using TopHat v2.0.12 (40). In vivo PDX samples were also aligned to mm9, where the mouse and human alignments from a given sample were compared, discarding from downstream analysis those reads which had fewer mismatches to mouse, relative to human. Cuffdiff v2.1.1 (41) was used to generate fragment per kilobase per million (FPKM) expression values. Counts were generated from TopHat alignments using the Python package HTSeq v0.6.1 (42) using the “intersection-strict” overlap mode. Genes with low counts across conditions were discarded prior to identification of differentially expressed genes using the Bioconductor package edgeR, v3.16.5 (43). A false discovery rate (FDR) (44) method was used to correct for multiple testing, where differentially expressed genes were identified with the FDR set at 5%. GOTERM_BP_DIRECT ontologies were acquired from DAVID v6.8 (45), and used with the Bioconductor package goseq v1.26.0 (19) to identify overrepresented genes that were either significantly up or downregulated, applying a FDR method to correct for multiple testing (44). For RNA-Seq analyses using human SCLC cell lines (Fig. 1), RNA libraries were prepared from total RNA using poly-A TruSeq Illumina kits and also sequenced using an Illumina HiSeq2500. 100ng of mRNA was used per cell line. Raw reads were aligned against the human genome (hg19) using GSNAP (46) following recommended options for RNA-Seq data. Resulting SAM files were converted to sorted BAM files using Samtools. Gene expression values were calculated both as FPKM values and as read counts. Normalized read counts were obtained using the R package DESeq2 (47). An offset of 1 was added to each normalized expression value prior to log transformation and import into GenePattern v3.9.4 (48), where a row-based (gene-wise) z-score normalization was applied, followed by generation of a heat map (Fig. 1).
Supplementary Material
Acknowledgements:
The authors acknowledge assistance from the Fred Hutch Genomics and Bioinformatics Shared Resource as well as the Histopathology Shared Resource.
Funding: DM acknowledges research support from Roche, from NIH/NCI grants R01CA197867 and R01CA200547 and from a Seattle Translational Tumor Research grant and from the Fred Hutch/University of Washington Cancer Consortium Support Grant P30CA015704. AA acknowledges support from the Lung Cancer Research Foundation/Uniting Against Lung Cancer. NIH/NCI training grants T32CA009657 and T32CA080416 supported EE and EG, respectively. DM and JTP acknowledge support from the Bonnie Addario Lung Cancer Foundation. JTP and CMR acknowledge support from the VARI-SU2C Epigenetics Dream Team Award.
Footnotes
Competing Interests: DM received research support from Roche that partially supported costs of this research. F. Milletti, WC and F. Mack are employees of Roche. CMR has consulted with Roche and Celgene regarding anti-cancer drug development. The other authors declare that they have no conflicts of interest.
Data and Materials Availability: All data needed to evaluate the conclusions in the paper are present in the paper or the Supplementary Materials. The PDX models used here are available from Fred Hutchinson and from Memorial Sloan Kettering Institute under a material transfer agreement. Genomic datasets have been submitted to GEO under the SuperSeries accession number GSE103097.
References and Notes
- 1.Gazdar AF, Bunn PA, Minna JD, Small-cell lung cancer: what we know, what we need to know and the path forward. Nature reviews. Cancer 17, 725–737 (2017); published online EpubDec ( 10.1038/nrc.2017.87). [DOI] [PubMed] [Google Scholar]
- 2.George J, Lim JS, Jang SJ, Cun Y, Ozretic L, Kong G, Leenders F, Lu X, Fernandez-Cuesta L, Bosco G, Muller C, Dahmen I, Jahchan NS, Park KS, Yang D, Karnezis AN, Vaka D, Torres A, Wang MS, Korbel JO, Menon R, Chun SM, Kim D, Wilkerson M, Hayes N, Engelmann D, Putzer B, Bos M, Michels S, Vlasic I, Seidel D, Pinther B, Schaub P, Becker C, Altmuller J, Yokota J, Kohno T, Iwakawa R, Tsuta K, Noguchi M, Muley T, Hoffmann H, Schnabel PA, Petersen I, Chen Y, Soltermann A, Tischler V, Choi CM, Kim YH, Massion PP, Zou Y, Jovanovic D, Kontic M, Wright GM, Russell PA, Solomon B, Koch I, Lindner M, Muscarella LA, la Torre A, Field JK, Jakopovic M, Knezevic J, Castanos-Velez E, Roz L, Pastorino U, Brustugun OT, Lund-Iversen M, Thunnissen E, Kohler J, Schuler M, Botling J, Sandelin M, Sanchez-Cespedes M, Salvesen HB, Achter V, Lang U, Bogus M, Schneider PM, Zander T, Ansen S, Hallek M, Wolf J, Vingron M, Yatabe Y, Travis WD, Nurnberg P, Reinhardt C, Perner S, Heukamp L, Buttner R, Haas SA, Brambilla E, Peifer M, Sage J, Thomas RK, Comprehensive genomic profiles of small cell lung cancer. Nature 524, 47–53 (2015); published online EpubAug 6 ( 10.1038/nature14664). [DOI] [PMC free article] [PubMed] [Google Scholar]
- 3.Rudin CM, Durinck S, Stawiski EW, Poirier JT, Modrusan Z, Shames DS, Bergbower EA, Guan Y, Shin J, Guillory J, Rivers CS, Foo CK, Bhatt D, Stinson J, Gnad F, Haverty PM, Gentleman R, Chaudhuri S, Janakiraman V, Jaiswal BS, Parikh C, Yuan W, Zhang Z, Koeppen H, Wu TD, Stern HM, Yauch RL, Huffman KE, Paskulin DD, Illei PB, Varella-Garcia M, Gazdar AF, de Sauvage FJ, Bourgon R, Minna JD, Brock MV, Seshagiri S, Comprehensive genomic analysis identifies SOX2 as a frequently amplified gene in small-cell lung cancer. Nature genetics, (2012); published online EpubSep 2 ( 10.1038/ng.2405). [DOI] [PMC free article] [PubMed] [Google Scholar]
- 4.Augert A, Zhang Q, Bates B, Cui M, Wang X, Wildey G, Dowlati A, MacPherson D, Small Cell Lung Cancer Exhibits Frequent Inactivating Mutations in the Histone Methyltransferase KMT2D/MLL2: CALGB 151111 (Alliance). Journal of thoracic oncology : official publication of the International Association for the Study of Lung Cancer 12, 704–713 (2017); published online EpubApr ( 10.1016/j.jtho.2016.12.011). [DOI] [PMC free article] [PubMed] [Google Scholar]
- 5.Borromeo MD, Savage TK, Kollipara RK, He M, Augustyn A, Osborne JK, Girard L, Minna JD, Gazdar AF, Cobb MH, Johnson JE, ASCL1 and NEUROD1 Reveal Heterogeneity in Pulmonary Neuroendocrine Tumors and Regulate Distinct Genetic Programs. Cell reports, (2016); published online EpubJul 20 ( 10.1016/j.celrep.2016.06.081). [DOI] [PMC free article] [PubMed] [Google Scholar]
- 6.Ito T, Udaka N, Yazawa T, Okudela K, Hayashi H, Sudo T, Guillemot F, Kageyama R, Kitamura H, Basic helix-loop-helix transcription factors regulate the neuroendocrine differentiation of fetal mouse pulmonary epithelium. Development 127, 3913–3921 (2000); published online EpubSep ( [DOI] [PubMed] [Google Scholar]
- 7.Mohammad HP, Smitheman KN, Kamat CD, Soong D, Federowicz KE, Van Aller GS, Schneck JL, Carson JD, Liu Y, Butticello M, Bonnette WG, Gorman SA, Degenhardt Y, Bai Y, McCabe MT, Pappalardi MB, Kasparec J, Tian X, McNulty KC, Rouse M, McDevitt P, Ho T, Crouthamel M, Hart TK, Concha NO, McHugh CF, Miller WH, Dhanak D, Tummino PJ, Carpenter CL, Johnson NW, Hann CL, Kruger RG, A DNA Hypomethylation Signature Predicts Antitumor Activity of LSD1 Inhibitors in SCLC. Cancer Cell 28, 57–69 (2015); published online EpubJul 13 ( 10.1016/j.ccell.2015.06.002). [DOI] [PubMed] [Google Scholar]
- 8.Shi Y, Lan F, Matson C, Mulligan P, Whetstine JR, Cole PA, Casero RA, Shi Y, Histone demethylation mediated by the nuclear amine oxidase homolog LSD1. Cell 119, 941–953 (2004); published online EpubDec 29 ( 10.1016/j.cell.2004.12.012). [DOI] [PubMed] [Google Scholar]
- 9.Whyte WA, Bilodeau S, Orlando DA, Hoke HA, Frampton GM, Foster CT, Cowley SM, Young RA, Enhancer decommissioning by LSD1 during embryonic stem cell differentiation. Nature 482, 221–225 (2012); published online EpubFeb 9 ( 10.1038/nature10805). [DOI] [PMC free article] [PubMed] [Google Scholar]
- 10.Shi YJ, Matson C, Lan F, Iwase S, Baba T, Shi Y, Regulation of LSD1 histone demethylase activity by its associated factors. Molecular cell 19, 857–864 (2005); published online EpubSep 16 ( 10.1016/j.molcel.2005.08.027). [DOI] [PubMed] [Google Scholar]
- 11.Wang Y, Zhang H, Chen Y, Sun Y, Yang F, Yu W, Liang J, Sun L, Yang X, Shi L, Li R, Li Y, Zhang Y, Li Q, Yi X, Shang Y, LSD1 is a subunit of the NuRD complex and targets the metastasis programs in breast cancer. Cell 138, 660–672 (2009); published online EpubAug 21 ( 10.1016/j.cell.2009.05.050). [DOI] [PubMed] [Google Scholar]
- 12.Maes T, Mascaro C, Tirapu I, Estiarte A, Ciceri F, Lunardi S, Guibourt N, Perdones A, Lufino MMP, Somervaille TCP, Wiseman DH, Duy C, Melnick A, Willekens C, Ortega A, Martinell M, Valls N, Kurz G, Fyfe M, Castro-Palomino JC, Buesa C, ORY-1001, a Potent and Selective Covalent KDM1A Inhibitor, for the Treatment of Acute Leukemia. Cancer Cell 33, 495–511 e412 (2018); published online EpubMar 12 ( 10.1016/j.ccell.2018.02.002). [DOI] [PubMed] [Google Scholar]
- 13.Takagi S, Ishikawa Y, Mizutani A, Iwasaki S, Matsumoto S, Kamada Y, Nomura T, Nakamura K, LSD1 Inhibitor T-3775440 Inhibits SCLC Cell Proliferation by Disrupting LSD1 Interactions with SNAG Domain Proteins INSM1 and GFI1B. Cancer Res 77, 4652–4662 (2017); published online EpubSep 01 ( 10.1158/0008-5472.CAN-16-3502). [DOI] [PubMed] [Google Scholar]
- 14.Kuleshov MV, Jones MR, Rouillard AD, Fernandez NF, Duan Q, Wang Z, Koplev S, Jenkins SL, Jagodnik KM, Lachmann A, McDermott MG, Monteiro CD, Gundersen GW, Ma’ayan A, Enrichr: a comprehensive gene set enrichment analysis web server 2016 update. Nucleic Acids Res 44, W90–97 (2016); published online EpubJul 8 ( 10.1093/nar/gkw377). [DOI] [PMC free article] [PubMed] [Google Scholar]
- 15.Daniel VC, Marchionni L, Hierman JS, Rhodes JT, Devereux WL, Rudin CM, Yung R, Parmigiani G, Dorsch M, Peacock CD, Watkins DN, A primary xenograft model of small-cell lung cancer reveals irreversible changes in gene expression imposed by culture in vitro. Cancer Res 69, 3364–3373 (2009); published online EpubApr 15 ( 10.1158/0008-5472.CAN-08-4210). [DOI] [PMC free article] [PubMed] [Google Scholar]
- 16.Hann CL, Daniel VC, Sugar EA, Dobromilskaya I, Murphy SC, Cope L, Lin X, Hierman JS, Wilburn DL, Watkins DN, Rudin CM, Therapeutic efficacy of ABT-737, a selective inhibitor of BCL-2, in small cell lung cancer. Cancer Res 68, 2321–2328 (2008); published online EpubApr 01 ( 10.1158/0008-5472.CAN-07-5031). [DOI] [PMC free article] [PubMed] [Google Scholar]
- 17.Poirier JT, Dobromilskaya I, Moriarty WF, Peacock CD, Hann CL, Rudin CM, Selective tropism of Seneca Valley virus for variant subtype small cell lung cancer. J Natl Cancer Inst 105, 1059–1065 (2013); published online EpubJul 17 ( 10.1093/jnci/djt130). [DOI] [PMC free article] [PubMed] [Google Scholar]
- 18.Leong TL, Marini KD, Rossello FJ, Jayasekara SN, Russell PA, Prodanovic Z, Kumar B, Ganju V, Alamgeer M, Irving LB, Steinfort DP, Peacock CD, Cain JE, Szczepny A, Watkins DN, Genomic characterisation of small cell lung cancer patient-derived xenografts generated from endobronchial ultrasound-guided transbronchial needle aspiration specimens. PLoS One 9, e106862 (2014) 10.1371/journal.pone.0106862). [DOI] [PMC free article] [PubMed] [Google Scholar]
- 19.Young MD, Wakefield MJ, Smyth GK, Oshlack A, Gene ontology analysis for RNA-seq: accounting for selection bias. Genome Biol 11, R14 (2010) 10.1186/gb-2010-11-2-r14). [DOI] [PMC free article] [PubMed] [Google Scholar]
- 20.Sriuranpong V, Borges MW, Ravi RK, Arnold DR, Nelkin BD, Baylin SB, Ball DW, Notch signaling induces cell cycle arrest in small cell lung cancer cells. Cancer Res 61, 3200–3205 (2001); published online EpubApr 01 ( [PubMed] [Google Scholar]
- 21.Lim JS, Ibaseta A, Fischer MM, Cancilla B, O’Young G, Cristea S, Luca VC, Yang D, Jahchan NS, Hamard C, Antoine M, Wislez M, Kong C, Cain J, Liu YW, Kapoun AM, Garcia KC, Hoey T, Murriel CL, Sage J, Intratumoural heterogeneity generated by Notch signalling promotes small-cell lung cancer. Nature 545, 360–364 (2017); published online EpubMay 18 ( 10.1038/nature22323). [DOI] [PMC free article] [PubMed] [Google Scholar]
- 22.Adamo A, Sese B, Boue S, Castano J, Paramonov I, Barrero MJ, Izpisua Belmonte JC, LSD1 regulates the balance between self-renewal and differentiation in human embryonic stem cells. Nat Cell Biol 13, 652–659 (2011); published online EpubJun ( 10.1038/ncb2246). [DOI] [PubMed] [Google Scholar]
- 23.Harris WJ, Huang X, Lynch JT, Spencer GJ, Hitchin JR, Li Y, Ciceri F, Blaser JG, Greystoke BF, Jordan AM, Miller CJ, Ogilvie DJ, Somervaille TC, The histone demethylase KDM1A sustains the oncogenic potential of MLL-AF9 leukemia stem cells. Cancer Cell 21, 473–487 (2012); published online EpubApr 17 ( 10.1016/j.ccr.2012.03.014). [DOI] [PubMed] [Google Scholar]
- 24.Schenk T, Chen WC, Gollner S, Howell L, Jin L, Hebestreit K, Klein HU, Popescu AC, Burnett A, Mills K, Casero RA Jr., Marton L, Woster P, Minden MD, Dugas M, Wang JC, Dick JE, Muller-Tidow C, Petrie K, Zelent A, Inhibition of the LSD1 (KDM1A) demethylase reactivates the all-trans-retinoic acid differentiation pathway in acute myeloid leukemia. Nat Med 18, 605–611 (2012); published online EpubApr ( 10.1038/nm.2661). [DOI] [PMC free article] [PubMed] [Google Scholar]
- 25.Hakimi MA, Dong Y, Lane WS, Speicher DW, Shiekhattar R, A candidate X-linked mental retardation gene is a component of a new family of histone deacetylase-containing complexes. J Biol Chem 278, 7234–7239 (2003); published online EpubFeb 28 ( 10.1074/jbc.M208992200). [DOI] [PubMed] [Google Scholar]
- 26.Ran Y, Hossain F, Pannuti A, Lessard CB, Ladd GZ, Jung JI, Minter LM, Osborne BA, Miele L, Golde TE, gamma-Secretase inhibitors in cancer clinical trials are pharmacologically and functionally distinct. EMBO molecular medicine 9, 950–966 (2017); published online EpubJul ( 10.15252/emmm.201607265). [DOI] [PMC free article] [PubMed] [Google Scholar]
- 27.Milano J, McKay J, Dagenais C, Foster-Brown L, Pognan F, Gadient R, Jacobs RT, Zacco A, Greenberg B, Ciaccio PJ, Modulation of notch processing by gamma-secretase inhibitors causes intestinal goblet cell metaplasia and induction of genes known to specify gut secretory lineage differentiation. Toxicol Sci 82, 341–358 (2004); published online EpubNov ( 10.1093/toxsci/kfh254). [DOI] [PubMed] [Google Scholar]
- 28.Luistro L, He W, Smith M, Packman K, Vilenchik M, Carvajal D, Roberts J, Cai J, Berkofsky-Fessler W, Hilton H, Linn M, Flohr A, Jakob-Rotne R, Jacobsen H, Glenn K, Heimbrook D, Boylan JF, Preclinical profile of a potent gamma-secretase inhibitor targeting notch signaling with in vivo efficacy and pharmacodynamic properties. Cancer Res 69, 7672–7680 (2009); published online EpubOct 1 ( 10.1158/0008-5472.CAN-09-1843). [DOI] [PMC free article] [PubMed] [Google Scholar]
- 29.Jia D, Augert A, Kim DW, Eastwood E, Wu N, Ibrahim AH, Kim KB, Dunn CT, Pillai SPS, Gazdar AF, Bolouri H, Park KS, MacPherson D, Crebbp Loss Drives Small Cell Lung Cancer and Increases Sensitivity to HDAC Inhibition. Cancer discovery, (2018); published online EpubSep 4 ( 10.1158/2159-8290.CD-18-0385). [DOI] [PMC free article] [PubMed] [Google Scholar]
- 30.Borges M, Linnoila RI, van de Velde HJ, Chen H, Nelkin BD, Mabry M, Baylin SB, Ball DW, An achaete-scute homologue essential for neuroendocrine differentiation in the lung. Nature 386, 852–855 (1997); published online EpubApr 24 ( 10.1038/386852a0). [DOI] [PubMed] [Google Scholar]
- 31.Di Stefano L, Walker JA, Burgio G, Corona DF, Mulligan P, Naar AM, Dyson NJ, Functional antagonism between histone H3K4 demethylases in vivo. Genes Dev 25, 17–28 (2011); published online EpubJan 01 ( 10.1101/gad.1983711). [DOI] [PMC free article] [PubMed] [Google Scholar]
- 32.Lopez CI, Saud KE, Aguilar R, Berndt FA, Canovas J, Montecino M, Kukuljan M, The chromatin modifying complex CoREST/LSD1 negatively regulates notch pathway during cerebral cortex development. Dev Neurobiol 76, 1360–1373 (2016); published online EpubDec ( 10.1002/dneu.22397). [DOI] [PubMed] [Google Scholar]
- 33.Xu T, Park SS, Giaimo BD, Hall D, Ferrante F, Ho DM, Hori K, Anhezini L, Ertl I, Bartkuhn M, Zhang H, Milon E, Ha K, Conlon KP, Kuick R, Govindarajoo B, Zhang Y, Sun Y, Dou Y, Basrur V, Elenitoba-Johnson KS, Nesvizhskii AI, Ceron J, Lee CY, Borggrefe T, Kovall RA, Rual JF, RBPJ/CBF1 interacts with L3MBTL3/MBT1 to promote repression of Notch signaling via histone demethylase KDM1A/LSD1. EMBO J 36, 3232–3249 (2017); published online EpubNov 2 ( 10.15252/embj.201796525). [DOI] [PMC free article] [PubMed] [Google Scholar]
- 34.Maiques-Diaz A, Spencer GJ, Lynch JT, Ciceri F, Williams EL, Amaral FMR, Wiseman DH, Harris WJ, Li Y, Sahoo S, Hitchin JR, Mould DP, Fairweather EE, Waszkowycz B, Jordan AM, Smith DL, Somervaille TCP, Enhancer Activation by Pharmacologic Displacement of LSD1 from GFI1 Induces Differentiation in Acute Myeloid Leukemia. Cell reports 22, 3641–3659 (2018); published online EpubMar 27 ( 10.1016/j.celrep.2018.03.012). [DOI] [PMC free article] [PubMed] [Google Scholar]
- 35.Yatim A, Benne C, Sobhian B, Laurent-Chabalier S, Deas O, Judde JG, Lelievre JD, Levy Y, Benkirane M, NOTCH1 nuclear interactome reveals key regulators of its transcriptional activity and oncogenic function. Molecular cell 48, 445–458 (2012); published online EpubNov 09 ( 10.1016/j.molcel.2012.08.022). [DOI] [PMC free article] [PubMed] [Google Scholar]
- 36.Sheng W, LaFleur MW, Nguyen TH, Chen S, Chakravarthy A, Conway JR, Li Y, Chen H, Yang H, Hsu PH, Van Allen EM, Freeman GJ, De Carvalho DD, He HH, Sharpe AH, Shi Y, LSD1 Ablation Stimulates Anti-tumor Immunity and Enables Checkpoint Blockade. Cell 174, 549–563 e519 (2018); published online EpubJul 26 ( 10.1016/j.cell.2018.05.052). [DOI] [PMC free article] [PubMed] [Google Scholar]
- 37.Hodgkinson CL, Morrow CJ, Li Y, Metcalf RL, Rothwell DG, Trapani F, Polanski R, Burt DJ, Simpson KL, Morris K, Pepper SD, Nonaka D, Greystoke A, Kelly P, Bola B, Krebs MG, Antonello J, Ayub M, Faulkner S, Priest L, Carter L, Tate C, Miller CJ, Blackhall F, Brady G, Dive C, Tumorigenicity and genetic profiling of circulating tumor cells in small-cell lung cancer. Nat Med 20, 897–903 (2014); published online EpubAug ( 10.1038/nm.3600). [DOI] [PubMed] [Google Scholar]
- 38.Li H, Durbin R, Fast and accurate long-read alignment with Burrows-Wheeler transform. Bioinformatics 26, 589–595 (2010); published online EpubMar 1 ( 10.1093/bioinformatics/btp698). [DOI] [PMC free article] [PubMed] [Google Scholar]
- 39.Orlando DA, Chen MW, Brown VE, Solanki S, Choi YJ, Olson ER, Fritz CC, Bradner JE, Guenther MG, Quantitative ChIP-Seq normalization reveals global modulation of the epigenome. Cell reports 9, 1163–1170 (2014); published online EpubNov 06 ( 10.1016/j.celrep.2014.10.018). [DOI] [PubMed] [Google Scholar]
- 40.Trapnell C, Pachter L, Salzberg SL, TopHat: discovering splice junctions with RNA-Seq. Bioinformatics 25, 1105–1111 (2009); published online EpubMay 1 ( 10.1093/bioinformatics/btp120). [DOI] [PMC free article] [PubMed] [Google Scholar]
- 41.Trapnell C, Hendrickson DG, Sauvageau M, Goff L, Rinn JL, Pachter L, Differential analysis of gene regulation at transcript resolution with RNA-seq. Nature biotechnology 31, 46–53 (2013); published online EpubJan ( 10.1038/nbt.2450). [DOI] [PMC free article] [PubMed] [Google Scholar]
- 42.Anders S, Pyl PT, Huber W, HTSeq--a Python framework to work with high-throughput sequencing data. Bioinformatics 31, 166–169 (2015); published online EpubJan 15 ( 10.1093/bioinformatics/btu638). [DOI] [PMC free article] [PubMed] [Google Scholar]
- 43.Robinson MD, McCarthy DJ, Smyth GK, edgeR: a Bioconductor package for differential expression analysis of digital gene expression data. Bioinformatics 26, 139–140 (2010); published online EpubJan 1 ( 10.1093/bioinformatics/btp616). [DOI] [PMC free article] [PubMed] [Google Scholar]
- 44.Reiner A, Yekutieli D, Benjamini Y, Identifying differentially expressed genes using false discovery rate controlling procedures. Bioinformatics 19, 368–375 (2003); published online EpubFeb 12 ( [DOI] [PubMed] [Google Scholar]
- 45.Huang da W, Sherman BT, Lempicki RA, Systematic and integrative analysis of large gene lists using DAVID bioinformatics resources. Nat Protoc 4, 44–57 (2009) 10.1038/nprot.2008.211). [DOI] [PubMed] [Google Scholar]
- 46.Wu TD, Nacu S, Fast and SNP-tolerant detection of complex variants and splicing in short reads. Bioinformatics 26, 873–881 (2010); published online EpubApr 01 ( 10.1093/bioinformatics/btq057). [DOI] [PMC free article] [PubMed] [Google Scholar]
- 47.Anders S, Huber W, Differential expression analysis for sequence count data. Genome Biol 11, R106 (2010) 10.1186/gb-2010-11-10-r106). [DOI] [PMC free article] [PubMed] [Google Scholar]
- 48.Reich M, Liefeld T, Gould J, Lerner J, Tamayo P, Mesirov JP, GenePattern 2.0. Nat Genet 38, 500–501 (2006); published online EpubMay ( 10.1038/ng0506-500). [DOI] [PubMed] [Google Scholar]
Associated Data
This section collects any data citations, data availability statements, or supplementary materials included in this article.