

Abstract
Objective:
We hypothesized that inpatient postoperative pain trajectories are associated with 30-day inpatient readmission and emergency department (ED) visits.
Background:
Surgical readmissions have few known modifiable predictors. Pain experienced by patients may reflect surgical complications and/or inadequate or difficult symptom management.
Methods:
National Veterans Affairs Surgical Quality Improvement data on inpatient general, vascular, and orthopedic surgery from 2008 to 2014 were merged with laboratory, vital sign, health care utilization, and postoperative complications data. Six distinct postoperative inpatient patient-reported pain trajectories were identified: (1) persistently low, (2) mild, (3) moderate or (4) high trajectories, and (5) mild-to-low or (6) moderate-to-low trajectories based on postoperative pain scores. Regression models estimated the association between pain trajectories and postdischarge utilization while controlling for important patient and clinical variables.
Results:
Our sample included 211,231 surgeries—45.4% orthopedics, 37.0% general, and 17.6% vascular. Overall, the 30-day unplanned readmission rate was 10.8%, and 30-day ED utilization rate was 14.2%. Patients in the high pain trajectories had the highest rates of postdischarge readmissions and ED visits (14.4% and 16.3%, respectively, P < 0.001). In multivariable models, compared with the persistently low pain trajectory, there was a dose-dependent increase in postdischarge ED visits and readmission for pain-related diagnoses, but not postdischarge complications (χ2 trend P < 0.001).
Conclusions:
Postoperative pain trajectories identify populations at risk for 30-day readmissions and ED visits, and do not seem to be mediated by postdischarge complications. Addressing pain control expectations before discharge may help reduce surgical readmissions in high pain categories.
Keywords: complications, pain, readmission, surgery
Postoperative readmissions are relatively common and costly, with an estimated cost of about $17 billion to Medicare in a single year.1,2 In light of both higher cost and health care utilization, the Affordable Care Act directed the Centers for Medicare and Medicaid Services (CMS) to introduce the Hospital Readmission Reduction Program, with the goal to reduce readmission rates by penalizing hospitals based on excessive 30-day readmission rates.3,4 Although this policy originally focused on medical readmissions, it now includes patients admitted for certain surgical procedures. Under these new initiatives to align payments with quality, there has been an increased focus on the need to identify patients at higher risk for 30-day readmissions to allow for targeted interventions.
Research suggests there are multiple patient, environmental, clinical, provider, and system related factors associated with early readmissions.5–8 However, the readmission problem is fundamentally different in surgical patients with an invasive procedure that itself carries substantial and unique risks such as infections and pain. Pain experienced by patients may reflect surgical complications and/or inadequate or difficult symptom management. Uncontrolled pain could negatively affect quality of life and potentially lead to read-missions.9 Postoperative pain is one of the most commonly reported reasons for postoperative readmissions2,10 with 10% to 19% of readmissions due to pain.11,12
Although pain is an expected part of recovery after surgery,13 postoperative pain remains a challenge to manage.14 Most studies examining the association of pain and readmissions use simplified single time points or average measures of pain. However, pain is a continuum reflecting a complex interplay of symptoms, treatment and patient perception. Pain scores are captured at multiple time points postsurgery and can vary greatly throughout the inpatient stay.15 Oversimplification of postoperative pain scores could lead to the loss of key information on how postoperative pain was managed and if there is potential to intervene based on different pain trajectories. A few studies have examined postsurgical pain trajectories using questionnaires and electronic health records (EHRs)16–19; however, no study has categorized the types of trajectories or their association with key surgical outcomes with the intention to identify patients at high risk for readmission before they are discharged. This study aims to fill in the gap by characterizing inpatient postoperative pain trajectories and to investigate their association with 30-day readmissions and emergency department (ED) visits.
METHODS
Using a retrospective cohort study design, we identified patients undergoing surgeries within the Veterans Affairs (VA) Health Care System from October 1, 2007 through September 30, 2014. Patients undergoing inpatient surgeries with a 2-day postoperative length of stay or greater in the general, vascular, or orthopedic specialties who were discharged alive to either a community or a subacute care setting were included in this analysis. Patients were excluded from the analysis if they had <2 postoperative pain assessments during their hospital stay or if there was evidence of postoperative complications before discharge due to their potential confounding of postoperative pain. This study was reviewed and approved by the VA Central Institutional Review Board with a waiver of informed consent.
Data Sources
Inpatient general, vascular, and orthopedic surgeries were identified from the VA Surgical Quality Improvement Program data (VASQIP). These specialties perform the most common inpatient procedures in the VA Health Care System, and the cohort was limited to these to reduce variation seen when including all surgical specialties. The VASQIP data are nurse abstracted and contain detailed preoperative and intraoperative characteristics along with 30-day postoperative complications.20 Additional patient demographics (sex, race/ethnicity, and marital status), comorbidities, vital signs, and health care utilization were obtained from the VA Corporate Data Warehouse (CDW) along with all measurements of postoperative pain from the CDW Vital Signs domain. The CDW inpatient and outpatient domains were used to identify histories of mental health and pain diagnoses before the hospital admission as well as postoperative inpatient admissions. The CDW outpatient domains were also queried for preoperative outpatient visits to the pain clinic in the 6 months preceding hospital admission and postdischarge ER visits as a secondary outcome (Supplemental Table 1, http://links.lww.com/SLA/B270).
Lastly, the presence of pain medications prescription at the time of admission and the number and type filled within 3 days of discharge were identified by VA drug class in the Bar Code Medication Administration (BCMA) data stored within CDW. Medication names, dosing, and day supply were identified from the BCMA data. The cumulative daily dose of opioid medications was calculated as oral morphine equivalents (OMEs).21–23
Variables
The main exposure of interest was the categorical postoperative pain trajectory. Postoperative pain trajectories were estimated using repeated measurements throughout the preoperative and postoperative period. All patient-reported pain scores were obtained directly from the EHR as recorded during the index hospital stay.
The main outcome of interest is the occurrence of a 30-day unplanned readmission after hospital discharge. Unplanned inpatient readmissions were identified using inpatient stays and excluding CMS-defined planned admissions after hospital discharge. Unplanned readmissions were categorized as pain-related if the ICD-9 readmission code included a pain-related diagnosis (Supplemental Table 1, http://links.lww.com/SLA/B270). Secondary outcomes include postdischarge ER visits and postdischarge complications within 30 days of surgery. Postdischarge complications were defined as VASQIP-identified postoperative complications occurring after hospital discharge.
Covariates of interest include preoperative, intraoperative, and postoperative characteristics previously described for this cohort.2 Inpatient ICD9 diagnosis codes in the 6 months before hospital admission were also queried for a history of pain-related diagnoses (Table 1 or Supplement 1, http://links.lww.com/SLA/B270).
TABLE 1.
Patient Demographics and Preoperative Characteristics
| Pain Trajectory Groups |
||||||||
|---|---|---|---|---|---|---|---|---|
| Overall | 1 | 2 | 3 | 4 | 5 | 6 | ||
| n | % | Low | Mild > Low | Mild | Moderate > Low | Moderate | High | |
| Overall, % | 211,231 | 4.5% | 9.0% | 15.3% | 12.1% | 40.2% | 18.9% | |
| Specialty | ||||||||
| General | 78,168 | 37.0 | 52.5 | 53.9 | 42.2 | 47.2 | 32.3 | 24.5 |
| Vascular | 37,167 | 17.6 | 24.5 | 21.6 | 19.0 | 21.6 | 16.5 | 12.6 |
| Orthopedic | 95,896 | 45.4 | 23.0 | 24.5 | 38.8 | 31.2 | 51.2 | 62.9 |
| Demographics | ||||||||
| Age, yrs, mean (SD) | 64.0 (11.1) | 72.1 (10.7) | 69.4 (10.8) | 66.1 (10.7) | 66.5 (11.2) | 62.7 (10.5) | 59.1 (10.1) | |
| Sex, % | ||||||||
| Female | 11,662 | 5.5 | 1.9 | 2.8 | 4.7 | 3.9 | 6.2 | 8.0 |
| Male | 199,569 | 94.5 | 98.1 | 97.3 | 95.3 | 96.1 | 93.8 | 92.0 |
| Race/ethnicity, % | ||||||||
| White | 164,864 | 78.0 | 76.0 | 78.3 | 78.9 | 79.6 | 78.7 | 75.3 |
| Black | 34,392 | 16.3 | 18.9 | 16.0 | 15.2 | 14.7 | 15.5 | 19.3 |
| Other | 11,975 | 5.7 | 5.2 | 5.7 | 5.8 | 5.6 | 5.8 | 5.5 |
| Social/behavioral factors, % | ||||||||
| Body mass index, mean (SD) | 28.9 (6.0) | 27.0 (5.7) | 27.9 (5.8) | 28.8 (6.0) | 28.7 (5.9) | 29.3 (6.0) | 29.3 (6.1) | |
| Marital status, % | ||||||||
| Married | 99,054 | 46.9 | 45.1 | 48.1 | 48.6 | 48.8 | 48.0 | 42.0 |
| Other | 112,013 | 53.1 | 54.9 | 51.9 | 51.4 | 51.2 | 52.0 | 58.0 |
| Prior ER visits within 6 mo, mean (SD) | 0.8 (1.8) | 0.9 (1.7) | 0.8 (1.6) | 0.7 (1.6) | 0.8 (1.5) | 0.8 (1.7) | 1.1 (2.4) | |
| Prior inpatient admissions within 6 mo, | 0.8 (2.3) | 0.9 (2.1) | 0.8 (2.1) | 0.7 (2.0) | 0.8 (2.0) | 0.8 (2.3) | 1.1 (2.8) | |
| mean (SD) | ||||||||
| Depression diagnosis, % | 36,549 | 17.3 | 9.5 | 10.3 | 13.5 | 13.1 | 18.5 | 26.2 |
| Bipolar disorder diagnosis, % | 4,715 | 2.2 | 1.2 | 1.1 | 1.6 | 1.5 | 2.3 | 3.9 |
| Psychosis diagnosis, % | 4,226 | 2.0 | 3.3 | 2.5 | 1.9 | 1.9 | 1.8 | 2.3 |
| Preoperative comorbidities, % | ||||||||
| ASA Classification, % | ||||||||
| 1–3 | 184,959 | 87.6 | 76.2 | 83.1 | 86.3 | 86.3 | 89.5 | 90.2 |
| >3 | 26,237 | 12.4 | 23.8 | 16.9 | 13.7 | 13.8 | 10.5 | 9.8 |
| Hypertension requiring medication, % | 148,875 | 70.5 | 76.4 | 74.7 | 72.1 | 72.9 | 69.5 | 66.3 |
| Diabetes mellitus, % | ||||||||
| No | 156,138 | 73.9 | 68.0 | 71.4 | 73.5 | 72.6 | 75.0 | 75.5 |
| Yes | 55,093 | 26.1 | 32.0 | 28.6 | 26.5 | 27.4 | 25.0 | 24.5 |
| DNR status, % | 3,531 | 1.7 | 3.9 | 2.5 | 1.9 | 1.7 | 1.3 | 1.3 |
All results are statistically significant at P< 0.001.
Statistical Analysis
Univariate characteristics of all pain scores recorded throughout the hospital stay were described using means and medians, and examined for normality. Group-based modeling of longitudinal data was then used to develop pain trajectories using an exploratory analysis in PROC TRAJ in SAS v9.4.24 Although the maximum postoperative length of stay is set at 30 days within the VA, 80% of patients had postoperative lengths of stay of 2 to 7 days, therefore times for the trajectory analysis were centered at discharge to control for varying lengths of postoperative stay in the cohort. Potential numbers of trajectories were determined by selecting the number of groups in which at least one slope parameter (linear, quadratic, or cubic) was significantly different from 0. The final number of trajectories was chosen based off of the Bayesian Information Criterion and visual inspection of the resulting trajectories. Once determined, pain trajectory groupings were visualized using R GGPLOT2 as smoothed plots.25
Patients were categorized into 1 of the 6 determined pain trajectories and bivariate frequencies were used to examine characteristics of the patients by pain trajectory. Chi-square test statistics were used to examine differences in categorical variables and ANOVA was used to examine differences in continuous variables. Preoperative self-reported pain and preoperative history of pain diagnoses and pain clinic visits were also examined across pain trajectories.
Logistic regression was used to examine the association of postoperative pain trajectory with each outcome—30-day unplanned readmission, pain-related unplanned readmission, ER visit, or post-discharge surgical complication. Unadjusted models were first entered and then multivariate models using the previously described set of readmission predictors were used to obtain a final adjusted odds for each outcome by pain trajectory category.2 The resulting adjusted odds ratios were presented as a forest plot to better visualize trends across the pain trajectories. All analyses were completed using SAS v9.4 and an alpha of 0.05 was considered statistically significant throughout the analysis.
RESULTS
We identified 211,231 unique surgeries among 179,218 patients in 121 VA Medical Centers occurring between 2007 and 2012. Most surgical procedures were orthopedic (45.4%) followed by general (37.0%) and vascular specialties (17.6%). The cohort was 94.5% male, average age 64.0 (SD 11.1), and had multiple comorbidities, including hypertension (70.5%), smoking (32.4%), and insulin-dependent diabetes (11.8%) (Table 1 and Supplement Table 1, http://links.lww.com/SLA/B270).
Based on a pain scale of 0 to 10, low pain was defined as 0 to 2, mild pain as 2 to 4, moderate pain as 4 to 6, and high pain as >6. After trajectory analysis, we identified 6 groupings of inpatient postoperative pain. These categories were 4.5% consistently low (group 1), 9.0% starting mild and moving to low (group 2), 15.3% consistently mild (group 3), 12.1% starting moderate and moving to low (group 4), 40.2% consistently moderate (group 5), and 18.9% consistently high (group 6; Fig. 1). Patient characteristics across pain trajectory groupings varied drastically (Table 1). Patients in the lowest pain grouping (group 1) were older (mean 72.1 yrs, SD 10.7, P < 0.001), more likely partially or totally dependent (21.6%, P < 0.001), more likely to have hypertension (76.4%, P < 0.001), and more likely to have a general (52.5%) or vascular surgery (24.5%). Patients in the highest pain grouping (group 6) were younger (mean 59.1 yrs, SD 10.1), more likely to be of independent functional status (90.3%, P < 0.001), more likely to have a history of depression (26.2%, P < 0.001), and more likely to be a current smoker (43.3%, P < 0.001). They were also more likely to undergo orthopedic procedures (62.9%, P < 0.001; Table 1).
FIGURE 1.
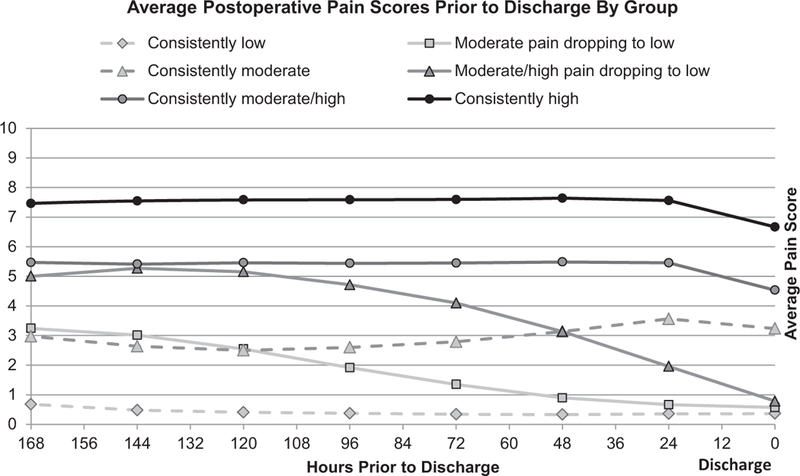
Average pain scores stratified by pain trajectories.
When comparing operative characteristics and outcomes, patients in the lowest pain group (group 1) had higher ASA classifications and longer postoperative lengths of stay (mean 9.5 d, SD 5.8, P < 0.001), whereas patients in the highest trajectory (group 6) had the shortest postoperative lengths of stay (mean 5.0 d, SD 3.6, P < 0.001) and were more likely to have a clean wound classification (72.3%, P < 0.001). In unadjusted analyses, patients in the lowest pain trajectory (group 1) had the highest readmission rates (13.0%, P <0.001) but lowest postdischarge complication rates (3.9%, P < 0.001). Patients in the highest pain trajectory (group 6) had the highest rates of pain-related unplanned readmission, whereas patients in the mild pain categories (groups 2 and 3) saw the highest postdischarge complication rates regardless whether the pain remained mild through discharge (4.9%, P < 0.001) or dropped to low before discharge (4.9%, P < 0.001; Table 2).
TABLE 2.
Operative Characteristics and Outcomes
| Pain Trajectory Groups |
||||||||
|---|---|---|---|---|---|---|---|---|
| Overall | 1 | 2 | 3 | 4 | 5 | 6 | ||
| n | % | Low | Mild > Low | Mild | Moderate > Low | Moderate | High | |
| Overall, % | 211,231 | 4.5 | 9.0 | 15.3 | 12.1 | 40.2 | 18.9 | |
| Operative characteristics | ||||||||
| Emergency case, % | 17,620 | 8.3 | 13.8 | 11.5 | 7.7 | 10.0 | 7.4 | 7.0 |
| Work RVU, units, mean (SD) | 19.8 | (7.2) | 19.6 (8.3) | 20.1 (7.7) | 20.6 (7.6) | 19.4 (7.4) | 19.8 (6.9) | 19.1 (6.7) |
| Total operation time, h, mean (SD) | 2.5 | (1.5) | 2.5 (1.7) | 2.6 (1.6) | 2.6 (1.5) | 2.4 (1.4) | 2.5 (1.4) | 2.3 (1.3) |
| Length of postoperative hospital stay, d, mean (SD) | 5.6 | (4.0) | 9.5 (5.8) | 6.8 (4.1) | 5.9 (4.2) | 5.2 (3.3) | 5.1 (3.6) | 5.0 (3.6) |
| Intraoperative RBC units transfused, % | ||||||||
| None | 198,361 | 93.9 | 89.9 | 91.7 | 92.6 | 94.1 | 94.6 | 95.3 |
| ≥1 | 12,870 | 6.1 | 10.1 | 8.3 | 7.4 | 5.9 | 5.4 | 4.7 |
| Wound classification, % | ||||||||
| Clean | 136,017 | 64.4 | 46.8 | 49.8 | 61.2 | 57.7 | 69.2 | 72.3 |
| Other | 75,214 | 35.6 | 53.2 | 50.2 | 38.8 | 42.3 | 30.8 | 27.7 |
| Discharge destination, % | ||||||||
| Community | 184,857 | 87.5 | 85.6 | 89.2 | 88.3 | 90.4 | 87.6 | 84.6 |
| Subacute care | 26,374 | 12.5 | 14.5 | 10.8 | 11.7 | 9.6 | 12.5 | 15.4 |
| Thirty-day outcomes | ||||||||
| Readmission, % | 22,727 | 10.8 | 13.0 | 11.5 | 11.0 | 10.0 | 10.1 | 11.5 |
| Days to first readmission, mean (SD)* | 11.6 | (8.3) | 12.0 (8.2) | 11.6 (8.0) | 11.4 (8.3) | 11.5 (8.2) | 11.7 (8.4) | 11.8 (8.2) |
| Days to first ER visit, mean (SD)* | 10.7 | (8.4) | 11.1 (8.6) | 10.4 (8.1) | 10.6 (8.4) | 10.4 (8.2) | 10.7 (8.4) | 10.9 (8.5) |
| Pain-related readmission, % | 3,125 | 1.5 | 0.7 | 0.9 | 1.1 | 1.1 | 1.6 | 2.4 |
| ER utilization only, % | 18,328 | 8.7 | 7.4 | 7.6 | 8.1 | 8.3 | 8.6 | 10.3 |
| Any complication postdischarge, % | 9,304 | 4.4 | 3.9 | 4.9 | 4.9 | 4.5 | 4.2 | 4.3 |
All results are statistically significant at P < 0.001 unless otherwise noted.
P < 0.05.
Pain characteristics and pain medication use are shown in Table 3. Preoperative and postoperative pain assessments as well as the number of preoperative pain diagnoses were positively associated with identified pain trajectory. Within the past 6 months before admission, 28.3% of the sample had evidence of opioid prescriptions with 49.5% of patients in the highest pain trajectory having opioids on hand at the time of admission. Sixty-six percent of patients were discharged with opioids in an average of 340.4 OME (SD 428.6; Table 3).
TABLE 3.
Pain Characteristics and Opioid Use
| Pain Trajectory Groups |
||||||||
|---|---|---|---|---|---|---|---|---|
| Overall | 1 | 2 | 3 | 4 | 5 | 6 | ||
| n | % | Low | Mild > Low | Mild | Moderate > Low | Moderate | High | |
| Overall, % | 211,231 | 4.5 | 9.0 | 15.3 | 12.1 | 40.2 | 18.9 | |
| Self-reported pain, median (IQR) | ||||||||
| Preoperative pain assessments | ||||||||
| Closest to operation | 3 | (6) | 0 (1) | 1 (4) | 1 (4) | 3 (5) | 4 (5) | 6 (5) |
| Postoperative pain assessment | ||||||||
| Closest to operation | 4 | (7) | 0 (1) | 1 (4) | 2 (4) | 3 (6) | 5 (5) | 7 (3) |
| Highest inpatient | 8 | (3) | 5 (6) | 6 (4) | 7 (2) | 7 (4) | 8 (2) | 10(1) |
| Last before discharge | 2 | (5) | 0 (0) | 0 (0) | 2 (4) | 0 (0) | 3 (4) | 5 (4) |
| Absolute change from preoperative to discharge | –1 | (5) | 0 (1) | 0 (4) | 0 (4) | –3 (5) | –1 (5) | –1 (5) |
| Preoperative pain clinic visits | ||||||||
| Any pain clinic visit (6 mo preoperative), % 7,599 | 3.6 | 1.0 | 1.4 | 2.4 | 2.1 | 3.9 | 6.6 | |
| Preoperative pain diagnoses (6 mo history) | ||||||||
| Any pain diagnosis, % | 80,828 | 38.3 | 28.0 | 31.1 | 34.3 | 34.0 | 39.3 | 47.9 |
| Medications on hand at admission Drug class, % | ||||||||
| Opioid | 59,780 | 28.3 | 8.7 | 11.3 | 18.7 | 16.9 | 31.3 | 49.5 |
| Nonopioid | 5,951 | 2.8 | 2.8 | 2.6 | 2.7 | 2.3 | 2.9 | 3.2 |
| NSAIDs | 27,496 | 13.0 | 5.1 | 6.4 | 10.7 | 9.3 | 14.9 | 18.2 |
| Medications filled on or within 2 d of discharge | ||||||||
| Total OME on discharge, mean (SD) | 340.4 | (428.6) | 133.1 (350.0) | 190.9 (380.2) | 315.0 (513.8) | 277.9 (591.1) | 428.5 (761.3) | 609.4 (1140.2) |
| Drug class, % | ||||||||
| Opioid | 140,190 | 66.4 | 40.1 | 54.7 | 67.6 | 64.4 | 70.1 | 69.7 |
| Nonopioid | 7,485 | 3.5 | 3.9 | 3.4 | 2.9 | 3.2 | 3.5 | 4.4 |
| NSAIDs | 4,601 | 2.2 | 1.2 | 1.5 | 2.0 | 1.8 | 2.4 | 2.7 |
After adjusting for patient and operative characteristics across pain trajectories, we found a significant dose-dependent effect with increasing inpatient postoperative pain trajectory and both unplanned readmission and pain-related readmission. This trend was most prominent among pain-related readmissions with patients in the highest pain trajectory (group 6) 4.1 times more likely to experience a pain-related readmission as compared with patients in the lowest pain trajectory (group 1, P < 0.001) (Fig. 2).
FIGURE 2.
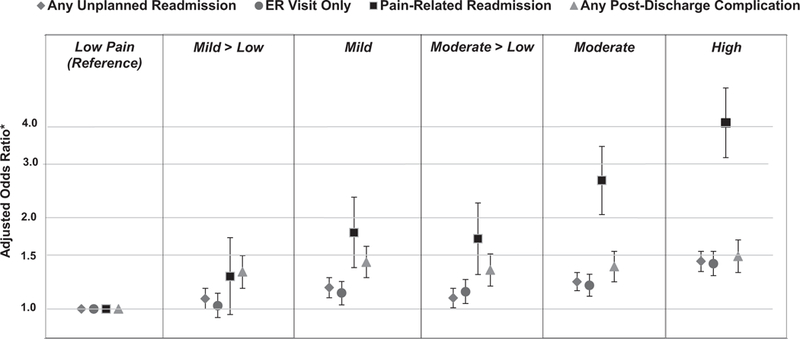
Association between pain trajectories and outcomes. *Adjusted for preoperative ER utilization, surgical specialty, postoperative BUN, operative time, VA facility, wound classification, postoperative hematocrit, ASA classification, preoperative functional status, preoperative inpatient admissions, postoperative sodium, preoperative albumin, preoperative disseminated cancer, history of depression or psychosis, preoperative calcium, postoperative WBC, preoperative bleeding disorders, diabetes, history of COPD, postoperative pulse, history of stroke, prior cardiac surgery, steroid usage, postoperative protime, preoperative WBC, history of PVD, preoperative dyspnea, discharge destination, history of TIA, nonopioid medications on hand at admission and filled at discharge, and opioid medications on hand.
DISCUSSION
In this study examining a heterogeneous cohort of inpatient surgical procedures, we identified 6 distinct inpatient pain trajectories that ranged from consistently low pain to consistently high pain. We found a “dose-response” relationship with 3 outcomes of interest: 30-day unplanned readmissions, 30-day subsequent ED visits, and 30-day pain-related readmissions. These results suggest that patients at high risk for both inpatient readmissions and subsequent ED visits can be identified by their inpatient pain trajectory after inpatient surgery. Our study can identify 2 pathways to improve patient care. First, these data highlight the importance of controlling pain during the perioperative period; through appropriate pain management, it could be possible to reduce patients’ risk for postoperative readmissions. Second, if surgical patients exhibit a high pain trajectory, additional monitoring and follow-up could avoid a readmission or subsequent ED visits.
Our results build on past studies that have documented the importance of using pain trajectories to improve postoperative care.16–19 These works highlight the need to obtain repeated pain measures throughout the inpatient stay to better understand pain resolution (or lack thereof). Similarly, our work demonstrates the importance of postoperative pain resolution through its association with postdischarge utilization, in particular pain-related readmissions, which accounted for 7.6% of all ED and inpatient readmissions. Others have examined the association between pain trajectories and unplanned consultations.26 In our surgical cohort, we also show that patients with persistent pain throughout their inpatient stay were more likely to have any unplanned readmission or subsequent ED visits. This growing body of evidence suggests trajectories indicating persistent or unresolved pain during the inpatient stay can be used for both pain management and outcomes research. Our study expands on these results by leveraging pain measurements throughout the inpatient stay and categorizing patients by their pain trajectories, which we show to be significantly associated with important postoperative outcomes. Rapid learning decision support systems can be developed to provide clinicians visualized display based on accumulated pain scores. Clinicians can assess these trajectories before patients are discharged and ascertain risk of readmissions. Based on trajectory evaluations, clinicians can ensure additional processes of care such as early follow-up visit, adequate pain management, and other prophylactic treatments are initiated to avoid readmissions of patients at higher risk.
Classifying patients according to their inpatient pain trajectory identified 6 categories; however, there were 2 categories of patients with distinct characteristics and outcomes. Patients classified into the low pain trajectory were older with more comorbidities than patients in the other trajectories. They had fewer opioids on hand before surgery, fewer opioids at discharge, and had the lowest rates of pain-related readmissions or postdischarge complications compared with patients in all other trajectories. These patients also had significantly longer hospital stays compared with other patients. It is likely that these older patients either experience less pain or increased pain relief from medications compared with the younger adults.27,28 It is likely that these patients are desensitized to pain as they are an older population with higher ASA, as recent systematic review has suggested.29 In addition, their longer hospital stay could allow for more opportunities to intervene, potentially reducing their risks for post-discharge complications. Patients in the high trajectory were young, single, with high rates of depression and preadmission pain-related diagnoses. These patients had the highest rates of both opioids on hand and opioids at discharge. Not surprisingly, these patients were 4 times more likely to have a subsequent pain-related readmission and had a 50% increased risk of any other readmission or subsequent ED visits. They also had the shortest postoperative length of stay. Our data suggest that using pain trajectories, one can identify these patients at significant risk for unplanned readmissions and subsequent ED visits, and highlight opportunities to intervene before discharge.
Pain scores are routinely collected as the “fifth vital sign” to aid pain management.30–32 However, the clinical utility of pain scores as a static representation of pain has repeatedly been questioned because patients’ pain varies and pain scores reflect symptoms, not a sign. As such this measure is difficult to calibrate between patients and lacks reliability.33–35 As the country faces an opioid epidemic, the American Medical Association is considering the removal of pain as a vital sign as it is believed to foster an environment encouraging opioid prescribing.36,37
As our nation currently faces the devastating effects of an opioid epidemic, prescription opioids, in particular those prescribed after surgery,38 are under enormous scrutiny and thought to be one major contributing factor to the opioid epidemic.39 Opioids analgesics were once encouraged by professional societies to address concerns of undertreatment of pain.40 However, today national efforts focus on limiting and reducing pain medications at discharge due to the extent of the opioid epidemic.41
In our study, 3 outcomes of interest—30-day unplanned readmissions, 30-day subsequent ED visits, and 30-day pain-related readmissions—were associated with pain trajectories in a dose— response manner, clearly highlighting high risk trajectories. Although patients in the lowest pain trajectory did have the lowest rates of postoperative complications, patients in the mild-to-low and mild pain trajectory had the highest rates of complications, followed by those in the moderate-to-low, moderate, and high trajectories, respectively. These findings highlight that the relationship between postoperative pain trajectories and readmission is not likely to be mediated through the development of postdischarge complications. Of all readmissions, 14% were pain-related readmissions. This is a small but significant number of patients returning to the system due to pain management issues. With proper pain management, these readmissions can be avoided. This suggests that pain-related readmissions represent a unique category of readmission reasons not currently assessed by VASQIP and other quality assessment programs.
Several limitations should be considered in interpreting our results. First, our study cohort was drawn from the national Veterans Affairs patient population and therefore our results may not be generalizable to other populations. However, our study includes over 11,000 women from 121 centers, therefore this population is broad and consists of a large national cohort. In addition, the VA population is known to have high rates of drug dependence, depression, and posttraumatic stress disorder (PTSD), conditions which may affect both pain management and opioid tolerance.42–44 The data analyses include both on-hand opioids and important comorbidities (eg, depression and PTSD) in an attempt to control for these confounding factors. Using patient-reported pain scores has limitations. Pain scores reflect symptoms and not a vital sign that could be standardized across patients. Furthermore, it was beyond the scope of this paper to adjust for the temporal relationships between the pain score and pain medication administration during the hospitalization.
CONCLUSIONS
EHRs collect continuous and granular clinical data that can be used to better understand patient pathways and identify actionable information. Leveraging the vast amount of information available in the VA Healthcare System, we characterize postoperative pain trajectories that identify populations at risk for 30-day readmissions and subsequent ED visits. Addressing pain control expectations before discharge may help reduce surgical readmissions in high pain categories. Further work is needed to understand if interventions can change a patient’s trajectory which could lead to significant improvements in their postoperative health care utilization.
DISCUSSANTS
Dr Clifford Y. Ko (Los Angeles, CA):
Thank you, and good afternoon everyone. The authors are to be congratulated for this rigorously performed and insightful study. Mary, this is really a testament to you for your leadership and mentorship for these studies. It seems like every year you are presenting something here at this meeting, so congratulations.
For the audience, we should recognize that this study is a great example for a number of things. First, it involves the use of big data. We always hear about big data, but this study puts together a lot of separate data sources, including the VA’s VASQIP registry, and the data warehouse that is in the VA system that gives you inpatient data, outpatient data, as well as the patient level medication profiles. Putting all of these data sources together is a huge effort; cleaning the data, and the doing the analytics is also impressive. The methodological aspect is definitely something that should be appreciated about this work.
In terms of the investigative aspects, the big data in this sense gives us a higher degree of insight into the care that is being provided. The multiple data sources add to the perspectives gain by a single source, and thus we are able to gain a more complete picture of the issue.
Finally, it is very important that this study looks at 2 issues on which we are all focusing in clinical care, and also 2 aspects that we are being measured. These are pain and readmission. In this regard, this study is topical and relevant.
I have a number of questions, Mary, I hope you have a pen. Number 1, how should we define and rate pain? More specifically, things like timing are important; for example, was the pain recorded before or after the administration of pain medication? We always see the pain score that nurses write down, but do not have the clinical context. You have addressed that by having these trajectories. But as we are taking care of a patient, what is an easy way of using trajectories if we do not have a computer on hand to give us these curves? How do we define pain, and how do we know what trajectory they are in?
Number 2, it is interesting to see which characteristics in your study were associated with the lowest pain threshold. For example, high comorbidity or an ASA >3, higher age, and worse functional status. And then by specialty, the lowest trajectory tended to be the general and vascular patients versus orthopaedics. Then, the data show that the lowest trajectory pain patients tended to have the lowest readmissions. So, putting it all together, it is a little difficult to figure out that the highest comorbidity, the oldest patients, had also the lowest readmission. Why do you think that is?
Third, we always talk about mutability. If we are thinking that the lowest pain trajectory has the lowest readmission, and we are all trying to have low readmissions, what mutable things can we do to get patients into the lowest pain trajectory? For example, a lot of us are administering an enhanced recovery protocol. Are people doing that, are folks using TAP blocks or epidurals or the like? What things are being performed to put patients into the lowest pain trajectory?
My last question is about the opioid epidemic. We are being told that there is an opioid epidemic, and yet when we measure and ask providers to perform this fifth vital sign, we see that everyone usually has some level of pain which then results in providers usually giving more opiates. So how do we then reconcile this fifth vital sign? Getting more pain, being patient centered, and so on—all of these things that we are supposed to be doing and yet we are now faced with the opioid epidemic. What should we do? Thanks very much and, again, congratulations.
Response From Dr Mary T. Hawn (Stanford, CA):
Thank you, Dr Ko, for your very insightful comments. The first question had to do with what is the best way to measure pain. Using pain scores, we call it a vital sign, but it is not really a vital sign, right? It is not an objective measure like blood pressure. It is very subjective and not really reproducible maybe even within the same patient and let alone across patients. I agree that it is a limitation of this, but it is kind of the data we have at our fingertips.
So how would we identify these patients? I think we all kind of know them. They are the patients who come to clinic with a pain score of 8, and they are the patients who have very high pain scores throughout their hospitalization. When we looked at it and we broke it down, if you looked at their highest pain score, their immediate postoperative pain score, their immediate predischarge pain score, they were always high or in the high group. It did not look like they were vacillating that much.
The other thing that we noticed is that they had many more pain scores measured in the high pain trajectory suggesting that they were requiring more treatment and remeasurement.
The second question was why did we not see as many readmissions in the low pain threshold category? We found that intriguing, too, because we did also think they were at the highest risk because they were the most comorbid patients. They had almost double the indexed length of stay as patients in the high pain trajectory. I think that many of their postsurgical complications happened before discharge. We were only looking at complications that happened after discharge, so I think that is why we had that observation.
So what could we do differently? We were even having trouble identifying who had epidurals and PCAs in this data set. It turns out it is not recorded in a very consistent fashion nor is the amount of medication they got through those vehicles recorded. So that is a big limitation. We looked at the amount of narcotics and whether multimodal therapy was given; however, it was <5% of the cases.
That gets to question number 4. What do we do with the opioid epidemic? For these types of patients, I think we need to get our colleagues, our pain specialists involved much quicker. It does not look like giving more pain medication to treat a number is effective. I think we need to rethink that strategy of treating the number. There has been so much recent national attention to this that we will stop focusing on that number as a measure of quality of care and patient satisfaction. I think those are some trends we will see in the future. Thank you again for your questions.
Dr Thomas Tracy (Hershey, PA):
Mary, congratulations, and congratulations to your associates for this great work. I would push back a little bit on you dropping this as a vital sign because so many of us that are trying to handle this either in population health, or quality pay for performance, have to fight readmissions, and we are looking for some of the holy grail that might be found in inpatient care that would translate to postacute consequences.
So one of the questions that I have is if your data gave any insight as to whether the management of pain in these patients, especially with the difference between orthopedics and general and vascular surgery, was a surrogate of the kind of coordination of care that occurred on those services? Was there a way to determine if there was any way to tell, either using the comorbidity data or other data points, that on the ortho service, the reason that there was a low trajectory as well as low readmission is from a better coordinated system, maybe with pain protocols, as you alluded to, and others.
Then the second concern is that your data set does have some time space between 2008. This opiate concern is really important. I recently ran across a colleague who is at the Heller School for Social Policy at Brandeis who has the identified the trajectory of the opiate problem coincident with what the joint commission did to increase our pain management. Did you notice any difference from the early cohort of 2008 up until the more recent patients in terms of these observations? Thank you very much.
Response From Dr Mary T. Hawn (Stanford, CA):
Thank you for your comments. We are trying to look at the pain management by the different trajectories, and definitely we see more opioid use in the higher pain trajectories, whereas patients in the low pain categories did not seem to receive much in the way of opioids. But we feel pretty limited by some of the data as we do not have access to PCAs and epidurals. Again, we did not find much evidence of multimodal pain management.
I do not think we looked at the secular trend. So I think it would be an interesting thing to go back and assess this. In 2014, I still do not think the opioid epidemic was quite on our radar, but it is a good thing to go back and look at. Thank you for that comment.
Dr John Tarpley (Nashville, TN):
No conflicts of interest except, like a lot of the authors, I am a VA surgeon. I would like to make a comment or 2 and then have you comment on one other thing.
In the surgical oncology world, when we are not on the curative page but the quality of life and supportive care page, we focus on pain control and nonabandonment. Dr Sherry Wren at your Stanford program and Drs Kristy Kummerow Browman and Michael Vella at Vanderbilt and the Nashville VA utilize Telehealth as one way to abet communication and provide support. You addressed the predischarge discussions, but there is also this interval in the first week or 2, especially for vulnerable patients one identifies that Telehealth can thwart the perception by the patient that they are not being heard. They want and need more information. They may be feeling scared. At other times they provide information that warrants a sooner clinic visit than the scheduled next appointment downstream.
Please comment: Do you think that there is a role, perhaps an expanded role, for Telehealth to address your study’s findings? It can be done via telephone as Dr Wren demonstrated and need not require video. Telehealth utilizing the telephone can assuage some of the fears and clarify communications. Right now, we are in kind of a “treat ‘em and street ‘em” mode to increase “throughput.” We preform “drive by esophagectomies,” it seems; and we are to discharge them from hospital in a day or 2. One down side of our current practice mode is that people go home quite early; they may not be totally prepared or clear on instructions. We know what we say, but we do not know what they hear or what they understand. We often have communication or rather miscommunication issues.
Terrific paper. Thank you very much.
Response From Dr Mary T. Hawn (Stanford, CA):
Thank you very much for your comments, Dr Tarpley. I could not agree more. I could not agree more. I think, actually, we could be even move it upstream. We know who these patients are before we even bring them in the hospital. They are on opioids preoperatively. They have a high rate of pain at their initial clinic visit. They are being operated on for a pain-related indication. I think that is actually the point to start really talking to them about how we are going to get them through the perioperative period and control their pain, but that more narcotics is not always better. So I agree with you. Both preadmission and then postdischarge, all those could be used.
Dr Robert Cerfolio (Birmingham, AL):
Mary, congratulations. Actually, you just said what I was going to ask you. Isn’t it really preoperative pain, not postoperative we are talking about? So we looked at this and we identified these people along with 3 other factors and changed what we did preoperative and took our readmission from 8% and brought it down to <4% for pulmonary resection-not for esophagectomy that is clearly higher, but pulmonary resection. So I was surprised to see, even though you somewhat controlled for it not more analysis on preoperative pain medicines and other preoperative factors in your analysis.
Response From Dr Mary T. Hawn (Stanford, CA):
In the analysis, we adjusted for whether or not they were on preoperative pain medication. But there is a strong association with that pain trajectory. We also looked at their preadmission pain score because we had their vital signs going back to 6 months before admission.
Dr Robert Cerfolio (Birmingham, AL):
So I think the point is to learn something from the presentation. So would you agree that the learning point is, if it is an elective operation, to get on top of that for 2or 3 months through a pain clinic or something? Would you agree that that would be a way to drive down your readmission?
Response From Dr Mary T. Hawn (Stanford, CA):
I think so, even though many of these surgeries are not quite as elective—the orthopedic ones are—but when patients go to their preadmission clinic with anesthesia, their pain management could be addressed just like we address their other risk factors.
Dr David B. Adams (Charleston, SC):
Were you able to look at the preoperative pain score data and correlate that?
Response From Dr Mary T. Hawn (Stanford, CA):
Yes, we did look at preoperative pain score. It definitely correlates with the pain trajectories. The pain trajectories have a stronger correlation. When we looked at our model, it was the highest postoperative pain score that was the most predictive. That seemed more important than the preoperative, but there is a strong correlation between the 2.
Dr Hiram Polk (Louisville, KY):
Dr Hawn, this is a nice paper. I wonder if this is not the tip of the iceberg. I do have a conflict of interest. As commissioner of health in our state, we live in Ohio Valley which is just overrun with heroin overdoses. We came up with some fairly good methods, so- called KASPER, for dealing with opioid drugs, but I do not think anyone in our area realized how cheap street heroin would become.
Interestingly in our state, the commonest age group to die from a heroin overdose is age 45 to 54. Physicians in general have taken the blunt of this abuse in our state having said that we have tided these patients over onto drugs in a chronic sense for a long, long time. To some degree, that is true. We have recently had passed a law in which doctors cannot write prescriptions for more than 3 days. The good news, our department was able to modify that a lot where there are exceptions for major surgery, acute trauma, cancer, things like that.
But I do think there is a different warning with this, and it is far beyond ER and readmission things. It is what this has done to our population as a whole. I do not think there are some easy answers, but a lot of people believe that doctors, us, we, are at fault for at least part of this. We begin a kindergarten through grade 4 introduction to drugs, alcohol and tobacco in 70 primary schools in Kentucky in August 2017, but it will take a decade to really implement and another decade to begin to measure outcomes.
Response From Dr Mary T. Hawn (Stanford, CA):
Thank you, Dr Polk. I could not agree more, and I think there is a fair amount of data out there that shows that patients become addicted to opioids in a postoperative period. Patients who were not on opioids are given opioids at discharge, and there is a percentage of patients who then remain addicted.
Dr Carl I. Schulman (Miami, FL):
This is a great study but I wanted to crystallize some things that have been alluded to by other discussants.
I see your trajectories, and I see personalities. I do not necessarily see response to pain directly. And I think there is a large psychological component, obviously, to their perception to pain and how they perceive it. In our burn population, the anxiety related to their treatment exacerbates their perception of pain.
So one of the potentially useful things that could be considered would be psychology support. We have a full-time psychologist on the burn service that helps manage their expectations throughout their care and all the way to discharge. So, in other words, you have to manage the personality that perceives the pain. I think this might be something concrete and not a very expensive way to manage some of this.
Response From Dr Mary T. Hawn (Stanford, CA):
That is a great suggestion. You are right. It is not like hypertension where we give a drug and we see the vital signs change. They stay where they are regardless of treatment. Thank you very much.
Dr Lawrence Way (Corte Madera, CA):
Do you think that you might want to systemize the data collection in new ways that might influence its usefulness?
Response From Dr Mary T. Hawn (Stanford, CA):
Yes, actually, the VA was building a platform that could have real-time updates throughout the admission. The goal was to have a readmission risk prediction model that would be updated daily and start stratifying patients.
That was the initial purpose of this project; however, the VA has since abandoned adopting that platform. So we have our models, but we do not have a great way to incorporate them to be used real time. I do think that is where we all see the world going. And we do have some of these algorithms, especially early warning systems, that are running in the background within our electronic medical records. Developing automated triggers that are meaningful and do not lead to information overload will be useful in the future. Thank you
Supplementary Material
Acknowledgments
Funding: The research presented reflects the opinions of the authors and does not represent the opinions of the United States Department of Veteran Affairs. VA Health Services Research & Development Grant (IIR 12–358) supported this research. TH-B was supported by grant number R01HS024096 from the Agency for Healthcare Research and Quality. The content is solely the responsibility of the authors and does not necessarily represent the official views of the Agency for Healthcare Research and Quality. KD was supported from a TL1 Clinical Research Training Program of the Stanford Clinical and Translational Science Award to Spectrum (NIH TL1 TR 001084). TW is supported by an Agency for Healthcare Research and Quality grant T32 HS013852–13.
Footnotes
Disclosure: The authors report no conflicts of interest.
Supplemental digital content is available for this article. Direct URL citations appear in the printed text and are provided in the HTML and PDF versions of this article on the journal’s Web site (www.annalsofsurgery.com).
REFERENCES
- 1.Jencks SF, Williams MV, Coleman EA. Rehospitalizations among patients in the Medicare fee-for-service program. NEngl JMed. 2009;360:1418–1428. [DOI] [PubMed] [Google Scholar]
- 2.Morris MS, Graham LA, Richman JS, et al. Postoperative 30-day readmission: time to focus on what happens outside the hospital. Ann Surg. 2016;264:621 –631. [DOI] [PubMed] [Google Scholar]
- 3.Patient Protection and Affordable Care Act. Patient protection and affordable care act. Public Law. 2010;111:48. [Google Scholar]
- 4.Centers for Medicare and Medicaid Services. Readmissions reduction program. Available at: http://www.cms.gov/Medicare/Medicare-Fee-for-Service-Payment/AcuteInpatientPPS/Readmissions-Reduction-Program.html. Accessed April 2, 2017.
- 5.Jiang HJ, Boutwell AE, Maxwell J, et al. Understanding patient, provider, and system factors related to Medicaid readmissions. Jt Comm J Qual Patient Saf. 2016;42:115–121. [DOI] [PubMed] [Google Scholar]
- 6.Auerbach AD, Kripalani S, Vasilevskis EE, et al. Preventability and causes of readmissions in a national cohort of general medicine patients. JAMA Intern Med. 2016;176:484–493. [DOI] [PMC free article] [PubMed] [Google Scholar]
- 7.Kansagara D, Englander H, Salanitro A, et al. Risk prediction models for hospital readmission: a systematic review. JAMA. 2011;306:1688–1698. [DOI] [PMC free article] [PubMed] [Google Scholar]
- 8.Merkow RP, Ju MH, Chung JW, et al. Underlying reasons associated with hospital readmission following surgery in the United States. JAMA. 2015;313: 483–495. [DOI] [PubMed] [Google Scholar]
- 9.Carr DB, Goudas LC. Acute pain. Lancet. 1999;353:2051 –2058. [DOI] [PubMed] [Google Scholar]
- 10.Coley KC, Williams BA, DaPos SV, et al. Retrospective evaluation of unanticipated admissions and readmissions after same day surgery and associated costs. J Clin Anesth. 2002;14:349–353. [DOI] [PubMed] [Google Scholar]
- 11.Adogwa O, Elsamadicy AA, Han JL, et al. 30-day re-admission after spine surgery: an analysis of 1400 consecutive spine surgery patients. Spine. 2016. July 7 Epub ahead of print. [DOI] [PubMed] [Google Scholar]
- 12.Groegaard B, Aasbø V, Raeder J. Admissions and readmissions from a unit of ambulatory surgery. Experiences after 2 411 surgical interventions. Tidsskr Nor Laegeforen. 1996;116:742–745. [PubMed] [Google Scholar]
- 13.Warfield C, Kahn C. Acute pain management programs in us hospitals and experiences and attitudes among US adults. J Am Soc Anesthesiol. 1995;83:1090–1094. [DOI] [PubMed] [Google Scholar]
- 14.Apfelbaum JL, Chen C, Mehta SS, et al. Postoperative pain experience: results from a national survey suggest postoperative pain continues to be undermanaged. Anesth Analg. 2003;97:534–540. [DOI] [PubMed] [Google Scholar]
- 15.Department of Veterans Affairs. Pain as the 5th vital sign toolkit. Veterans Health Administration. Published October 2000. Available at: https://www.va.gov/PAINMANAGEMENT/docs/Pain_As_the_5th_Vital_Sign_Toolkit.pdf. Accessed April 2, 2017.
- 16.Chapman CR, Donaldson GW, Davis JJ, et al. Improving individual measurement of postoperative pain: the pain trajectory. J Pain. 2011;12:257–262. [DOI] [PMC free article] [PubMed] [Google Scholar]
- 17.Tighe PJ, Le-Wendling LT, Patel A, et al. Clinically derived early postoperative pain trajectories differ by age, sex, and type of surgery. Pain. 2015;156:609. [DOI] [PMC free article] [PubMed] [Google Scholar]
- 18.Althaus A, Arranz Becker O, Neugebauer E. Distinguishing between pain intensity and pain resolution: using acute post-surgical pain trajectories to predict chronic post-surgical pain. Eur J Pain. 2014;18:513–521. [DOI] [PubMed] [Google Scholar]
- 19.Chapman CR, Zaslansky R, Donaldson GW, et al. Postoperative pain trajectories in cardiac surgery patients. Pain Res Treat. 2012;2012:608359. [DOI] [PMC free article] [PubMed] [Google Scholar]
- 20.Davis CL, Pierce JR, Henderson W, et al. Assessment of the reliability of data collected for the Department of Veterans Affairs national surgical quality improvement program. J Am Coll Surg. 2007;204:550–560. [DOI] [PubMed] [Google Scholar]
- 21.Von Korff M, Saunders K, Thomas Ray G, et al. De facto long-term opioid therapy for noncancer pain. Clin J Pain. 2008;24:521–527. [DOI] [PMC free article] [PubMed] [Google Scholar]
- 22.Nielsen S, Degenhardt L, Hoban B, et al. A synthesis of oral morphine equivalents (OME) for opioid utilisation studies. Pharmacoepidemiol Drug Saf. 2016;25:733–737. [DOI] [PubMed] [Google Scholar]
- 23.Maheshwari K, Cummings KC 3rd, Farag E, et al. A temporal analysis of opioid use, patient satisfaction, and pain scores in colorectal surgery patients. J Clin Anesth. 2016;34:661–667. [DOI] [PubMed] [Google Scholar]
- 24.Jones BL, Nagin DS, Roaeder K. A SAS procedure based on mixture models for estimating developtmental trajectories. Sociol Methods Res. 2001;29:374–393. [Google Scholar]
- 25.Wickham H GGPLOT2: Elegant GraphicsforDataAnalysis. New York, NY: Springer; 2009. [Google Scholar]
- 26.Warnock FF, Lander J. Pain progression, intensity and outcomes following tonsillectomy. Pain. 1998;75:37–45. [DOI] [PubMed] [Google Scholar]
- 27.Bellville JW, Forrest WH, Miller E, et al. Influence of age on pain relief from analgesics: a study of postoperative patients. JAMA. 1971;217:1835–1841. [PubMed] [Google Scholar]
- 28.Macintyre P, Jarvis D. Age is the best predictor of postoperative morphine requirements. Pain. 1996;64:357–364. [DOI] [PubMed] [Google Scholar]
- 29.Ip HY, Abrishami A, Peng PW, et al. Predictors of postoperative pain and analgesic consumption: a qualitative systematic review. Anesthesiology. 2009;111:657–677. [DOI] [PubMed] [Google Scholar]
- 30.Phillips DM. JCAHO pain management standards are unveiled. Joint Commission on Accreditation of Healthcare Organizations. JAMA. 2000;284:428–429. [DOI] [PubMed] [Google Scholar]
- 31.Phillips DM. JCAHO pain management standards are unveiled. Joint Commission on Accreditation of Healthcare Organizations. JAMA. 2000;284:428–429. [DOI] [PubMed] [Google Scholar]
- 32.Mularski RA, White-Chu F, Overbay D, et al. Measuring pain as the 5th vital sign does not improve quality of pain management. J Gen Intern Med. 2006;21:607–612. [DOI] [PMC free article] [PubMed] [Google Scholar]
- 33.Mularski RA, White-Chu F, Overbay D, et al. Measuring pain as the 5th vital sign does not improve quality of pain management. J Gen Intern Med. 2006;21:607–612. [DOI] [PMC free article] [PubMed] [Google Scholar]
- 34.Schiavenato M, Craig KD. Pain assessment as a social transaction: beyond the “gold standard”. Clin J Pain. 2010;26:667–676. [DOI] [PubMed] [Google Scholar]
- 35.Blumstein HA, Moore D. Visual analog pain scores do not define desire for analgesia in patients with acute pain. Acad Emerg Med. 2003;10:211–214. [DOI] [PubMed] [Google Scholar]
- 36.American Medical Association 2016 Annual Report. Published February 17, 2017. Available at: https://www.ama-assn.org/sites/default/files/media-brows-er/ama-annual-report-2016.pdf. Accessed April 2, 2017.
- 37.Gawande AA. It’s time to adopt electronic prescriptions for opioids. Ann Surg. 2017;265:693–694. [DOI] [PubMed] [Google Scholar]
- 38.Gawande AA. It’s time to adopt electronic prescriptions for opioids. Ann Surg. 2017;265:693–694. [DOI] [PubMed] [Google Scholar]
- 39.Murthy VH. Ending the opioid epidemic—a call to action. N Engl J Med. 2016;375:2413–2415. [DOI] [PubMed] [Google Scholar]
- 40.Baker S, McBeth J, Chew-Graham CA, et al. Musculoskeletal pain and co-morbid insomnia in adults: a population study of the prevalence and impact on restricted social participation. BMC Fam Pract. 2017;18:17. [DOI] [PMC free article] [PubMed] [Google Scholar]
- 41.Gugelmann HM, Perrone J. Can prescription drug monitoring programs help limit opioid abuse? JAMA. 2011;306:2258–2259. [DOI] [PubMed] [Google Scholar]
- 42.Edlund MJ, Steffick D, Hudson T, et al. Risk factors for clinically recognized opioid abuse and dependence among veterans using opioids for chronic non-cancer pain. Pain. 2007;129:355–362. [DOI] [PubMed] [Google Scholar]
- 43.Seal KH, Metzler TJ, Gima KS, et al. Trends and risk factors for mental health diagnoses among Iraq and Afghanistan veterans using Department of Veterans Affairs health care, 2002–2008. Am J Public Health. 2009;99:1651–1658. [DOI] [PMC free article] [PubMed] [Google Scholar]
- 44.Seal KH, Bertenthal D, Miner CR, et al. Bringing the war back home: mental health disorders among 103788 US veterans returning from Iraq and Afghanistan seen at Department of Veterans Affairs Facilities. Archf Intern Med. 2007;167:476–482. [DOI] [PubMed] [Google Scholar]
Associated Data
This section collects any data citations, data availability statements, or supplementary materials included in this article.