

Abstract
Objective
To evaluate plasma phosphorylated neurofilament heavy chain (pNF‐H) as a biomarker in spinal muscular atrophy (SMA).
Methods
Levels of pNF‐H were measured using the ProteinSimple® platform in plasma samples from infants with SMA enrolled in ENDEAR (NCT02193074) and infants/children without neurological disease.
Results
Median pNF‐H plasma level was 167.0 pg/mL (7.46–7,030; n = 34) in children without SMA (aged 7 weeks–18 years) and was higher in those aged < 1 versus 1–18 years (P = 0.0002). In ENDEAR participants with infantile‐onset SMA, median baseline pNF‐H level (15,400 pg/mL; 2390–50,100; n = 117) was ~10‐fold higher than that of age‐matched infants without SMA (P < 0.0001) and ~90‐fold higher than children without SMA (P < 0.0001). Higher pretreatment pNF‐H levels in infants with SMA were associated with younger age at symptom onset, diagnosis, and first dose; lower baseline Children's Hospital of Philadelphia Infant Test of Neuromuscular Disorders score; and lower peroneal compound muscle potential amplitude. Nusinersen treatment was associated with a rapid and greater decline in pNF‐H levels: nusinersen‐treated infants experienced a steep 71.9% decline at 2 months to 90.1% decline at 10 months; sham control–treated infants declined steadily by 16.2% at 2 months and 60.3% at 10 months.
Interpretation
Plasma pNF‐H levels are elevated in infants with SMA. Levels inversely correlate with age at first dose and several markers of disease severity. Nusinersen treatment is associated with a significant decline in pNF‐H levels followed by relative stabilization. Together these data suggest plasma pNF‐H is a promising marker of disease activity/treatment response in infants with SMA.
Introduction
Spinal muscular atrophy (SMA) is a severe autosomal recessive inherited disorder characterized by degeneration of alpha motor neurons and consequent muscle weakness.1 It is caused by biallelic loss‐of‐function mutations of the survival motor neuron 1 gene (SMN1). Embryonic lethality that would occur due to a complete absence of SMN protein is rescued by the presence of a variable number of copies of a paralogous gene, SMN2. However, the majority of SMN protein produced by SMN2 is only partially functional due to alternative splicing that mostly encodes a truncated transcript and protein.1 Nusinersen, the first approved treatment for SMA, acts to increase functioning SMN protein by altering SMN2 pre‐messenger RNA splicing to favor production of a full‐length form that encodes normal SMN protein.2, 3
Given the potential to significantly alter the disease course with treatment,4, 5 strategies to establish an early diagnosis, assess disease activity, and monitor treatment response have become key disease management priorities. Historically, diagnosis of SMA has generally followed development of symptomatic weakness, which varies in severity and manifests only after accrual of substantial pathology.1 Identification of biallelic SMN1 deficiency is followed by assessment of SMN2 copy number genotype, which is an important but imperfect predictor of untreated clinical course.1, 6 As a predictive genetic biomarker, SMN2 copy number is, along with other less sensitive measures under investigation, of no value as a marker of ongoing disease activity or response to treatment.7 Thus, there is now an urgent need for biomarkers of disease activity and treatment response to scale and monitor therapy, and to enable more efficient future clinical trial design.
Neurofilament (NF) proteins have been investigated as potential biomarkers for several disorders characterized by axonal injury and degeneration.8 These intermediate filaments are uniquely expressed in neurons, and when released into extracellular fluid upon perikaryal or axonal degeneration, can be detected in cerebrospinal fluid (CSF) and blood.8, 9 NFs comprise three proteins differentiated by molecular weight, light (NF‐L), medium, and heavy (NF‐H).8, 9 About 80% of axonal NFs are highly phosphorylated, conferring resistance to protein degradation.9, 10 Elevated concentrations of NF‐H have been detected in blood and/or CSF in disorders such as amyotrophic lateral sclerosis (ALS), multiple sclerosis (MS), Alzheimer's disease, and Parkinson's disease.8, 11, 12, 13, 14, 15, 16 Elevated concentrations of NF‐L have been documented in Alzheimer's disease, ALS, MS, Charcot‐Marie‐Tooth disease, and adult‐onset leukoencephalopathy with axonal spheroids and pigmented glia.8, 11, 12, 15, 16, 17, 18, 19, 20, 21 In the absence of specific disease‐modifying therapy, the value of NF elevations as a biomarker remains unclear.8
To determine the value of plasma phosphorylated NF‐H (pNF‐H) as a disease‐sensitive pharmacodynamic/response biomarker in SMA, we measured pNF‐H concentrations in sham control– and nusinersen‐treated infants with SMA enrolled in the ENDEAR trial compared with infants and children without SMA. Further, in the ENDEAR SMA cohort, we examined pNF‐H concentrations over time in sham control– and nusinersen‐treated participants, as well as the relationship between baseline pNF‐H concentration and pretreatment markers of disease severity.4
Methods
Study samples
ENDEAR participants
ENDEAR (NCT02193074) was a phase III, randomized, double‐blind, sham procedure–controlled study that assessed the efficacy and safety of nusinersen in participants with infantile‐onset SMA (aged < 6 months at symptom onset, with 2 SMN2 copies, and considered most likely to develop SMA Type I). As reported previously, participants aged ≤ 7 months at screening were randomized 2:1 to nusinersen (12 mg scaled equivalent dose) or sham control.4 Nusinersen was administered as a loading dose on days 1, 15, 29, and 64, followed by maintenance dosing every 4 months (on days 183 and 302). Baseline demographic and clinical data were collected, including Hammersmith Infant Neurological Examination Section 2 (HINE‐2) motor milestones score, Children's Hospital of Philadelphia Infant Test of Neuromuscular Disorders (CHOP INTEND) score, and peroneal and ulnar nerve compound muscle action potential (CMAP) amplitudes.4 Following a prespecified interim analysis that demonstrated a benefit‐risk assessment in favor of nusinersen, the trial was terminated early. All participants were invited to complete an end‐of‐trial visit, at which point 81 of the 121 individuals dosed had been on study for ≥ 183 days, and 48 had completed treatment to the day 302 visit.
Plasma samples were collected on days 1, 2, 29, 64, 183, and 302. Plasma was then extracted, and samples were stored frozen at −70°C then diluted at the minimum required using assay dilution buffer (available as part of the assay kit) prior to use.
Approval for the trial was provided by an ethics committee at each participating institution, and it was conducted in accordance with the International Conference on Harmonisation guidelines for Good Clinical Practice and the World Medical Association Declaration of Helsinki. Written informed consent for each participant was provided by their health care proxy.4
Individuals without SMA
pNF‐H testing was also conducted in samples from individuals without SMA or other neurodegenerative diseases. Twenty‐nine samples were from Boston Children's Hospital. Reasons for sample collection are not available due to confidentiality, but all samples were from individuals aged 1 day to 18 years, with International Statistical Classification of Diseases and Related Health Problems, 10th revision code(s) for a well‐child visit, with no known neurological or musculoskeletal disorders, no history of other chronic illness, normal values for hemoglobin A1c and complete blood count tests, and no other grossly abnormal laboratory values. A further five samples were purchased from Analytical Biological Services Inc. and were from healthy donors aged 4 to 17 years.
Dipotassium ethylenediaminetetraacetic acid plasma was collected and centrifuged at 3000 × g for 7 min, aliquoted into cryovials, frozen at −20°C, and shipped to Biogen on dry ice. Individual samples were not retested for the purposes of these evaluations.
pNF‐H measurement
pNF‐H concentrations in plasma were measured using a pNF‐H enzyme‐linked lectin assay from ProteinSimple® according to the manufacturer's instructions.22 The Simple Plex enzyme‐linked lectin assay performs immunoassays in a microfluidic cartridge. Samples are loaded into the cartridge wells and then run through a microfluidic channel containing three glass nanoreactors coated with a capture antibody against pNF‐H. Plates are washed and a detection reagent added that binds to pNF‐H and generates 1 relative fluorescence unit signal per glass nanoreactor. The relative fluorescence unit is used to interpolate the concentration from a factory‐generated and calibrated standard curve (5‐PL fit with 1/y2 weighting) and reported in pg/mL. The results presented are statistical means and do not imply that the assay is capable of the sensitivity or precision necessary to generate results > 3 significant figures.
Objectives and endpoints
The primary objectives were to assess plasma pNF‐H levels in individuals without SMA; using samples from ENDEAR, to compare baseline plasma pNF‐H levels with disease characteristics, including age at symptom onset, age at SMA diagnosis, age at first dose, gestational age, baseline weight, disease duration at baseline, baseline CHOP INTEND score, baseline HINE‐2 motor milestones score, and baseline ulnar and peroneal nerve CMAP amplitudes; and to compare plasma pNF‐H levels among individuals without SMA with those in the group with infantile‐onset SMA. Additional objectives were to evaluate longitudinal plasma pNF‐H levels and percentage change from baseline over time in the nusinersen and sham control treatment groups from ENDEAR.
Statistical analyses
The pNF‐H analysis population from ENDEAR comprised trial participants who were randomized and received ≥ 1 dose of either nusinersen or sham control. Baseline pNF‐H is defined as the most recent nonmissing measurement collected before the first dose or day 1. The pNF‐H concentration levels were log transformed for statistical testing based on the data distribution evaluated.
Summary statistics were used to analyze the data from individuals without SMA; the Wilcoxon rank‐sum test was used to compare levels by age (<1 vs. 1–18 years) in individuals without SMA, and baseline levels in participants with infantile‐onset SMA versus those without SMA. Spearman's rank correlation was used to assess the association between pNF‐H levels and age in individuals without SMA. Pearson correlation coefficients were used to evaluate associations between baseline pNF‐H and other baseline characteristics and SMA history. Median pNF‐H concentration was used to compare the baseline characteristics and clinical assessments between groups of participants with SMA with baseline pNF‐H lower and higher than the median pNF‐H value. For continuous variables, Student's 2‐sample t test was applied to test continuous values and Fisher's exact test was used for proportion values; 95% confidence intervals (CIs) for difference in continuous variables are derived from Student's 2‐sample t test. If the test on the equality of variance failed to reject the null hypothesis at alpha = 0.05, a pooled‐variance t test was applied; if the test on the equality of variance rejected the null hypothesis, Satterthwaite was applied. 95% CIs for the difference in proportion are the exact unconditional CIs.
To evaluate the pNF‐H change over time, both absolute pNF‐H and percentage change from baseline were summarized by treatment cohort at each time point. The percentage change from baseline was defined as: (change value from baseline/baseline value) × 100.
An imputed pNF‐H concentration of 7.46 pg/mL, the level of the assay sensitivity, was used for concentrations below the limit of quantification (BLQ). For participants with a baseline pNF‐H concentration that was BLQ, percentage change from baseline could not be determined and was denoted as “NA”. The linear mix model was applied to determine whether there was any difference in the change in pNF‐H values over time between the nusinersen‐ and sham control–treated groups; the analysis of variance test was used to determine the marginal effect of treatment assignment on mean pNF‐H values. The Wilcoxon rank‐sum test was used to compare percentage change from baseline at study visit between groups at the time point of interest.
The statistical software SAS® and R were used for these analyses. Requests for the data supporting this manuscript should be submitted to the Biogen Clinical Data Request Portal (www.biogenclinicaldatarequest.com).
Results
Plasma pNF‐H levels in infants and children without SMA
Plasma pNF‐H levels were evaluated in samples from 34 individuals without SMA or other neurodegenerative diseases who had a median (range) age of 6.5 years (7 weeks–18 years); 20 of the individuals were female and 14 male. Overall, mean (±standard error [SE]) plasma pNF‐H level was 563.6 (±231.04) pg/mL, with a median (range) of 167.0 (BLQ–7,030) pg/mL. The highest pNF‐H levels were found in the youngest infants: median (range) in those aged < 1 year was 1510 pg/mL (579–7030; n = 6) compared with 124.5 pg/mL (BLQ–395; n = 28) in those aged 1 to 18 years (P = 0.0002; Fig. 1) and appeared to decline with age (Spearman's rank correlation, –0.72; P < 0.0001). Importantly, these plasma pNF‐H values were comparable with those obtained in previously published studies (Table 1),11, 22, 23, 24, 25, 26, 27, 28, 29, 30 although it should be noted that varying methods and assays were used.
Figure 1.
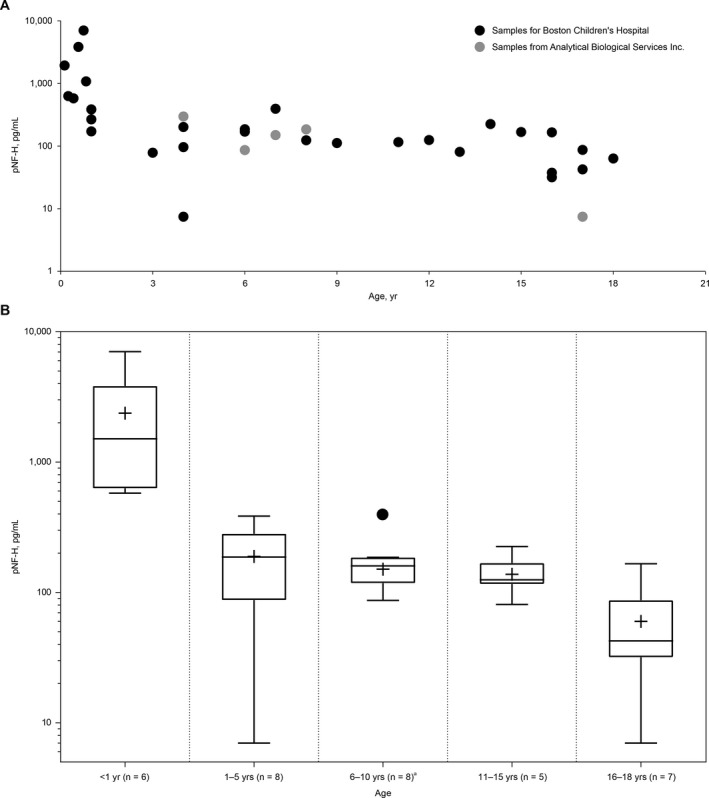
Plasma pNF‐H levels (single test per sample) in children without spinal muscular atrophy (A) by individual and (B) by age group. 7.46 pg/mL was used as the imputed value if the pNF‐H concentration was below the limit of quantification. The box represents the IQR and the whiskers the minimum and maximum values; the median is shown as a horizontal line within the box and the mean as a+. aThe highest value recorded in this group (395 pg/mL and designated by a dot) was considered an outlier by statistical analysis as it was greater than 1.5 × IQR. IQR = interquartile range; pNF‐H = phosphorylated neurofilament heavy chain.
Table 1.
Blood pNF‐H concentrations in healthy controls in previously published studies
| Reference | N | Age | Mean pNF‐H Concentration | Median pNF‐H Concentration | Assay Used | Reason for Study/Disease Being Investigated |
|---|---|---|---|---|---|---|
| Pironkova et al.23 | 20 | 0 (cord blood) | 136.8 ± 53.9 pg/mL | – | BioVendor | Congenital heart surgery |
| Morel et al.24 |
15 (vaginal delivery) 7 (cesarean section) |
2 days |
107.9 ± 54.3 pg/mL 120.2 ± 43.4 pg/mL |
107.0 pg/mL (IQR, 76–126.3) 142.3 pg/mL (IQR, 74.6–154.4) |
In‐house assay (MSD platform) | Neuronal injury and cerebral oxygenation |
| Douglas‐Escobar et al.25 | 14 | ≤3 days | – | 15 pg/mL (range, 70–460) | In‐house assay (ELISA) | Hypoxic‐ischemic encephalopathy |
| Matsushige et al.26 | 28 | Median 1.0 years (range 0.1–5.6) | ~1000 pg/mL (graph only) | – | EnCor | Prolonged febrile seizures |
| Weydt et al.11 | 19 | Median 33.0 (IQR, 25.0–44.0) | Results in CSF only | – | BioVendor | Amyotrophic lateral sclerosis |
| Petzold et al.28 | 14 | Median 36 years (IQR, 30–43) | – | 5 pg/mL (IQR, 0–94) | In‐house assay (ELISA) | Acute optic neuritis |
| Petzold et al.27 | 14 | 36 (24–59) years | – | 4.5 pg/mL (range, 0–41) | In‐house assay (ELISA) | Multiple sclerosis |
| McCombe et al.16, 29 | 59 | Mean 48 years (range 21–95) | – | 380 pg/mL (range, 0–1025) | EnCor | Amyotrophic lateral sclerosis |
| Boylan et al.30 | 19 |
Median 60 years (range 27–79) ≤60 years >60 years |
– |
170 pg/mL (25th, 75th percentile, 130, 250) 140 (120, 170) 250 (180, 310) |
In‐house assay (ELISA) | Amyotrophic lateral sclerosis |
| ProteinSimple assay product sheet22 |
10 10 10 |
NA |
Serum 222 ± 184 pg/mL EDTA plasma 226 ± 193 pg/mL Heparin plasma 220 ± 181 pg/mL |
– | ProteinSimple | – |
CSF, cerebrospinal fluid; EDTA, ethylenediaminetetraacetic acid; ELISA, enzyme‐linked immunosorbent assay; IQR, interquartile range; MSD, MesoScale Discovery; NA, not applicable; pNF‐H, phosphorylated neurofilament heavy chain.
Plasma pNF‐H levels in symptomatic infants with SMA
The participants with infantile‐onset SMA (n = 121) were, by inclusion criteria to the ENDEAR trial, symptomatic at enrollment; mean (range) age at symptom onset was 8.4 (1–20) weeks, mean (range) disease duration was 13.4 (0.0–25.9) weeks, mean (range) age at first dose was 169.2 (30–262) days, and 55% were female. Functional and electrophysiologic measures of disease severity included a mean (±standard deviation [SD]) baseline total HINE‐2 score of 1.37 (±1.1), total CHOP INTEND score of 27.2 (±8.0), peroneal CMAP amplitude of 0.353 (±0.30) mV, and ulnar CMAP amplitude of 0.226 (±0.17) mV. Pretreatment plasma pNF‐H levels were available from 117 participants and ranged from 2390 to 50,100, with a median pNF‐H level of 15,400 pg/mL. This is ~10 times the median pNF‐H level in nonneurological disease controls aged < 1 year (P < 0.0001). Of the symptomatic infants with SMA, 105/117 (90%) had a baseline pNF‐H level > 7030 pg/mL, the highest level observed in an individual without SMA. The median baseline pNF‐H concentration of the nusinersen and sham control groups was not statistically different: 15,200 pg/mL (2390–37,300; n = 77) versus 17,150 pg/mL (4900–50,100; n = 40; P = 0.2828).
Analyses of baseline pNF‐H and baseline disease characteristics showed inverse correlations with several markers of disease severity, including age at SMA diagnosis (r = −0.25; probability >r under H0, rho = 0.0064; n = 117), age at symptom onset (r = −0.20; 0.0344; n = 117), age at first dose (r = −0.24; 0.0106; n = 117), and baseline CHOP INTEND score (r = −0.30; 0.0012; n = 117), although large variations were observed among individuals for each of these variables. Similar correlations were observed with gestational age plus age at symptom onset (r = −0.19; 0.0376; n = 117), gestational age plus age at SMA diagnosis (r = −0.24; 0.0080; n = 117), and gestational age plus age at first dose (r = −0.23; 0.0130; n = 117). Other measures of disease severity, including baseline HINE‐2 motor milestone score, were not significantly correlated (data not shown). Evaluation of baseline characteristics dichotomized by median plasma pNF‐H concentration identified similar correlations (Table 2).
Table 2.
Baseline characteristics and SMA history by baseline plasma pNF‐H concentration (above and below the median)
| Baseline pNF‐H | Difference, % (95% CI)2 | P value3 | ||
|---|---|---|---|---|
| <Median1 | ≥Median1 | |||
| Individuals, n 4 | 58 | 59 | ||
| No. (%) in the nusinersen treatment arm5 | 40 (52) | 37 (48) | ||
| No. (%) in the sham control treatment arm5 | 18 (45) | 22 (55) | ||
| Female, n (%) | 32 (55) | 33 (56) | −0.76 (–18.93 to 17.84) | 1.0000 |
| Age of symptom onset, wk, mean (range) | 9.5 (3–20) | 7.3 (2–19) | 2.14 (0.66–3.62) | 0.0049 |
| Age at SMA diagnosis, wk, mean (range) | 16.02 (4–29) | 12.31 (0–30) | 3.71 (1.17–6.26) | 0.0046 |
| Disease duration, wk, mean (range) | 13.8 (0.6–25.9) | 13.2 (0–23.1) | 0.59 (−1.46 to 2.64) | 0.5723 |
| Age at first dose, wk, mean (range) | 25.8 (7.4–37.4) | 22.6 (4.3–33.6) | 3.18 (0.59–5.77) | 0.0165 |
| Gestational age + age at first dose, wk, mean (range) | 64.8 (46.4–75.1) | 61.6 (44.3–73.6) | 3.23 (0.58–5.89) | 0.0173 |
| Symptoms of SMA, n (%) | ||||
| Hypotonia | 58 (100) | 59 (100) | 0 (NA–NA) | NA |
| Motor delay | 56 (97) | 50 (85) | 11.81 (−6.15 to 29.50) | 0.0533 |
| Paradoxical breathing | 46 (79) | 49 (83) | −3.74 (−21.28 to 14.61) | 0.6428 |
| Pneumonia/respiratory symptoms | 18 (31) | 18 (31) | 0.53 (−17.95 to 17.95) | 1.0000 |
| Limb weakness | 58 (100) | 58 (98) | 1.69 (−16.28 to 19.62) | 1.0000 |
| Swallowing abnormalities | 26 (45) | 26 (44) | 0.76 (−17.84 to 18.93) | 1.0000 |
| Other | 12 (21) | 22 (37) | −16.60 (−34.37 to 1.02) | 0.0665 |
| Use of ventilator support, n (%) | 14 (24) | 13 (22) | 2.10 (−16.28 to 19.62) | 0.8290 |
| Total HINE‐2 score, mean ± SD | 1.6 ± 1.30 | 1.2 ± 0.94 | 0.40 (−0.02 to 0.82) | 0.0593 |
| Total CHOP INTEND score, mean ± SD | 29.49 ± 7.125 | 25.11 ± 7.850 | 4.38 (1.63–7.13) | 0.0020 |
| Peroneal CMAP amplitude, mean ± SD | 40 ± 0.328 | 0.28 ± 0.244 | 0.12 (0.01–0.23) | 0.0353 |
| Ulnar CMAP amplitude, mean ± SD | 0.21 ± 0.162 | 0.23 ± 0.164 | −0.02 (−0.08 to 0.05) | 0.6259 |
CHOP INTEND, Children's Hospital of Philadelphia Infant Test of Neuromuscular Disorders; CI, confidence interval; CMAP, compound muscle action potential; HINE‐2, Hammersmith Infant Neurological Examination Section 2; pNF‐H, phosphorylated neurofilament heavy chain; SD, standard deviation; SMA, spinal muscular atrophy.
Median of baseline pNF‐H = 15,400 pg/mL.
The 95% CIs for difference in continuous variables are derived from Student's 2‐sample t test. If the test on the equality of variance fails to reject the null hypothesis at alpha = 0.05, pooled‐variance t test is applied, and if the test on the equality of variance rejects the null hypothesis, Satterthwaite is applied. 95% CIs for difference in proportion are the exact unconditional CIs.
Results for continuous variables are from Student's 2‐sample t test and results for proportions are from Fisher's exact test.
Number of participants in the table refers to participants who have nonmissing baseline pNF‐H in either category.
Percentage is based on the total number of participants in either treatment cohort who have nonmissing baseline pNF‐H.
Change in plasma pNF‐H levels over time in symptomatic infants with SMA
Plasma pNF‐H concentration declined over time in both the nusinersen and sham control groups (Fig. 2A and B). In the nusinersen‐treated arm, the pNF‐H concentration declined more rapidly and to a greater magnitude before stabilizing at a level below the sham control arm at any point of the study. In contrast, participants in the sham control arm experienced a steady and gradual decline in pNF‐H concentration over the study duration. The greatest difference in mean plasma pNF‐H concentrations was observed at day 64; there was a 71.9% reduction compared with baseline in the nusinersen‐treated group and a 16.2% reduction in the sham control group (Fig. 2A). At the end of the dosing period, pNF‐H levels were 90.1% reduced in nusinersen‐treated participants and 60.3% reduced in the sham control group (compared with pretreatment levels). Analysis of variance testing based on the linear mix model indicated a marginal (average across the individuals) treatment effect on the difference in the pNF‐H decline between the nusinersen‐ and sham control–treated groups (P < 0.0001 by F test); there was also a difference between groups in percentage change from baseline at day 64 (P < 0.0001 by Wilcoxon rank‐sum test). At the end of the dosing period (mean [range] age, 15.1 [11.6–18.0] months), absolute pNF‐H levels in the nusinersen‐treated group (mean [range], 1465.5 [41–5180] pg/mL; n = 30 at day 302) were lower than in the sham control group (5664.7 [1100–10,600] pg/mL; n = 15), but remained elevated compared with age‐matched infants without SMA (aged < 1 year: mean [range], 2516.3 [579–7030] pg/mL; n = 6; aged 1–5 years: mean [range], 188.3 [7–386 pg/mL]; n = 8). At day 302, 2 (13%) participants in the sham control group and 22 (73%) in the nusinersen‐treated group had pNF‐H levels < 1940 pg/mL, a level that 75% of individuals without SMA aged < 2 years (n = 9) were below. The levels of pNF‐H from individual participants in ENDEAR (by treatment group) are shown in Figure 3.
Figure 2.
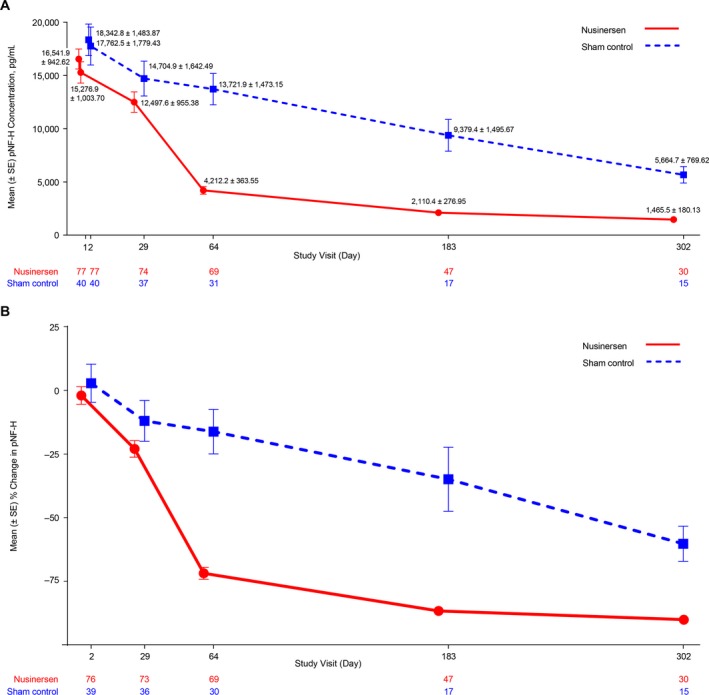
(A) Mean plasma pNF‐H concentration (pg/mL) over time during the ENDEAR trial, and (B) percentage change from baseline in pNF‐H concentration (pg/mL) over time (nusinersen offset left for the purposes of graphic display). The results presented are statistical means and do not imply that the assay is capable of the sensitivity or precision necessary to generate results > 3 significant figures. pNF‐H = phosphorylated neurofilament heavy chain; SE = standard error.
Figure 3.
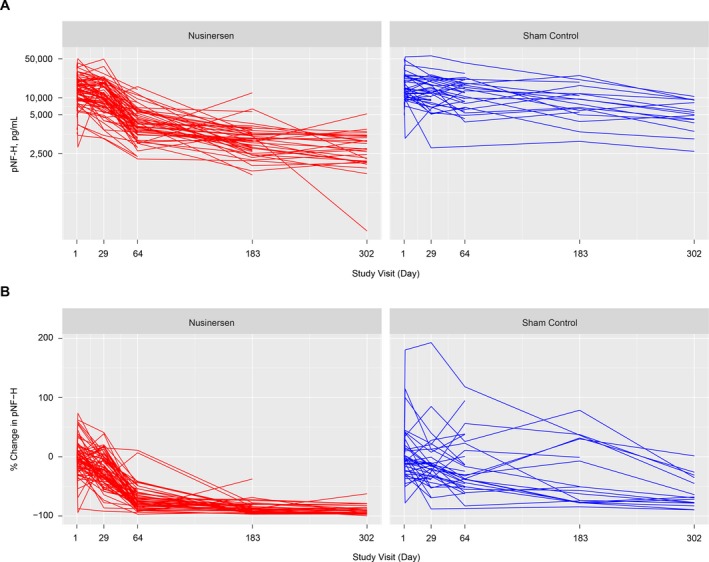
Change in pNF‐H concentration for individual participants. (A) pNF‐H concentration (pg/mL) over time, and (B) percentage change from baseline in pNF‐H concentration (pg/mL) over time. pNF‐H values are presented for study visits that the individual attended and provided a blood sample. pNF‐H = phosphorylated neurofilament heavy chain.
Discussion
Novel SMN‐enhancing treatments could substantially improve the degenerative course of SMA.4, 5 However, further optimization of treatment necessitates a sensitive and rapid pharmacodynamic/response biomarker of disease activity. Here we show that plasma pNF‐H levels are elevated in participants with infantile‐onset SMA versus age‐matched controls; that the magnitude of pretreatment pNF‐H levels correlates with clinical characteristics predictive of disease severity; and that nusinersen treatment causes a steep decline within 2 months of initiation of nusinersen followed by relative stabilization of pNF‐H levels.
Recent advances in detection technologies have enabled reliable quantification of neuronal NFs released into interstitial fluids during central or peripheral nervous system degeneration.31 Although several different assays have been used previously to measure pNF‐H, our data in nonneurological disease controls are comparable with those previously published (Table 1). Few of these studies have examined pNF‐H levels in infants aged < 1 year, and none have used the assay platform employed in this study. Interestingly, we observed higher pNF‐H levels in nonneurological disease control infants aged < 1 year than in older children, whose levels were similar to those previously reported in adults. Higher levels of plasma pNF‐H in control infants may reflect ongoing normal developmental neuronal pruning processes such as programmed cell death, remodeling of polyneuronal muscle fiber innervation, or any combination of these.32 The role of other NFs, such as NF‐L, will be important to evaluate in future studies. Furthermore, the half‐life of NFs in interstitial fluids is not known, but phosphorylation confers degradation resistance; pNFs have a much longer half‐life than the overall NF population.33 Because some studies suggest that the half‐life of NF within axons may be up to 8 months,8 it is possible that the presence of pNF‐H in plasma could reflect release that occurred weeks or months earlier.
Plasma pNF‐H concentrations in infantile‐onset SMA were significantly higher at study baseline (median, 15,400 pg/mL) than in children without SMA aged < 1 year (median, 1510 pg/mL using the same assay), or previously reported concentrations in infants/adults without SMA (Table 1).22, 23, 24, 25, 26, 27, 28, 29, 30 Elevation of plasma NF levels in infants with SMA can be expected given that human postmortem pathological studies document degeneration and severe loss of anterior horn cells, ventral root axons and neuromuscular junction (NMJ) presynaptic terminals.32 Similar neurodegenerative events are apparent in severe SMA mouse models.34 Additionally, in both human and mouse models, remaining intact presynaptic terminal axons at the NMJ contain abnormal accumulation of pNFs, which could result from abnormalities of NF transport or terminal degradation.32, 35 The magnitude of elevated baseline plasma pNF‐H levels among infantile‐onset SMA participants in ENDEAR is strikingly higher than that reported in other neurological diseases13, 27, 29, 30 with a median pretreatment plasma pNF‐H level of 15,400 pg/mL (range 2390 to 50,100) in the 117 participants with available samples. Measurements of pNF‐H levels in patients with ALS range from 220 to 3140 pg/mL in one study36 and 6.0 to 1024.2 pg/mL in another,37 and levels in patients with MS range from 0.1 to 2400 pg/mL,13, 27 although these studies use different assays. The trajectory of pNF‐H concentration over time in infantile‐onset SMA is also distinctive. In this study, pNF‐H levels declined by ~60% over the 10‐month study period in sham control–treated participants. In contrast, the median plasma pNF‐H levels of symptomatic patients with ALS remain stable or increase over time,29, 30 although rare patients with rapid disease progression show a decrease in pNF‐H.38 The high levels of pNF‐H measured in infantile‐onset SMA participants at baseline suggest that neurodegeneration is fulminant early on in the disease. This is consistent with the natural history of infantile‐onset SMA, in which symptoms present within months of birth and motor function declines by ~50% by age 3–4 months, during a time when infants would naturally be gaining substantial developmental abilities.39 It is also consistent with longitudinal electrophysiological studies of motor unit number in a small group of patients with infantile‐onset SMA who manifested a steep decline to very low levels within 1 to 2 months.40 The steady decline in pNF‐H levels in sham control–treated participants with infantile‐onset SMA who experienced a progressive decline of function may represent any of a number of nonexclusive processes, including death of motor neurons and/or axons, progressive motor neuron dysfunction to a nonfunctional but reversible state, change from an active to subacute disease phase, decreased production of pNF‐H and/or changes in mechanisms of pNF‐H release, and/or changes in how pNF‐H is synthesized, released, or degraded over developmental time. These pNF‐H changes in the sham control group further support the well‐established hypothesis that neurodegeneration is most active at clinical disease onset.7, 41 Further studies will be needed to determine when NF levels first become elevated in patients with SMA, and the patterns of NF expression in individuals with later‐onset SMA.
Disease biomarkers can serve many purposes; they can inform prognosis, signal disease progression, predict response to therapy, and/or mark a key process of disease that is influenced by therapy. Baseline correlations between pNF‐H levels and clinical characteristics indicative of disease severity in the ENDEAR population suggest that elevated levels of pNF‐H may have prognostic value because they correlate with disease course. The temporal relationship between onset of release of pNF‐H into interstitial fluid and an irreversible step in SMA‐associated neurodegeneration is at present unknowable, because a cascade of neuronal degenerative steps may precede, coincide, or follow pNF‐H release. Nonetheless, the early, marked elevation of pNF‐H suggests that levels may also be elevated in presymptomatic children, such as those identified during newborn screening, indicating an underlying degenerative process and justifying treatment initiation. In those identified during newborn screening who have ≥ 4 SMN2 copies, monitoring pNF‐H levels may facilitate decisions on the appropriate time to initiate therapy to achieve the optimal outcome.42
In most diseases, evaluating NF levels as a marker of treatment response has been limited by the lack of disease‐modifying therapies. One exception is MS, in which a decrease of serum NF‐L (up to 34% over 12 months) has been associated with initiation or change in treatment.31 The rapid decline of highly elevated pNF‐H levels following initiation of nusinersen in participants who later manifested clinical stabilization or improvement relative to sham control–treated participants strongly supports pNF‐H levels as a pharmacodynamics/response biomarker for nusinersen and potentially other SMN‐targeted therapies. These data suggest nusinersen is suppressing the degenerative disease process via increased production of full‐length SMN protein, thus reducing ongoing release of pNF‐H from SMN‐deficient neurons. This is consistent with the effects previously observed in severe SMA mouse models where nusinersen was associated with retained NMJ innervation and increased anterior horn cell survival.43 While decreases in pNF‐H were evident at the first follow‐up assessment, the most dramatic effect was seen at day 64. This latency may reflect the time needed for SMN protein levels to accumulate thus slowing degeneration, time needed to clear irreparably damaged neurons and axons, half‐life of interstitial pNF‐H clearance, or most likely a combination of these. While the decreases are dramatic, the decline (in individuals likely already diminished in NF‐containing neuronal and axonal volume) to median levels still above levels among age‐matched controls suggests ongoing low levels of neurodegeneration despite treatment, regional areas of insufficient treatment, or persistence of very long‐lived species of pNF‐H in the blood compartment.
When interpreting these results, consideration should be given to the relatively small number of samples from individuals without SMA, a potential floor effect with pNF‐H levels in individuals without SMA, potential confounding factors for certain baseline disease characteristics, and lack of sensitivity of certain clinical outcome scales.
Together, these data support use of plasma pNF‐H concentration as a novel, clinically relevant pharmacodynamics/response biomarker for nusinersen in SMA, with the potential to refine recommendations for treatment initiation/optimization and to allow for differentiation among SMN‐targeting therapies. Further analysis of pre‐ and posttreatment plasma and CSF pNF‐H and NF‐L levels across SMA populations (e.g., presymptomatic and later‐onset SMA) and evaluation of potential correlations with efficacy outcomes will contribute to a more comprehensive understanding of the potential biomarker functions that NF levels may serve. Furthermore, additional work in murine models of SMA may identify the relationship between release of pNF‐H into the interstitium and nonreversible steps in the cascade of neurodegeneration.
Author Contributions
B.T.D., T.O.C., J.S., A.M., M.P., C.S., W.F., and C.J.S. contributed to the conception and design of the study. B.T.D., T.O.C., R.S.F., E.M., D.C.D., M.O., E.F.T., M.M.R., F.M., G.Z., J.S., A.M., M.P., C.S., S.F., W.F., and C.J.S. contributed to the acquisition and analysis of data. B.T.D., T.O.C., R.S.F., E.M., D.C.D., M.O., E.F.T., M.M.R., F.M., G.Z., J.S., A.M., M.P., C.S., S.F., W.F., and C.J.S. contributed to the text and preparing the figures.
Conflicts of Interest
This study was sponsored by Biogen (Cambridge, MA, USA). Biogen provided funding for medical writing support in the development of this paper; Rebecca Ayles, PhD, from Excel Scientific Solutions wrote the first draft of the manuscript based on input from authors, and Kristen DeYoung from Excel Scientific Solutions copyedited and styled the manuscript per journal requirements. Biogen reviewed and provided feedback on the paper to the authors. The authors had full editorial control of the paper and provided their final approval of all content.
B.T.D. has been a member of advisory boards for AveXis, Biogen, Cytokinetics, PTC, Roche, Santhera, and Sarepta, with no financial interests in these companies; received research support from CureSMA, the National Institutes of Health/National Institute of Neurological Disorders and Stroke, the Slaney Family Fund for SMA, the SMA Foundation, and Working on Walking Fund; and received grants from Biogen and Ionis Pharmaceuticals, Inc. during the ENDEAR, CHERISH, CS1/CS2, CS12, and CS11 studies, and from AveXis, Biogen, Cytokinetics, Fibrogen, PTC, Roche, Santhera, Sarepta, and Summit. T.O.C. has been an advisor/consultant for AveXis, Biogen, Catalyst, CureSMA, Cytokinetics, Marathon, Novartis, Roche, Sarepta, and the SMA Foundation. R.S.F. has received grants and advisor fees from Biogen and Ionis Pharmaceuticals, Inc. during ENDEAR and CHERISH; received grants from Cytokinetics; been an advisor to AveXis, received grants for the STR1VE, STRONG and SPR1NT studies, and served on the data safety monitoring board for the AveXis AVX‐101 phase 1 gene transfer study; been an advisor to Novartis; been an advisor to Roche, received grants for the FIREFISH and SUNFISH studies, and served on the data safety monitoring board for the Moonfish phase 1b study; acted in an advisory capacity to nonprofit organizations: CureSMA, SMA Europe, the SMA Foundation, and SMA Reach (UK), outside the submitted work; and has received royalty payments from Children's Hospital of Philadelphia for licensing fees obtained for use of the CHOP INTEND motor function scale. E.M. has been a member of advisory boards for SMA studies for AveXis, Biogen, Ionis Pharmaceuticals, Inc., Novartis, and Roche; been a principal investigator for ongoing Ionis Pharmaceuticals, Inc./Biogen, Novartis, and Roche clinical trials; received support from Biogen for a natural history registry; and received funding from Famiglie SMA Italy, Italian Telethon, and SMA Europe. D.C.D. has been an advisor/consultant for AveXis, Biogen, Cytokinetics, Ionis Pharmaceuticals, Inc., Metafora, Roche, Sanofi, Sarepta, and the SMA Foundation, with no financial interests in these companies; and received grants/clinical trial support from Biogen, the Department of Defense, Hope for Children Research Foundation, Mallinckrodt, the National Institutes of Health, PTC, Sarepta, the SMA Foundation, and Ultragenyx. M.O. has been a member of advisory boards for Biogen; received grants from Biogen and Ionis Pharmaceuticals, Inc. during the ENDEAR, CHERISH, and CS11 studies, Cytokinetics, and Roche; and been a member of the data safety monitoring board for AveXis gene therapy studies. E.F.T. has received grant support to conduct clinical trials on SMA from Biogen and Ionis Pharmaceuticals, Inc.; serves as a consultant to AveXis, Biogen, Biologix, Cytokinetics, and Roche; and serves as a scientific/medical advisor to FAME Chile, Familias SMA Argentina, FUNDAME, SMA Europe, and TREAT‐NMD. He has received funding from Fundación Privada Daniel Bravo Andreu and SMA Europe. M.M.R. has received grants/advisor fees from Biogen, Genzyme, and Pfizer; been an advisor to and received funding from nonprofit organizations: FSHD Global Research Foundation, Muscular Dystrophy Association, Muscular Dystrophy Foundation, and Save Our Sons Duchenne Foundation. F.M. has been a member of advisory boards for AveXis, Biogen, Cytokinetics, Novartis, Pfizer, PTC, Roche, Sarepta, Summit, and Wave; been a principal investigator for ongoing Ionis Pharmaceuticals, Inc./Biogen and Roche clinical trials; and received funding from Muscular Dystrophy UK, SMA Europe, and SMA Trust UK. G.Z., J.S., A.M., M.P., C.S., S.F., and W.F. are employees of and hold stock/stock options in Biogen. J.S. reports a patent pending on behalf of Biogen. C.J.S. has received grant support from Ionis Pharmaceuticals, Inc.; and been a consultant for AveXis, Biogen, Pfizer, PTC, and Roche.
Acknowledgments
The authors would like to thank the children who participated in these studies and their parents/guardians, the staff at Boston Children's Hospital for their collaboration in providing blood samples from children without SMA, and all investigators and staff involved in the ENDEAR trial. F.M. is supported by the National Institute for Health Research (NIHR) Great Ormond Street Hospital Biomedical Research Centre. The views expressed are those of the author(s) and not necessarily those of the National Health Service, the NIHR, or the Department of Health.
Funding Information
This study was sponsored by Biogen (Cambridge, MA, USA).
Funding Statement
This work was funded by Biogen grant .
References
- 1. Darras BT, Markowitz JA, Monani UR, De Vivo DC. Spinal muscular atrophies In: Darras B. T., Jones J., H. R. Jr, M., Ryan M., De Vivo D. C., eds. Neuromuscular disorders of infancy, childhood, and adolescence: a clinician's approach. 2nd ed. pp. 117–145. Cambridge, MA: Academic Press, 2015. [Google Scholar]
- 2. Spinraza 12 mg solution for injection [summary of product characteristics] . http://www.ema.europa.eu/docs/en_GB/document_library/EPAR_-_Product_Information/human/004312/WC500229704.pdf. Accessed June 4, 2018.
- 3. Spinraza [package insert] . Cambridge, MA: Biogen, 2018.
- 4. Finkel RS, Mercuri E, Darras BT, et al.; ENDEAR Study Group . Nusinersen versus sham control in infantile‐onset spinal muscular atrophy. N Engl J Med 2017;377:1723–1732. [DOI] [PubMed] [Google Scholar]
- 5. Mercuri E, Darras BT, Chiriboga CA, et al.; CHERISH Study Group . Nusinersen versus sham control in later‐onset spinal muscular atrophy. N Engl J Med 2018;378:625–635. [DOI] [PubMed] [Google Scholar]
- 6. Calucho M, Bernal S, Alias L, et al. Correlation between SMA type and SMN2 copy number revisited: an analysis of 625 unrelated Spanish patients and a compilation of 2834 reported cases. Neuromuscul Disord 2018;28:208–215. [DOI] [PubMed] [Google Scholar]
- 7. Arnold WD, Simard LR, Rutkove SB, Kolb SJ. Development and testing of biomarkers in spinal muscular atrophy In: Sumner CJ, Paushkin S, Ko C‐P, eds. Spinal muscular atrophy: disease mechanisms and therapy, 1st ed Cambridge, MA: Academic Press, 2017:383–397. [Google Scholar]
- 8. Yuan A, Rao MV, Veeranna, Nixon RA. Neurofilaments and neurofilament proteins in health and disease. Cold Spring Harb Perspect Biol 2017;9:a018309 10.1101/cshperspect.a018309. Review [DOI] [PMC free article] [PubMed] [Google Scholar]
- 9. Petzold A. Neurofilament phosphoforms: surrogate markers for axonal injury, degeneration and loss. J Neurol Sci 2005;233:183–198. [DOI] [PubMed] [Google Scholar]
- 10. Goldstein ME, Sternberger NH, Sternberger LA. Phosphorylation protects neurofilaments against proteolysis. J Neuroimmunol 1987;14:149–160. [DOI] [PubMed] [Google Scholar]
- 11. Weydt P, Oeckl P, Huss A, et al. Neurofilament levels as biomarkers in asymptomatic and symptomatic familial amyotrophic lateral sclerosis. Ann Neurol 2016;79:152–158. [DOI] [PubMed] [Google Scholar]
- 12. Teunissen CE, Khalil M. Neurofilaments as biomarkers in multiple sclerosis. Mult Scler 2012;18:552–556. [DOI] [PubMed] [Google Scholar]
- 13. Gresle MM, Liu Y, Dagley LF, et al. Serum phosphorylated neurofilament‐heavy chain levels in multiple sclerosis patients. J Neurol Neurosurg Psychiatry 2014;85:1209–1213. [DOI] [PubMed] [Google Scholar]
- 14. Kuhle J, Leppert D, Petzold A, et al. Neurofilament heavy chain in CSF correlates with relapses and disability in multiple sclerosis. Neurology 2011;76:1206–1213. [DOI] [PubMed] [Google Scholar]
- 15. Constantinescu R, Zetterberg H, Holmberg B, Rosengren L. Levels of brain related proteins in cerebrospinal fluid: an aid in the differential diagnosis of parkinsonian disorders. Parkinsonism Relat Disord 2009;15:205–212. [DOI] [PubMed] [Google Scholar]
- 16. Xu Z, Henderson RD, David M, McCombe PA. Neurofilaments as biomarkers for amyotrophic lateral sclerosis: a systematic review and meta‐analysis. PLoS ONE 2016;11:e0164625. [DOI] [PMC free article] [PubMed] [Google Scholar]
- 17. Novakova L, Zetterberg H, Sundstrom P, et al. Monitoring disease activity in multiple sclerosis using serum neurofilament light protein. Neurology 2017;89:2230–2237. [DOI] [PMC free article] [PubMed] [Google Scholar]
- 18. Mattsson N, Andreasson U, Zetterberg H, et al. Association of plasma neurofilament light with neurodegeneration in patients with Alzheimer disease. JAMA Neurol 2017;74:557–566. [DOI] [PMC free article] [PubMed] [Google Scholar]
- 19. Benatar M, Wuu J, Andersen PM, et al. Neurofilament light: a candidate biomarker of presymptomatic amyotrophic lateral sclerosis and phenoconversion. Ann Neurol 2018;84:130–139. [DOI] [PMC free article] [PubMed] [Google Scholar]
- 20. Sandelius A, Zetterberg H, Blennow K, et al. Plasma neurofilament light chain concentration in the inherited peripheral neuropathies. Neurology 2018;90:e518–e524. [DOI] [PMC free article] [PubMed] [Google Scholar]
- 21. Hayer SN, Krey I, Barro C, et al. NfL is a biomarker for adult‐onset leukoencephalopathy with axonal spheroids and pigmented glia. Neurology 2018;91:755–757. [DOI] [PubMed] [Google Scholar]
- 22. ProteinSimple . ProteinSimple NF‐H specification sheet. https://www.proteinsimple.com/documents/NF-H_Specification_Sheet_Rev_B.pdf. Accessed June 4, 2018.
- 23. Pironkova RP, Giamelli J, Seiden H, et al. Brain injury with systemic inflammation in newborns with congenital heart disease undergoing heart surgery. Exp Ther Med 2017;14:228–238. [DOI] [PMC free article] [PubMed] [Google Scholar]
- 24. Morel AA, Bailey SM, Shaw G, et al. Measurement of novel biomarkers of neuronal injury and cerebral oxygenation after routine vaginal delivery versus cesarean section in term infants. J Perinat Med 2014;42:705–709. [DOI] [PubMed] [Google Scholar]
- 25. Douglas‐Escobar M, Yang C, Bennett J, et al. A pilot study of novel biomarkers in neonates with hypoxic‐ischemic encephalopathy. Pediatr Res 2010;68:531–536. [DOI] [PMC free article] [PubMed] [Google Scholar]
- 26. Matsushige T, Inoue H, Fukunaga S, et al. Serum neurofilament concentrations in children with prolonged febrile seizures. J Neurol Sci 2012;321:39–42. [DOI] [PubMed] [Google Scholar]
- 27. Petzold A, Brassat D, Mas P, et al. Treatment response in relation to inflammatory and axonal surrogate marker in multiple sclerosis. Mult Scler 2004;10:281–283. [DOI] [PubMed] [Google Scholar]
- 28. Petzold A, Rejdak K, Plant GT. Axonal degeneration and inflammation in acute optic neuritis. J Neurol Neurosurg Psychiatry 2004;75:1178–1180. [DOI] [PMC free article] [PubMed] [Google Scholar]
- 29. McCombe PA, Pfluger C, Singh P, et al. Serial measurements of phosphorylated neurofilament‐heavy in the serum of subjects with amyotrophic lateral sclerosis. J Neurol Sci 2015;353:122–129. [DOI] [PubMed] [Google Scholar]
- 30. Boylan K, Yang C, Crook J, et al. Immunoreactivity of the phosphorylated axonal neurofilament H subunit (pNF‐H) in blood of ALS model rodents and ALS patients: evaluation of blood pNF‐H as a potential ALS biomarker. J Neurochem 2009;111:1182–1191. [DOI] [PubMed] [Google Scholar]
- 31. Khalil M, Teunissen CE, Otto M, et al. Neurofilaments as biomarkers in neurological disorders. Nat Rev Neurol 2018;14:577–589. [DOI] [PubMed] [Google Scholar]
- 32. Pérez‐Garcia MJ, Kong L, Sumner CJ, Tizzano EF. Developmental aspects and pathological findings in spinal muscular atrophy In: Sumner CJ, Paushkin S, Ko C‐P, eds. Spinal muscular atrophy: disease mechanisms and therapy, 1st ed Cambridge, MA: Academic Press, 2017:21–42. [Google Scholar]
- 33. Lee S, Sunil N, Shea TB. C‐terminal neurofilament phosphorylation fosters neurofilament‐neurofilament associations that compete with axonal transport. Cytoskeleton (Hoboken) 2011;68:8–17. [DOI] [PubMed] [Google Scholar]
- 34. Park GH, Kariya S, Monani UR. Spinal muscular atrophy: new and emerging insights from model mice. Curr Neurol Neurosci Rep 2010;10:108–117. [DOI] [PMC free article] [PubMed] [Google Scholar]
- 35. Boido M, Vercelli A. Neuromuscular junctions as key contributors and therapeutic targets in spinal muscular atrophy. Front Neuroanat 2016;10:6. [DOI] [PMC free article] [PubMed] [Google Scholar]
- 36. Boylan KB, Glass JD, Crook JE, et al. Phosphorylated neurofilament heavy subunit (pNF‐H) in peripheral blood and CSF as a potential prognostic biomarker in amyotrophic lateral sclerosis. J Neurol Neurosurg Psychiatry 2013;84:467–472. [DOI] [PubMed] [Google Scholar]
- 37. De Schaepdryver M, Jeromin A, Gille B, et al. Comparison of elevated phosphorylated neurofilament heavy chains in serum and cerebrospinal fluid of patients with amyotrophic lateral sclerosis. J Neurol Neurosurg Psychiatry 2018;89:367–373. [DOI] [PubMed] [Google Scholar]
- 38. Lu CH, Petzold A, Topping J, et al. Plasma neurofilament heavy chain levels and disease progression in amyotrophic lateral sclerosis: insights from a longitudinal study. J Neurol Neurosurg Psychiatry 2015;86:565–573. [DOI] [PMC free article] [PubMed] [Google Scholar]
- 39. Kolb SJ, Coffey CS, Yankey JW, et al.; NeuroNEXT Clinical Trial Network and on behalf of the NN101 SMA Biomarker Investigators . Baseline results of the NeuroNEXT spinal muscular atrophy infant biomarker study. Ann Clin Transl Neurol 2016;3:132–145. [DOI] [PMC free article] [PubMed] [Google Scholar]
- 40. Swoboda KJ, Prior TW, Scott CB, et al. Natural history of denervation in SMA: relation to age, SMN2 copy number, and function. Ann Neurol 2005;57:704–712. [DOI] [PMC free article] [PubMed] [Google Scholar]
- 41. Kolb SJ, Coffey CS, Yankey JW, et al.; NeuroNEXT Clinical Trial Network on behalf of the NN101 SMA Biomarker Investigators . Natural history of infantile‐onset spinal muscular atrophy. Ann Neurol 2017;82:883–891. [DOI] [PMC free article] [PubMed] [Google Scholar]
- 42. Glascock J, Sampson J, Haidet‐Phillips A, et al. Treatment algorithm for infants diagnosed with spinal muscular atrophy through newborn screening. J Neuromuscul Dis 2018;5:145–158. [DOI] [PMC free article] [PubMed] [Google Scholar]
- 43. Passini MA, Bu J, Richards AM, et al. Antisense oligonucleotides delivered to the mouse CNS ameliorate symptoms of severe spinal muscular atrophy. Sci Transl Med 2011;3:72ra18. [DOI] [PMC free article] [PubMed] [Google Scholar]