

SUMMARY
Lafora disease (LD) and adult polyglucosan body disease (APBD) are glycogen storage diseases characterized by a pathogenic buildup of insoluble glycogen. Mechanisms causing glycogen insolubility are poorly understood. Here, in two mouse models of LD (Epm2a−/− and Epm2b−/−) and one of APBD (Gbe1ys/ys), the separation of soluble and insoluble muscle glycogen is described, enabling separate analysis of each fraction. Total glycogen is increased in LD and APBD mice, which, together with abnormal chain length and molecule size distributions, is largely if not fully attributed to insoluble glycogen. Soluble glycogen consists of molecules with distinct chain length distributions and differential corresponding solubility, providing a mechanistic link between soluble and insoluble glycogen in vivo. Phosphorylation states differ across glycogen fractions and mouse models, demonstrating that hyperphosphorylation is not a basic feature of insoluble glycogen. Lastly, model-specific variances in protein and activity levels of key glycogen synthesis enzymes suggest uninvestigated regulatory mechanisms.
In Brief
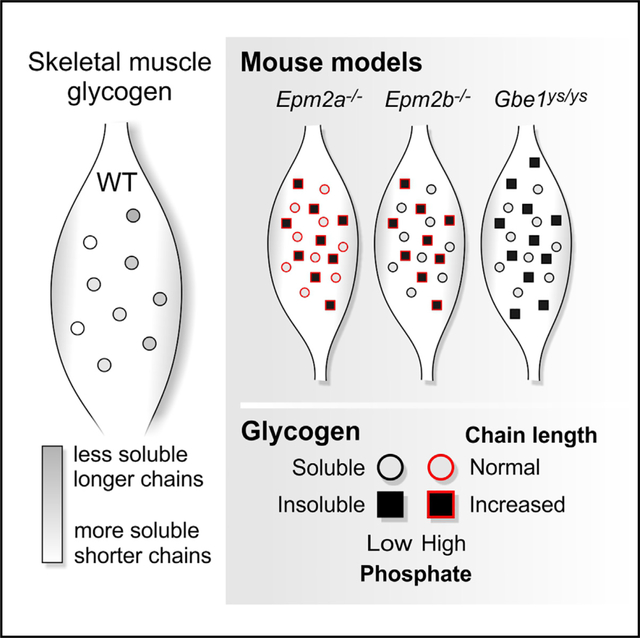
EPM2A, EPM2B, or GBE1 deficiency causes insoluble glycogen accumulation and neurodegenerative diseases. Sullivan et al. show that these defects do not impair the construction of WT-like soluble glycogen. Demonstrating varying chain length distributions and correlating precipitation propensity among WT-glycogen molecules, a mechanistic explanation emerges for the structural characteristics of insoluble glycogen.
Graphical Abstract
INTRODUCTION
Glycogen is a disperse mixture of water-soluble roughly spherical macromolecules, consisting of branched glucan chains and providing cells with carbon and energy. It is synthesized by the enzymes glycogen synthase (GYS) (chain-elongating) and glycogen branching enzyme (GBE1) (branch point-forming; Roach et al., 2012). The concerted action of GYS and GBE1 enables frequent and coordinated branching, ensuring water solubility (Figure 1A).
Figure 1. Glycogen Accumulation in LD and APBD Model Mice Is due to Increased Insoluble Glycogen with Model-Specific Glycogen Phosphorylation Patterns.

(A) Glycogen synthesis requires a concerted action of GYS and GBE1 for chain elongation and branching, respectively.
(B) Laforin is a glycogen phosphatase.
(C) Modulation of GYS levels directly or of the GYS activation state indirectly by downregulating PTG, a glycogen-targeting subunit of protein phosphatase1 (PP1), via the laforin-malin complex
(D) GSD mouse models used in this study.
(E) PB accumulation in skeletal muscle of Epm2a−/−, Epm2b−/−, and Gbe1ys/ys mice (scale bars, 50 μm).
(F) Method used to separate soluble and insoluble muscle glycogen.
(G) Glycogen content in total, soluble, and insoluble muscle glycogen fractions of Epm2a−/−, Epm2b−/−, Gbe1ys/ys, and respective WT mice.
(H) Glycogen C6 phosphate in total, soluble, and insoluble muscle glycogen fractions of Epm2a−/−, Epm2b−/−, Gbe1ys/ys, and respective WT mice.
Data are presented as mean + SD (n = 5–6 animals). *p < 0.05; **p < 0.01; ***p < 0.001. See also Figure S1.
Glycogen storage diseases (GSDs) are caused by inherited aberrations in glycogen metabolism (Hicks etal., 2011). A subset of GSDs, including Lafora disease (LD) (OMIM: 254780), adult polyglucosan body disease (APBD) (OMIM: 263570), Andersen disease (OMIM: 232500), and Tarui disease (OMIM: 232800), is characterized by an accumulation of water-insoluble glycogen, forming intracellular particles called polyglucosan bodies (PBs) (in LD called Lafora bodies) in various organs, including the brain and skeletal muscle (Orhan Akman et al., 2015; Bao et al., 1996; Berkovicetal., 1986; Hays etal., 1981; Nitschke et al., 2018; Suzuki et al., 1971).
LD is an autosomal recessive progressive myoclonus epilepsy that manifests during adolescence, involves severe neurodegeneration, and is typically fatal within a decade of the first epileptic episode (Andrade et al., 2007). LD is caused by mutations in either laforin (EPM2A) or malin (EPM2B). Laforin is a carbohydrate-binding dual-specificity phosphatase that dephosphorylates glycogen (Emanuelle et al., 2016; Figure 1B). Malin forms a complex with laforin and acts as a ubiquitin E3 ligase implicated in regulating glycogen-metabolism-related enzymes (Chan et al., 2003; Sullivan et al., 2017; Figure 1C).
APBD is an adult-onset variant of GSD type IV presenting as a progressive upper and lower motor neurodegenerative disease (Robitaille et al., 1980). APBD is caused by autosomal recessive mutations in GBE1, the most common being p.Y329S, resulting in GBE1 activity reduction to 10%–20% of controls (Akman et al., 2015; Mochel et al., 2012). There are currently no effective therapeutic treatments for either LD or APBD.
The causative mechanisms underlying the pathogenic accumulation of insoluble glycogen are poorly understood. Studies in LD mouse models revealed the presence of higher levels of covalently bound phosphate in LD muscle and brain glycogen (Nitschke et al., 2013, 2017; Tagliabracci et al., 2007). This is not surprising in laforin (phosphatase)-deficient Epm2a−/− mice but is intriguing in malin-deficient Epm2b−/− mice, where glycogen phosphate levels are intermediate between wild-type (WT) and Epm2a−/− levels (DePaoli-Roach et al., 2015; Tiberia et al., 2012). Increased phosphate has been hypothesized to be inseparably associated with the cause(s) of glycogen insolubility and precipitation in LD (Roach, 2015). In APBD, glycogen phosphorylation has not been studied.
More recent evidence indicates that hyperphosphorylation per se is not responsible for PB formation in muscle and brain of LD mice (Gayarre et al., 2014; Nitschke et al., 2017). Overall, the functional implications of glycogen phosphorylation and its relevance in PB formation remain unclear.
Glycogen chain length is an important structural feature that likely affects the molecule’s solubility. Longer glucan chains tend to form double helices, which characterizes semi-crystalline starch, glycogen’s water-insoluble counterpart in plants (Gidley and Bulpin, 1987). LD muscle and brain glycogen is enriched in longer glucan chains, resulting in an abnormal chain length distribution (CLD) (Nitschke et al., 2013, 2017). Insufficient direct and indirect downregulation of chain-elongating GYS in the absence of a functional laforin-malin complex was offered as an explanation (Vilchez et al., 2007; Worby et al., 2008; Figure 1C). Increased chain lengths have also been shown in Andersen disease, a juvenile-onset GSD type IV variant, though using older limited methodology (Brown and Brown, 1966; Mercierand Whelan, 1973), and CLD has not yet been analyzed in the context of APBD. Increased chain length is a logical consequence of reduced GBE1 activity. Changes in GYS1 activity, as observed in both a neuronal model with GBE1 knockdown (Kakhlon et al., 2013) and an embryonic mouse model (Akman et al., 2011), may also play a role. However, the exact mechanistic relationship between GBE1 deficiency, glycogen chain length, and PB accumulation is not well understood.
As PB accumulation is central to LD and APBD pathogenesis, unravelling the mechanisms contributing to glycogen insolubility is critical to understanding these diseases and developing therapeutic interventions. To date, all features of abnormal LD and APBD glycogen have been analyzed, largely using total extractable glycogen from muscle or brain (Irimia et al., 2015; Nitschke et al., 2013, 2017; Tagliabracci et al., 2007), which makes it impossible to determine the characteristics of soluble and insoluble glycogen, a consistent blind spot in the analysis of LD, APBD, and other GSD glycogen.
A rough fractionation of tissue lysates conducted previously confirmed the presence of a large proportion of sedimenting (hence likely insoluble) muscle and brain glycogen in Epm2a−/− mice (Tagliabracci et al., 2008) and Epm2b−/− mice (Valles-Ortega et al., 2011). Structural differences were suggested between sedimented and non-sedimented glycogen from the muscle of Epm2a−/− mice. However, a clear separation of soluble and insoluble glycogen fractions from LD and APBD mice and a thorough characterization has not been performed.
Here, we describe a method to separate total into soluble and insoluble muscle glycogen from both LD mouse models (Epm2a−/− and Epm2b−/−) and the APBD mouse model (Gbe1ys/ys; i.e., p.Y329S). Independent and thorough characterization of the glycogen fractions is conducted, and the protein levels and activities of the main enzymes in glycogen synthesis are determined. Our results afford further insight into the pathogenic consequences of laforin, malin, or GBE1 deficiency on the properties of soluble and insoluble glycogen and also reveal evidence for mechanisms underlying PB formation.
RESULTS AND DISCUSSION
Glycogen from PB-Accumulating Tissues Consists of Distinct Fractions
Total, soluble, and insoluble glycogen was prepared from skeletal muscle of Epm2a−/−, Epm2b−/−, and Gbe1ys/ys mice and their respective WT littermates (Figure 1D). All disease model mice showed significant PB load in muscle (Figure 1E). A method (Figure 1F) was developed that reproducibly separates and, therefore, demonstrates the existence of two distinct forms of glycogen in PB-containing tissue: one sedimenting within a wide range of centrifugation speeds (insoluble glycogen) and one consistently remaining in the supernatant (soluble glycogen; Figure S1A), confirming distinct sedimentation properties of both fractions. Analyses of technical replicates from one Epm2a−/− and one WT mouse confirmed minimal experimental error (Figure S1B). Furthermore, soluble and insoluble glycogen content together amount to about the same value as total glycogen (homogenate) for each genotype (recovery on average about 90%; Figure S1C). The absence of glycogen in S5 and the WT pellet fraction (Figures 1G, S1B, and S1C) shows successful removal of soluble glycogen from the pellet.
Our separation method involves mild conditions (i.e., avoiding heating and KOH treatment), maintaining the native state of all fractions, which argues for their in vivo existence in the disease models. For further analyses, glycogen was solubilized and purified from the homogenate (total glycogen), the S1 (soluble glycogen), and pellet (insoluble glycogen) fraction.
Increased Glycogen in Disease Model Mice Is due to Accumulation of Insoluble Glycogen
LD and APBD mice showed a significant increase in total and insoluble glycogen, and the amount of soluble glycogen was comparable to WT (Figures 1G and S1C). These results clearly demonstrate that the increase in total glycogen, which has been previously described for LD and APBD mice (Orhan Akman et al., 2015; DePaoli-Roach et al., 2010; Tagliabracci et al., 2008), is solely due to the accumulation of insoluble, not soluble, glycogen. This is evidence supporting that a mere increase of glycogen production is not causative of the formation of insoluble glycogen and hence PB accumulation. The amount of soluble and total glycogen in WT mice was indistinguishable, which is in line with the absence of insoluble glycogen in WT muscle (Figures 1E and 1G). Intriguingly, the unchanged amount of soluble glycogen in all mutant mice in comparison to WT provides strong evidence that the production and degradation of soluble glycogen (and hence cellular storage of energy) is largely unaffected in muscle despite absences of laforin, malin, or GBE1.
The biological variation was especially high for the total and insoluble glycogen in LD and APBD mice (Figure 1G), which is in accordance with the varying amounts of insoluble glycogen in these mice (Figure S1C). This corroborates the extent of PB formation not depending on the amount of soluble glycogen, which is quite stable.
Although 5–9 months younger, Gbe1yslys mice showed significantly more insoluble glycogen than Epm2a−/− and Epm2b−/− mice (Figure 1G). This is unexpected, as onset and progression of human APBD is later and slower, respectively, compared to LD (Mochel et al., 2012; Nitschke et al., 2018). Differences in the composition and location of PBs may also have an impact on onset and progression of the human diseases.
Glycogen C6 Phosphate Levels in Soluble and Insoluble Glycogen Differ across Disease Models
Glycogen C6 phosphate (GC6P) was taken as a proxy for total glycogen phosphorylation (see STAR Methods). In Epm2a−/− mice, the amount of GC6P was elevated in both the soluble and insoluble fraction, and it was only elevated in the insoluble fraction in Epm2b−/− mice (Figure 1H). This indicates that GC6P is normally removed from soluble glycogen, which in Epm2b−/− mice can be achieved by laforin, whose levels are unaltered (DePaoli-Roach et al., 2010). However, despite the presence of laforin in Epm2b−/− mice, GC6P is not removed from insoluble glycogen, indicated by similar GC6P levels in the insoluble glycogen of Epm2b−/− mice and Epm2a−/− mice (Figure 1H).
Our data shed light onto the question of why hyperphosphorylation measured in total glycogen is lower in Epm2b−/− than in Epm2a−/− mice (DePaoli-Roach et al., 2015; Tiberia et al., 2012): total glycogen is a mixture of soluble (low phosphate in Epm2b−/−) and insoluble glycogen (hyperphosphorylated in Epm2b−/−). Therefore, the extent of phosphorylation of total glycogen is merely dependent on the ratio of both differentially phosphorylated glycogen fractions, explaining the intermediate levels in Epm2b−/− mice.
In Gbe1yslys mice, GC6P was only slightly elevated in the insoluble compared to the soluble fraction, although these levels were not significantly different from those in total and soluble glycogen in the WT controls (Figure 1H). This implies that, in Gbe1yslys mice, either glycogen phosphate is efficiently removed before or after precipitation and or glycogen phosphorylation proceeds altogether differently than in LD mice.
GC6P being heterogeneous across the disease models and glycogen fractions makes it unlikely that hyperphosphorylation per se, as previously suggested (Roach, 2015), causes glycogen insolubility. First, if hyperphosphorylation of normal glycogen promotes its precipitation, one would expect to see differences in the soluble glycogen amounts of Epm2a−/− (high GC6P) and Epm2b−/− or WT mice (low GC6P). Yet levels of soluble glycogen in Epm2a−/− mice were normal (Figure 1G), although GC6P was as high as in insoluble glycogen. Thus, our results support the recent finding that glycogen hyperphosphorylation does not necessarily lead to PB formation (Nitschke et al., 2017). Second, in Gbe1ys/ys mice, PBs are formed in the absence of hyperphosphorylation, which excludes the latter as the major cause of glycogen precipitation.
CLDs Are Normal in All Soluble and Abnormal in All Insoluble Fractions
Total muscle glycogen of Epm2a−/− and Epm2b−/− mice contained a higher proportion of longer glucan chains than WT. In total Gbe1ys/ys glycogen, this effect was even stronger (Figure 2A). These results confirm previous results in LD mice (Nitschke et al., 2013, 2017) and now show highly abnormal CLDs in the context of APBD. Consistent with the finding that, in WT, effectively all glycogen is soluble, the CLDs of soluble and total glycogen from WT mice were indistinguishable (Figure 2A).
Figure 2. Abnormal CLD Is Only Detected in Insoluble Glycogen of LD and APBD Mice, and Soluble Glycogen Contains Molecules Varying in CLD and Solubility.

(A) CLDs of total Epm2a−/−, Epm2b−/−, and Gbe1ys/ys versus total WT or total and soluble WT muscle glycogen.
(B) CLDs of soluble and insoluble Epm2a−/−, Epm2b−/−, and Gbe1ys/ys versus total WT muscle glycogen.
(C) Method used to fractionate WT rabbit glycogen by precipitation at various EtOH concentrations and temperatures.
(D) Glycogen recovery in different glycogen fractions described in (C).
(E) CLDs of two glycogen fractions described in (D) and five replicate maltodextrin standards displaying technical variation.
(F) Differential CLDs, comparing the two fractions shown in (E) and a reference fraction (D). Cumulative Δ DP 16–40 is depicted.
(G) Cumulative Δ DP 16–40 between all fractions analyzed and a reference fraction (D).
Data in (A) and (B) are presented as mean (plotted line except for WT glycogen in B) ± SD (shaded area; n = 5–6 animals). Statistical significance was calculated for each DP, comparing the relative abundances between the indicated group (arrow) and the respective WT total glycogen (*p < 0.05; **p < 0.01; ***p < 0.001). See also Figure S2 and STAR Methods.
CLDs of soluble glycogen from the mutants were comparable to those of total glycogen from the respective WT mice (Figure 2B), revealing that the majority of soluble glycogen molecules are normally formed despite the lack of laforin, malin, or GBE1. A shift in CLD toward longer chains was exclusively detected in insoluble glycogen of all three disease models (Figure 2B), consistently linking overly long chains with glycogen insolubility, implying that the control of chain length is crucial for glycogen solubility.
In the disease models we studied, CLDs of total glycogen are a function of the ratio between soluble and insoluble glycogen content and the extent of chain length abnormality of the insoluble fraction. For instance, the CLD of total Gbe1ys/ys glycogen differed most from WT, which is due to (1) the higher amount of insoluble glycogen in these mice and (2) the stronger deviation of the insoluble glycogen CLD from WT. Accordingly, when levels of abnormal insoluble glycogen are low, the total glycogen CLD will be hardly distinguishable from WT (e.g., in young disease model mice).
Note, the CLDs of total glycogen from WT mice differ slightly across the three mouse lines, which could be explained by the use of separately generated and inbred parental strains (see Figure 1D and STAR Methods).
Soluble Glycogen Consists of Molecules with Distinct CLDs and Solubility Properties
In search for an explanation of how soluble glycogen can become insoluble when being structurally so different, we studied soluble glycogen in more depth to test whether subfractions can be found that differ in solubility and average CLD. Glycogen was isolated from WT rabbit muscle and precipitated at different ethanol (EtOH) concentrations and temperatures (Figure 2C). At each temperature, an increase in EtOH concentration led to increased glycogen precipitation (P). Also, at a given EtOH concentration, some glycogen precipitated at higher, some only at lower temperatures. The amount of non-precipitable glycogen remaining in the supernatant (S) increased with decreasing EtOH concentrations. Practically all glycogen remained soluble without adding EtOH (Figure 2D). This proves that soluble muscle glycogen is not homogeneous but can be separated into subfractions that differ in solubility.
CLD was analyzed in 17 fractions, revealing differences in the relative amount of long glucan chains (Figure S2). Glycogen precipitated at room temperature (RT) and 60% EtOH contained the highest amount of long chains (degree of polymerization [DP] 16–40), glycogen remaining soluble at 4°C and 80% EtOH the lowest (Figures 2E and 2F). The cumulative Δ DP 16–40 (see STAR Methods) was calculated for each fraction (Figure 2G) and color coded (Figures 2D and 2G). Precipitated glycogen consistently contained more long chains than the reference glycogen (shades of red), and the supernatant glycogen always contained less (shades of blue).
These results clearly show that the differences in solubility, underlying fractionation of soluble glycogen, can be associated with changes in the amount of longer glucan chains. Under mild conditions (at lower EtOH or higher temperature), only a small proportion of molecules, with a relatively high susceptibility to become insoluble, precipitated. On average, these molecules largely contained longer glucan chains than fractions precipitating at the same EtOH concentration but at lower temperature. Strikingly, at any EtOH concentration, precipitated glycogen contained much longer chains than the glycogen remaining soluble (Figures 2D and S2). We propose that heterogeneity within soluble glycogen could explain the transition from soluble to insoluble glycogen in mutant mice, involving only a small fraction of precipitation-prone (“at risk”) glycogen molecules and leading to a slow accumulation of insoluble glycogen over time. This is consistent with the demonstrated slow accumulation of glycogen throughout the lifetime of the Epm2a−/− mouse model (Tagliabracci et al., 2008). A constant precipitation rate of around 0.3%–1.1% and around 2% of soluble muscle glycogen per day would be sufficient to explain the amount of insoluble glycogen, which accumulates in LD (assuming that insoluble glycogen amounts to 1- to 3-fold of the soluble within 9–12 months) and Gbe1ys/ys mice (assuming that insoluble glycogen amounts to 4-fold of the soluble within 6 months), respectively. Note, these estimated precipitation rates are based on the assumption that precipitated glycogen is metabolically inert, i.e., does not undergo significant turnover. The demonstration of at risk molecules in the soluble fraction further supports the recent hypothesis wherein the laforin-malin complex specifically limits GYS activity at at-risk sites instead of globally affecting GYS activity or amount (Sullivan et al., 2017). Treatment approaches aiming at lowering GYS1 activity globally would include a reduced formation of at risk sites as elongation:branching ratio is generally decreased. For instance, Gbe1ys/ys mice treated for 12 months with GYS1 inhibitor guaiacol showed reduced polyglucosan bodies when compared to untreated animals (Kakhlon et al., 2018). As PB quantity was not compared before and after treatment, it remains unclear whether the observed difference in PB quantity was exclusively due to treatment-dependent halting of PB formation or whether some form of polyglucosan degradation occurred. Nevertheless, it was shown that, in cell culture, guaiacol treatment was able to reduce glycogen that was deemed amylase resistant under the experimental conditions (Solmesky et al., 2017; Kakhlon et al., 2018). Whether this effect is attributable exclusively to GYS1 inhibition remains to be determined.
Glycogen Molecule Size Has a Role in Glycogen Solubility
Molecule size distributions (MSDs) of total, soluble, and insoluble glycogen prepared from muscle of Epm2a−/−, Epm2b−/−, and Gbe1ys/ys mice were determined. In WT mice, the MSD for both total and soluble glycogen showed monomodal distributions with hydrodynamic radii of 5–20 nm, and MSDs of total glycogen differed significantly between WT and mutants (Figures 3A-3C). Consistent with the CLD results, the soluble glycogen from all mutants resembled that of their respective WT controls (Figures 3D-3F), with a small but significant shift toward larger molecules in Gbe1ys/ys mice only (Figures 3F and 3G). Insoluble glycogen differed from soluble mutant and WT glycogen in all three mouse lines, exhibiting broader or even bimodal MSDs. There was an enrichment of smaller molecules in all mutants, especially in Gbe1ys/ys mice, and larger molecules were only enriched in Epm2a−/− and Epm2b−/− mice (Figures 3D-3F and 3H).
Figure 3. Insoluble Glycogen from LD and APBD Mice Contains a Broader Glycogen MSD Compared to the Respective Soluble Fraction.

(A-C) MSDs of total Epm2a−/− (A), Epm2b−/− (B), and Gbe1ys/ys (C) versus total and soluble WT (A and B) or total WT (C) muscle glycogen.
(D-F) MSDs of soluble and insoluble Epm2a−/− (D), Epm2b−/− (E), and Gbe1yS/ys (F) versus total WT muscle glycogen.
(G) Differences in the mean abundance of molecule sizes between soluble mutant and total WT muscle glycogen.
(H) Differences in the mean abundance of molecule sizes between insoluble and soluble mutant muscle glycogen.
Data are presented as mean (plotted line except for WT glycogen in D–F) ± SD (shaded area; n = 4–6 animals). Note, a logarithmic x axis facilitates visualization of smaller radii but skews quantitative comparison of small and large molecules. Statistical significance (indicated by gray scale bars) was calculated, comparing the mean abundance of molecule sizes of indicated groups (arrow) with the total glycogen from the respective WT mice (A–G) or with the soluble glycogen from the respective mutant mice (H; *p < 0.05; **p < 0.01; ***p < 0.001).
Note that the vast majority of insoluble molecules, including those from Gbe1ys/ys mice, have hydrodynamic radii >3 nm. A glycogen molecule of 20-nm radius has a molecular weight of around 107 g/mol, which equates to around 62,000 glucosyl units (162.1 g per mol glucosyl unit; Wanson and Drochmans, 1968; Sullivan et al., 2010). Assuming a similar amount of glucosyl units per molecule volume, insoluble molecules of 3 nm in diameter contain at least around 200 glucosyl units. The vast majority of chains in insoluble molecules having a chain length below 30 glucosyl units (Figure 2), the assembly of 200 glucosyl units requires at least 6 branching points, which are cleaved when the chain length distribution is analyzed (see STAR Methods). Therefore, the majority of insoluble glycogen resembles soluble glycogen in being composed of branched chains of glucosyl units. This supports the idea that precipitated glycogen molecules originate from the soluble fraction. However, precipitation is apparently not equal across all molecule sizes, suggesting a higher risk to precipitate at certain stages of glycogen molecule synthesis, clearly confirming a role of glycogen molecule size in glycogen solubility. However, it is unclear why the risk to precipitate is increased for molecules of non-average sizes and why particularly for small molecules in Gbe1ys/ys mice.
Studying GYS1 and GBE1 in LD and APBD Mice Reveals Compensatory Mechanisms
The relative levels and activities of GYS1 and GBE1, key enzymes of glycogen metabolism, were assessed. Total GYS1 protein was enriched in all three mutants, and total GBE1 was enriched in Epm2a−/− and Epm2b−/− but strongly diminished in Gbe1ys/ys mice (Figure 4A). The protein levels of soluble GYS1 were not changed in Epm2a−/− and Epm2b−/− mice (Figures 4A and 4B) nor were soluble GYS1 activity and activation state (Figure 4C). Intriguingly, soluble GBE1 level and activity were significantly elevated in Epm2b−/− mice but unchanged in Epm2a−/− mice (Figures 4A and 4C). This could mean that GBE1 is one of malin’s substrates for proteasomal degradation or autophagy and suggests an unknown compensatory mechanism involving GBE1 to counteract insoluble glycogen formation.
Figure 4. Muscle GYS1 and GBE1 Levels and Activities Are Decreased in Gbe1ys/ys, and Muscle GBE1 Level and Activity Are Increased in Epm2b−/−.

(A) Protein levels of total and soluble GYS1 and GBE1 in Epm2a−/−, Epm2b−/−, and Gbe1ys/ys mice by western blot.
(B) Protein level quantification of soluble GYS1 and GBE1 shown in (A).
(C) Activity and activation state of soluble GYS1 in Epm2a−/−, Epm2b−/−, and Gbe1ys/ys mice.
(D) Activity of soluble GBE1 in Epm2a−/−, Epm2b−/−, and Gbe1ys/ys mice.
(E) GBE1 expression in Gbe1ys/ys mice by western blot, comparing total and soluble GBE1.
(F) Summary of functional and structural characteristics of glycogen metabolism in Epm2a−/−, Epm2b−/−, and Gbe1ys/ys mice.
Data are presented as mean + SD (n = 6 animals). Statistical significance was calculated, comparing mutant and respective WT (*p < 0.05; **p < 0.01; ***p< 0.001). See also Figure S3.
In Gbe1ys/ys mice, soluble GBE1 level and activity were dramatically reduced (Figures 4A, 4B, and 4D). A less pronounced reduction in total GBE1, in both embryos and adult animals, was described previously in the selfsame mouse line (Orhan Akman et al., 2015). The strong effect we see on GBE1 protein level was evidentially not due to the slight discrimination between WT and mutant GBE1 by our GBE1 antibody (Figure S3). Moreover, the equally low soluble GBE1 protein and activity levels strengthen our western blot results. We could confirm the reported protein-destabilizing effect of p.Y329S (Froese et al., 2015), which was even more severe in mouse than in human GBE1 (Figure S3). This is in line with the higher residual GBE1 activity of 10%–20% in humans, compared to mice with the same mutation (Mochel et al., 2012), and may partially explain the discrepancy between LD and APBD mice and patients, respectively, regarding phenotypic severity.
In Gbe1ys/ys mice, soluble GYS1 protein level and activity were also significantly decreased (about 50%), the GYS1 activation state being unaffected (Figures 4A–4C). This was not reported in the previous study using these mice (Orhan Akman et al., 2015), which showed no significant change in total GYS1 levels and did not determine GYS1 level or activity in the soluble fraction. As reduced branching results in longer chains, likely causing pathological PB formation, GYS1 downregulation could be a compensatory mechanism in Gbe1ys/ys mice to limit glycogen chain elongation. The question of how GBE1 is regulated and how an imbalance between GBE1 and GYS1 activity is potentially sensed remains unanswered, but in this model of APBD, changes in GYS1 phosphorylation seem not to be involved (Figure 4C). Nevertheless, in a previously described neuronal model with GBE1 knockdown (Kakhlon et al., 2013) and in embryonic muscle of GBE1 knockout mice (Akman et al., 2011), total GYS1 activity was increased apparently due to reduced GYS1 phosphorylation. In these models, GYS1 upregulation might contribute to an exacerbated pathogenicity of GBE1 deficiency in the CNS and in GBE1 KO mouse embryos, respectively.
Lastly, total GBE1 was enriched in Gbe1ys/ys mice when compared to the soluble (Figure 4E), pointing to an association of GBE1 with insoluble glycogen. The enrichment of total GYS1 in all mutants and of total GBE1 in the LD models, all in comparison to their respective WT (Figure 4A), also supports an interaction of both proteins with PB glycogen, which was so far only reported for GYS1 in the LD context (DePaoli-Roach et al., 2010; Turnbull et al., 2010; Valles-Ortega et al., 2011; Wang et al., 2013). Our results are summarized in Figure 4F.
Limitation of the Study
Due to the difficulties of obtaining enough soluble and insoluble glycogen from brain tissue, we were limited to using muscle tissue. Previously published data indicate that the general effects, for instance, of laforin or malin deficiency, on glycogen are very similar in brain and muscle tissue. The following observations were made in both tissues: (1) PASD-positive polyglucosan bodies; (2) glycogen accumulation in concurrence with hyperphosphorylation and abnormal branching; and (3) glycogen hyperphosphorylation does not lead to polyglucosan bodies when phosphatase-inactive laforin is expressed, and (4) formation of polyglucosan bodies is prevented in LD mouse models when PTG or GYS1 is genetically removed. Although the effects of accumulations of insoluble glycogen on the tissue function may very well be tissue dependent, our current study aims to reveal general mechanisms that underlie the formation of insoluble glycogen, which occurs in both brain and muscle and seems to be effected by similar (if not the same) factors in both tissues. Future work allowing analysis of the small amount of brain glycogen would be useful as both LD and APBD are predominantly neurological diseases. Including different age groups would also give us a broader understanding of pathogenesis.
STAR⋆METHODS
CONTACT FOR REAGENT AND RESOURCE SHARING
Further information and requests for resources and reagents should be directed to and will be fulfilled by the Lead Contact, Felix Nitschke (felix.nitschke@sickkids.ca).
EXPERIMENTAL MODEL AND SUBJECT DETAILS
Animals
Laforin- and malin-knockout mice, Epm2a−/− (mixed C57BL/6 and 129Svj genetic background; Ganesh et al., 2002) and Epm2b−/− (mixed C57BL/6Ncr and 129S6/SvEvTac genetic background; Turnbull et al., 2010), respectively, as well as GBE1-deficient mice, Gbe1ys/ys, carrying the most common GBE1 mutation p.Y329S (mixed 129S5/SvEvBrd and C57BL/6 genetic background; Orhan Akman et al., 2015) have been previously described. WT and mutant mice were littermates from heterozygous breeding, and both sexes were used with no indication of a disease phenotype-related sex-difference. Genotyping primers are provided in Table S1. Mouse ages of male and female mice were 10–13 months (Epm2a−/−), 15 months (Epm2b−/−), and 6 months (Gbe1ys/ys) (see Figure 1D). Mice were housed with environmental enrichment in ventilated cages at 20–22°C and fed a commercially available diet with water accessible ad libitum. Healthy animals that did not undergo any previous procedure or treatment were sacrificed by cervical dislocation and the hind limb muscle was either immediately frozen in liquid nitrogen or fixed for at least 48 h in 10% buffered formalin before embedding in paraffin. Frozen tissue from mice and 6 months old male rabbits (Nitschke et al., 2013) was stored at −80°C until use. All animal procedures were approved by The Centre for Phenogenomics Animal Care Committee and are in compliance with the Canadian Council for Animal Care Guidelines and the OMAFRA Animals for Research Act.
Cell lines
HEK293FT cells (female human embryonic kidney) were cultured in DMEM containing 10% (v/v) FBS, 100 U/mL penicillin and 100 μg/mL streptomycin, being maintained at 37°C in a humidified 5% CO2 incubator.
METHOD DETAILS
Histology
Paraffin-embedded muscle tissue was sectioned and stained using the periodic acid-Schiff diastase (PASD) method. Sectioning and staining was performed by The Centre for Phenogenomics Pathology Services, Toronto, Canada. Stained slides were scanned using a Pannoramic digital slide scanner (20x objective; 3DHistech) and representative images were taken.
Separation of soluble and insoluble muscle glycogen
The procedure used to separate soluble from insoluble glycogen roughly comprises the following steps: 1) complete homogenization of the tissue, 2) separation of soluble and insoluble material by centrifugation, and 3) multiple cycles of washing the insoluble material to completely remove contaminants derived from the soluble fraction (Figure 1F). Approximately 400 mg of frozen ground muscle tissue from Epm2a−/−, Epm2b−/−, Gbe1ys/ys and the corresponding WT mice were aliquoted on dry ice into 13 mL round-bottom homogenization tubes. After adding 4 mL of cold glycogen isolation buffer (GIB; 50 mM Tris, pH 8, 150 mM NaCl, 2 mM EDTA, 50 mM NaF, 5 mM sodium pyrophosphate), samples were homogenized on ice using a tissue homogenizer (TissueRuptor II, QIAGEN). Two 1.5 mL aliquots of homogenate were centrifuged at 4°C and 13,000 × g for 10 min. The supernatants were combined (Supernatant 1, S1), with the last approximately 100 μL being discarded to avoid any contamination of the supernatant with the pellet. The pellets were repeatedly washed by resuspension in 1.5 mL GIB and subsequent centrifugation (see above). The fifth supernatants were combined (Supernatant 5, S5), also discarding the last approximately 100 μL, and the pellets resuspended in 1.5 mL GIB and combined (Pellet). Of each fraction (Homogenate, S1, S5, Pellet) a 30 μL aliquot was taken for glycogen content analysis, the remainder being frozen immediately until being used for glycogen extraction.
Glycogen extraction and purification
Glycogen was extracted essentially using a procedure described previously (Suzuki et al., 2001). The thawed fractions (Homogenate, S1, Pellet, see above) were aliquoted into 1.5 mL screw-cap tubes prior to adding equal volumes of 60% (w/v) KOH. After incubating the samples for 1 h at 95°C with intermittent mixing, solubilized glycogen was precipitated three times (overnight at −20°C, 67% ethanol and 15 mM LiCl). Glycogen pellets were dissolved in water, those deriving from the same fraction being combined for further analyses (henceforth purified glycogen).
Quantification of glycogen
Glycogen content in aqueous solutions was determined as glucose after subjecting an aliquot to either enzymatic digestion using amyloglucosidase or to acid hydrolysis (explained in detail below). Non-glycogen-associated (free) glucose in glycogen samples was quantified without prior glycogen degradation and found to be negligible in muscle homogenate as well as in purified glycogen preparations.
Digestion method A was used to digest glycogen in aliquots derived from the glycogen separation method described above (Homogenate, S1, S5, Pellet) in a total volume of 100 μL: 30 μL aliquots of each fraction were topped up to 72.5 μL with GIB (see above), mixed with 22.5 μL acetate mix (1:8 mixture of 10% acetic acid:200 mM sodium acetate buffer (pH 4.5)) and 5 μL amyloglucosidase, and finally incubated at 50°C for 30 min. Digestion method B was used to digest aliquots of purified glycogen in a total volume of 100 μL: aliquots were topped up to 50 μL with water, mixed with 40 μL of 200 mM sodium acetate buffer (pH 4.5) and 10 μL of a 1:20 diluted solution of amyloglucosidase, and finally incubated at 55°C for 1 h. Control digests, containing only GIB (method A) or water (method B), were analyzed to account for free glucose in the amyloglucosidase preparation. Acid hydrolysis of glycogen was performed to release C6 phosphorylated glucosyl residues from purified glycogen (0.7 M HCl, 3 h at 95°C) and was followed by neutralization using 5 M KOH.
After centrifugation (room temperature (RT), 16,000 × g, 20 min), glucose levels were determined in supernatants of resulting digests or hydrolysates as well as of undigested samples using a previously reported method (Lowry and Passonneau, 1972) in a 96-well format. All glycogen samples as well as seven serially diluted D-glucose standards were mixed with 170 μL of glucose-6-phosphate dehydrogenase (G6PDH) reaction mix (150 μL of 200 mM tricine/KOH (pH 8), 10 mM MgCl2; 18 μL of deionized water; 1 μL of 112.5 mM NADP; 1 μL of 180 mM of ATP; 0.5 U of G6PDH (Roche). After recording the background absorbance for 20 min at 340 nm, 4 μL of hexokinase (HK; 0.75 U in 4 μL of 200 mM tricine/KOH (pH 8), 10 mM MgCl2) was added to each well, and again the absorbance was recorded for 30 min at 340 nm. The average background absorbance was subtracted from the absorbance plateau after completion of the HK/G6PDH reaction. The glucose standard curve was used to calculate the glucose concentration in the samples. Glucose determination was performed in duplicates for each digest and standard. This assay highly reproducibly detects 0.25 to 30 nmol glucose per well with absorbance-concentration correlation coefficients R2 > 0.999.
Quantification of glycogen C6 phosphate
Glycogen C6 phosphate (GC6P) was used as a proxy for total phosphate esterification of glycogen because the ratio between total glycogen phosphate and GC6P seems to be invariable across genotypes, including disease model mice (DePaoli-Roach et al., 2015). GC6P was determined by measuring glucose-6-phosphate (G6P) in neutralized hydrolysates of purified glycogen samples using the enzymatic cycling assay previously described (Nitschke et al., 2013). Briefly, aliquots of hydrolysates, containing up to 30 nmol glucose, as well as authentic G6P standards were adjusted with water to 25 μL. After adding 20 μL of buffer A (50 mM tricine/KOH (pH 8.0), 2.5 mM MgCl2, and 0.325 mM NADP), the mixture was equilibrated at 30°C for 10 min. 10 μL of 0.25 M HCl were added, followed by 10 min incubation at 30°C and neutralization with 10 μL of 0.25 M NaOH. Subsequently, 20 μL of buffer B (50 mM tricine/KOH (pH 8.0), 0.6 μg BSA, 0.043 U G6PDH (Roche)) were added, followed by incubation at room temperature (RT) for 10 min. Finally, 20 μL of 0.5 M NaOH were added prior to incubation for 5 min at 95°C, cooling in ice water, and neutralization with 20 μL of 0.5 M HCl. In a cold room the entire mixture was transferred to a clear 96-well plate. Then 80 μL of freshly prepared buffer C (200 mM tricine/KOH (pH 8.0), 0.279 mg EDTA, 0.0195 mg PMS, 0.162 mg G6P, 0.063 mg MTT, 0.0765 mg BSA, and 6 U G6PDH (Sigma)) were added and absorbance (570 nm) was recorded in 1 min intervals for 2 h at 30°C. Linear ranges of formazan formation were used to correlate G6P standards with samples of unknown G6P contents.
Glycogen fractionation using different ethanol concentrations and temperatures
Ethanol (EtOH) precipitation is a common technique used to purify glycogen. EtOH deprives the glycogen of the water molecules needed to form hydration shells that prevent the glucan chains from interacting, forming crystalline structures and precipitating (Jouyban et al., 2004).
A fractionation method for glycogen was developed that uses different EtOH concentrations and temperatures to investigate solubility properties and average chain length distributions (CLDs) in glycogen subfractions (Figure 2C). The aim was to fractionate only soluble glycogen. Large amounts of glycogen were isolated from WT rabbit muscle tissue as previously described (Tagliabracci et al., 2008). The glycogen was further purified by five rounds of EtOH precipitation (each 67% EtOH, 15 mM LiCl, > 1 h, −20°C) and subsequent ultra-filtration with 100 kDa cut-off (MilliporeSigma) to remove low molecular contaminants and salt. 1 mL aliquots containing 500 μg of rabbit glycogen were mixed with varying amounts of 100% EtOH to reach 0, 30, 40, 50, 60, 70 and 80% (v/v) and left to precipitate for 24 h on a rotator at RT. Following centrifugation (20 min, RT, 16,000 × g), the supernatants were transferred to new tubes and left to precipitate for 24 h on a rotator at 4°C, the pellets (P1) stored at −20°C until further use. Following centrifugation (20 min, 4°C, 16,000 × g), the supernatants were transferred to new tubes and left to precipitate for 24 h at −20°C, the pellets (P2) stored at −20°C until further use. Following centrifugation (20 min, 4°C, 16,000 × g), the supernatants (S) were dried using a SpeedVac, the pellets (P3) stored at −20°C until further use. After dissolving P1, P2, P3 and dried S in water, glycogen was quantified in all fractions. At any EtOH concentration, the overall glycogen recovery (P1, P2, P3 and S together) was > 98%. In two cases fractions were pooled prior to chain length analysis: 1) glycogen found in P3 and S at 0% EtOH, 2) glycogen found in P3 and S at 80% EtOH. The pooled fraction from 0% EtOH P3 and S was practically unprecipitated and served as reference fraction during chain length analyses.
Chain length distributions
Purified muscle glycogen from mouse or rabbit (10–20 μg) was completely debranched by incubating overnight at 37°C with 200 U isoamylase in 110 μL 10 mM sodium acetate (pH 5). The enzyme was inactivated by heating at 95°C for 10 min. Samples were centrifuged (10 min, 20,000 × g) and 90 mL of the supernatant were applied to high performance anion exchange chromatography with pulsed amperometric detection (HPAEC-PAD, ThermoFisher, ICS5000). Oligoglucan chains were separated as described previously (Nitschke et al., 2017) and chromatograms analyzed with Dionex Chromeleon 7.2. The relative peak areas for each chain length (degree of polymerization, DP) were determined and, for total glycogen and fractions of soluble and insoluble glycogen, averaged among at least 5 biological replicates. Relative peak areas of each DP derived from rabbit glycogen fractions (obtained by precipitation at different EtOH concentrations and temperatures, Figure 2C) were correlated to the reference fraction (0% EtOH, combined P3 and S, see above) by subtracting the corresponding relative peak areas of the latter, resulting in differential Chain length distributions expressed as “Δ relative peak areas.” Changes in the abundance of long chains were assessed by adding all “Δ relative peak area” values in the range of DP 16 to 40, resulting in “cumulative Δ DP 16–40” values. Color-coding of “cumulative Δ DP 16–40” values was achieved by setting the smallest value to blue (RGB [0,0,255]), the reference to purple (RGB [127,0,128]), the highest value to red (RGB [255,0,0]), and obtaining colors of intermediate values by linear interpolation of the RGB parameters (Figure S2Q).
Molecular size distributions
To obtain Molecular size distributions (MSDs) of purified muscle glycogen from Epm2a−/−, Epm2b−/− and Gbe1ys/ys mice and their respective WT controls, size exclusion chromatography (SEC) was performed (Sullivan et al., 2014). SEC separates molecules by their size, given as hydrodynamic radius (Rh) Hamielec and Ouano, 1978). An aqueous system (50 mM sodium nitrate, 0.02% sodium azide (w/w)) was employed as the mobile phase, as previously described (Deng et al., 2015; Sullivan et al., 2014). Glycogen samples were fully dissolved in the sodium nitrate/sodium azide solution at concentrations between 0.5–1 mg/mL at 60°C for 4 h and then injected into an Agilent 1260 infinity SEC system (Agilent, Santa Clara, CA, USA) with SUPREMA columns (pre-column, 1000 and 10 000, Polymer Standards Services, Mainz, Germany). The columns were set to a flow rate of 0.3 mL/min at 60°C. A universal calibration curve was constructed using linear pullulan standards with a molar mass range of 342 to 7.08 × 10⁵ and Mark-Houwink parameters of K = 0.010176 mL/g and a = 0.525, using the procedure described previously (Vilaplana and Gilbert, 2010). SEC weight distributions were obtained using a refractive index detector (Optilab UT-rEX, Wyatt, Santa Barbara, CA, USA), giving the relative total arbitrary weight of molecules (the glycogen amount) for each given size (Rh). In order to obtain statistically comparable distributions, the original distributions were transformed to obtain consolidated Rh values, which means each sample had identical Rh values without changing the resolution (number of Rh values). Consolidation was achieved by calculating the weight value (y axis) corresponding to a specific (consolidated) Rh value by linear interpolation between the closest two original X,Y data points. Hence, for each consolidated Rh value, a corresponding interpolated weight value was calculated. This transformation did not affect the position or shape of the size distribution. Average weight values (glycogen amounts) were calculated for at least 4 biological replicates. Changes in the abundance of certain molecule sizes were assessed by subtracting average distributions as indicated.
Overexpression of different GBE1 constructs in HEK293FT cells
Murine GBE1 cDNA (GenBank: NM_028803) in the CMV6-entry vector was purchased (Origene#MR210139) and site-directed mutagenesis was conducted to change codon 329 from TAT [Y] to TCT [S]. The C-terminal Myc-DDK sequence was removed in both plasmids, a TGA (stop) codon added at the end of the open reading frame, and an N-terminal Myc-Xhol site sequence integrated between the Kozak sequence and the translation start site, using gBlocks (Integrated DNA Technologies) and the In-Fusion cloning kit (Clontech), yielding our Myc-mGbe1 and Myc-mGbe1ys constructs. The cDNA sequence of human GBE1 (GenBank: NM_000158) obtained from Dharmacon (#MHS6278–202831856), was inserted into the pCMV6-entry vector backbone and site-directed mutagenesis was conducted to change codon 329 from TAC [Y] to TCC [S], yielding our Myc-hGbe1 and Myc-hGbe1ys constructs. The final vector sequences were confirmed by Sanger sequencing (The Centre for Applied Genetics, The Hospital for Sick Children, Toronto, Canada), using primers provided in Table S1. HEK293FT cells (see above) were cultured as described above and transfected when 80% confluent in 6-well plates using the Lipofectamine 3000 Transfection Reagent according to the manufacturer’s recommendations. Co-transfection of the Myc-GBE1 constructs with a pmaxGFP vector containing eGFP (molar fraction of total transfected DNA = 0.1) enabled transfection efficiency-independent comparison of the expression of Myc-GBE1 protein variants. Myc:GFP immune signal ratios were compared to assess the expression of the GBE1 fusion protein. GBE1/GFP: Myc/GFP signal ratios were compared to assess recognition efficiency of our GBE1 antibody against the different GBE1 proteins.
Protein analyses
Lysate preparation
80–100 mg of frozen ground mouse muscle tissue was aliquoted on dry ice and homogenized on ice in 100 μL per 10 mg tissue extraction buffer (50 mM Tris, pH8.0,1 mM EDTA, 1 mM EGTA, 50 mM NaF, 10 mM Na beta-glycerol phosphate, 5 mM Na pyrophosphate, 2 mM DTT, protease inhibitor cocktail, phosphatase inhibitor cocktail) using a tissue homogenizer (TissueRuptor II, QIAGEN). Aliquots of the total lysate (containing total GYS1 and total GBE1, irrespective of their association with insoluble material) were transferred to a new vial and frozen on dry ice, and the remainder was centrifuged (20 min, 4°C, 16,000 × g) to remove insoluble material. The resulting supernatant (containing soluble GYS1 and soluble GBE1) was aliquoted and frozen on dry ice until further use. The remaining pellet contains the proteins associated with insoluble material but was not separately analyzed. Transfected HEK293FT were scraped on ice into RIPA buffer (150 mM NaCl, 20 mM Tris (pH 8), 1% (v/v) Triton X-100, 0.1% (w/v) SDS, 12.1 mM deoxycholate), incubated on ice for 10 min with thorough vortexing before, after 5 min and after 10 min. Lysates were then centrifuged (20 min, 4°C, 16,000 × g), the supernatant was collected, aliquoted and frozen on dry ice. Protein content was determined using the DC Protein assay (Bio-Rad).
Immunodetection of proteins
Equal amounts of protein were denatured in Laemmli SDS sample buffer before loading equal volumes (containing 5–15 mg total protein from muscle lysates, 2 μg from HEK293FT cell lysates) alongside with Precision Plus Protein Dual Color Standards (Bio-Rad) for separation on SDS-PAGE gels (10% separation gel, 4% stacking gel). Separated proteins were transferred to activated PVDF membranes via wet transfer at 4°C overnight. After cutting membranes for simultaneous detection of housekeeping proteins, the standard immunodetection protocol included blocking in 5% (w/v) non-fat milk (Bio-Rad) for 1 h, the addition of primary antibodies, incubation for 1 h at RT, incubation with secondary antibody in 5% milk for 1 h, and visualization of horseradish peroxidase (HRP) activity applying the Clarity Western ECL Substrate (Bio-Rad) and using a ChemiDoc gel imager (Bio-Rad). The following dilutions of primary antibodies were used: anti-GYS (1:2000), anti-GBE1 (1:2000), anti-GAPDH (1:1000), anti-Actin (1:5000), anti-GFP (1:4000), and anti-Myc (1:1000). Both secondary antibodies were diluted 1:4000. After chemiluminescence imaging the membrane was washed 3× 1 min with water before being incubated for 10 min in Coomassie Blue Fast Stain solution (GeneCopoeia) on a plate shaker. Subsequently the membrane was washed 3× 1 min and then left in water overnight before drying it completely and imaging it using a ChemiDoc gel imager. Signal densitometry was performed using ImageLab (Bio-Rad). Background-corrected Coomassie signals have been shown to be accurate loading controls (Welinder and Ekblad, 2011), those in the vicinity of the immunodetected protein indicated optimal protein transfer, and were used for signal normalization.
GYS1 activity assay
GYS1 activity was determined in the supernatant of muscle lysates (soluble GYS1) of Epm2a−/−, Epm2b−/− and Gbe1ys/ys mice and their respective WT controls (6 biological replicates per group) in the presence of both low (0.17 mM)and high (8 mM) glucose 6-phosphate (G6P). G6P is an allosteric GYS activator and is able to completely override the inhibitory effect of GYS phosphorylation. At high G6P concentrations the enzyme becomes fully active and total GYS activity is determined. By measuring activity at low and high G6P concentrations the activation state of GYS can be gauged and is usually expressed as the ratio of activities measured at low and high G6P concentrations (Guinovart et al., 1979; Roach et al., 2012). A total reaction volume of 50 μL contained 50 mM Tris (pH 8), 20 mM EDTA, 25 mM KF, 2 mg/ml glycogen, 8 mM or 0.17 mM G6P, 1.65 mM UDP-[14C]-glucose (1,210 CPM/nmol), 1 mM UDP-glucose, and 50 mg soluble lysate protein. These samples were incubated at 30°C for 30 min and the reaction was terminated by adding 100 μL cold 100% EtOH and transferred into a 96-well filter plate (MilliporeSigma) and EtOH was removed using a vacuum. Five consecutive washes were performed with 150 μL of cold EtOH (66% v/v) followed by drying in a37°C incubator for 30 min. Scintillation fluid (50 μL, PerkinElmer) was added to each well and the 14C signal was read using the TopCount microplate scintillation and luminescence counter (PerkinElmer) (Solmesky et al., 2017).
GBE1 activity assay
GBE1 activity was determined in the supernatant of muscle lysates (soluble GBE1) of Epm2a−/−, Epm2b−/− and Gbe1ys/ys mice and their respective WT controls using an adjusted method previously described (Almstrup et al., 2000) that measures the stimulation of phosphorylase-mediated glucan chain elongation by incorporation of branching points. As the velocity of the phosphorylase reaction greatly depends on the glycogen concentration, we determined the glycogen content in all lysates and adjusted all lysates to equal glycogen concentrations by adding appropriate amounts of tissue extraction buffer (see Lysate preparation). Subsequently, aliquots of the glycogen-adjusted lysates were heat-denatured (10 min, 95°C) and mixed with non-denatured glycogen-adjusted lysate to obtain glycogen-adjusted lysates with 0.4 and 0.8 μg/μL of active protein. The complete assay mixture of 50 μL consisted of 30 μL master mix (267 mM citrate (pH 7), 1.667 mM AMP, 3.333 mg/mL phosphorylase a (7.4 U/mg)), 10 μL glycogen- and protein-adjusted lysate (for each tissue lysate 8, 4, and 0 μg/μL active protein at constant 2.5 nmol glucose equivalents of endogenous glycogen), and 10 μLG1Pmix(250 mM glucose 1-phosphate, 0.011 μCi/μL [14C]-glucose 1-phosphate, 200 mM citrate buffer (pH 7)). After 10 min of pre-incubation of the master mix with the lysate at 30°C the G1P mix (equilibrated to RT) was added to start the reaction. 10, 20, 30, and 40 min after starting the reaction a 2 μL aliquot was spotted on TLC silica gel 60 sheets. Separation of mobile [14C]-glucose 1-phosphate from immobile labeled glycogen was achieved during at least 1.5 h of chromatography using an eluent consisting of n-butanol:isopropanol:acetic acid:H2O (3:12:4:4). Radiolabel on TLC sheets was imaged using a Typhoon FLA 7000 phosphoimager (GE Healthcare Life Sciences), and signals were quantified using ImageQuant (GE Healthcare Life Sciences). Within 40 min of reaction the consumption of [14C]-glucose 1-phosphate was always < 15%. Radiolabel incorporation rates into glycogen were determined as the slopes across all four selected time points, corrected for the rate in the absence of active protein determined in the same lysate, and normalized to the amount of active protein used. Protein-based incorporation rates using 4 or 8 μg active protein were similar and used to calculate an average GBE1-dependent glucose incorporation rate (GBE1 activity) for each animal. Activities were then averaged across six biological replicates.
QUANTIFICATION AND STATISTICAL ANALYSIS
Except where stated otherwise, all analyses were conducted in at least five biological replicates (animals). Data are presented as averages with standard deviations (SD) calculated as indicated. Groups of biological replicates were compared using one-way analysis of variance (ANOVA) followed by post hoc analysis using homoscedastic Student’s t- or heteroscedastic Welch’s tests, both unpaired, two-tailed, and with Holm-Bonferroni correction. The adequate post hoc test was selected based on equal or unequal variances of groups tested with F-tests. Significance levels are indicated by asterisks (*p < 0.05, **p < 0.01, ***p < 0.001). For glycogen CLD and MSD analyses, significance between genotypes was tested for each individual degree of polymerization and hydrodynamic radius, respectively.
Supplementary Material
KEY RESOURCES TABLE.
| REAGENT or RESOURCE | SOURCE | IDENTIFIER |
|---|---|---|
| Antibodies | ||
| Rabbit monoclonal anti-GYS [15B1] | Cell Signaling | Cat# 3886; RRID: AB_2116392 |
| Rabbit monoclonal anti-GBE1 [EP11113] | Abcam | Cat# ab180596; RRID: AB_2801267 |
| Mouse monoclonal anti-GAPDH [G9] | Santa Cruz Biotech | Cat# sc-365062; RRID: AB_10847862 |
| Mouse monoclonal anti-c-Myc [9E10] | Santa Cruz Biotech | Cat# sc-40; RRID: AB_627268 |
| Rabbit monoclonal anti-GFP [E385] | Abcam | Cat# ab32146; RRID: AB_732717 |
| Mouse monoclonal anti-Actin | BD Transduction Laboratories | Cat# 612657; RRID: AB_399901 |
| Goat polyclonal anti-Mouse IgG-HRP | Santa Cruz Biotech | Cat# sc-2005; RRID: AB_631736 |
| Donkey polyclonal anti-Rabbit IgG-HRP | Thermo Fisher Scientific | Cat# 31458; RRID: AB_228213 |
| Biological Samples | ||
| Rabbit muscle tissue | Nitschke et al., 2013 | N/A |
| Chemicals, Peptides, and Recombinant Proteins | ||
| Isoamylase | Sigma-Aldrich | 08124 |
| Amyloglucosidase (3.26 U/mL) | Megazyme | E-AMGDF-40ML |
| Glucose-6-Phosphate Dehydrogenase (G6PDH) from Leuconostoc | Sigma-Aldrich | G5760 |
| Glucose-6-Phosphate Dehydrogenase (G6PDH) from Leuconostoc | Roche | 1016587001 |
| Hexokinase (HK) from yeast “overproducer” | Roche | 11426362001 |
| Phosphorylase a from rabbit muscle | Sigma-Aldrich | P1261 |
| Precision Plus Protein Dual Color Standards | Bio-Rad | 1610374 |
| Coomassie Blue Fast Stain solution | GeneCopoeia | P001 |
| DMEM | Wisent | 319-005-CL |
| Fetal bovine serum (FBS) | Wisent | 095150 |
| Penicillin/Streptomycin (100x) | Wisent | 450-201-EL |
| 3-(4,5-dimethylthiazol-2-yl)-2,5-diphenyltetrazolium (MTT) | Sigma-Aldrich | M2128 |
| Phenazine-methosulfate (PMS) | Sigma-Aldrich | P9625 |
| Adenosine 5′-monophosphate (AMP) | Sigma-Aldrich | A1752 |
| Adenosine 5′-triphosphate (ATP) | Roche | 10127523001 |
| Nicotinamide adenine dinucleotide phosphate (NADP) | Roche | 10128058001 |
| Glucose-6-phosphate (G6P) | Sigma-Aldrich | G7879 |
| Glucose 1-phosphate (G1P) | Sigma-Aldrich | G7000 |
| α-D-[14C]-glucose 1-phosphate | American Radiolabeled Chemicals | ARC0310 |
| UDP-[14C]-glucose | American Radiolabeled Chemicals | ARC0154 |
| Microscint 0 scintillation fluid | PerkinElmer | 6013611 |
| Protease inhibitor cocktail | Roche | 11836170001 |
| Phosphatase inhibitor cocktail | Roche | 04906837001 |
| Blotting Grade Blocker Non-Fat Dry Milk | Bio-Rad | 1706404 |
| Critical Commercial Assays | ||
| Clarity Western ECL Substrate | Bio-Rad | 170-5061 |
| In-Fusion cloning kit | Clontech | 638909 |
| DC protein assay kit II | Bio-Rad | 5000112 |
| Lipofectamine 3000 Transfection Reagent | Thermo Fisher Scientific | L3000008 |
| Experimental Models: Cell Lines | ||
| HEK293FT | Thermo Fisher Scientific | R70007 |
| Experimental Models: Organisms/Strains | ||
| Mouse: Epm2a−/−: (B6.129-Epm2atm1.1Kzy) | Ganesh et al., 2002 | N/A |
| Mouse: Epm2b−/−: (B6-Nhlrc1tm1Bmin) | Turnbull et al., 2010 | N/A |
| Mouse: Gbe1ys/ys: (B6.129-Gbe1tm2.1Hoa) | Orhan Akman et al., 2015 | N/A |
| Oligonucleotides | ||
| For sequencing and genotyping primers see Table S1 | N/A | N/A |
| Recombinant DNA | ||
| Myc-mGbe1 | This paper | N/A |
| Myc-hGbe1 | This paper | N/A |
| Myc-mGbe1ys | This paper | N/A |
| Myc-hGbe1ys | This paper | N/A |
| pmaxGFP | Lonza | VACA-1003 |
| Software and Algorithms | ||
| Pannoramic Viewer 1.15.4 | 3DHISTECH Ltd. | N/A |
| ImageQuant TL 8.1 | GE Healthcare Life Sciences | N/A |
| Thermo Scientific™ Dionex™ Chromeleon 7.2 | Thermo Fisher Scientific | N/A |
| ImageLab 6.0.1 | Bio-Rad | N/A |
| Other | ||
| TissueRuptor II | QIAGEN | #9002755 |
| TissueRuptor Disposable Probes | QIAGEN | #990890 |
| TLC silica gel 60 sheets | Merck | 1.05553.0001 |
| Amicon Ultra-0.5 Centrifugal Filter Unit, 100 kDa | MilliporeSigma | UFC510096 |
| 96-well filter plate | MilliporeSigma | MSFBN6B |
Highlights.
Soluble glycogen content and structure: WT-like in Epm2a−/−, Epm2b−/−, Gbe1ys/ys mice
Glycogen hyperphosphorylation is not a general feature of insoluble glycogen
Abnormal chain length and molecule size distributions are limited to insoluble glycogen
Wild-type glycogen molecules vary in average chain length and precipitation propensity
ACKNOWLEDGMENTS
This work was supported by the National Institute of Neurological Disorders and Stroke of the NIH (P01 NS097197). B.A.M. holds the University of Texas Southwestern Jimmy Elizabeth Westcott Chair in Pediatric Neurology. M.A.S. was supported by the National Health and Medical Research Council (NHMRC) CJ Martin Fellowship (GNT1092451) and the Mater Foundation. We wish to thank Drs. Michael Emes and Ian Tetlow (University of Guelph, Canada) for facilitating the use of the HPAEC-PAD equipment.
Footnotes
DECLARATION OF INTERESTS
The authors declare no competing interests.
SUPPLEMENTAL INFORMATION
Supplemental Information can be found online at https://doi.org/10.1016/j.celrep.2019.04.017.
REFERENCES
- Akman HO, Sheiko T, Tay SKH, Finegold MJ, Dimauro S, and Craigen WJ (2011). Generation of a novel mouse model that recapitulates early and adult onset glycogenosis type IV. Hum. Mol. Genet 20, 4430–4439. [DOI] [PMC free article] [PubMed] [Google Scholar]
- Akman HO, Kakhlon O, Coku J, Peverelli L, Rosenmann H, Rozenstein-Tsalkovich L, Turnbull J, Meiner V, Chama L, Lerer I, et al. (2015). Deep intronic GBE1 mutation in manifesting heterozygous patients with adult polyglucosan body disease. JAMA Neurol. 72, 441–445. [DOI] [PubMed] [Google Scholar]
- Almstrup K, Poulsen P, and Hilden I (2000). A fast method for measurement of branching enzyme activity using a thin-layer chromatography-based phosphorylase a stimulation assay. Anal. Biochem 286, 297–300. [DOI] [PubMed] [Google Scholar]
- Andrade DM, Turnbull J, and Minassian BA (2007). Lafora disease, seizures and sugars. Acta Myol. 26, 83–86. [PMC free article] [PubMed] [Google Scholar]
- Bao Y, Kishnani P, Wu JY, and Chen YT (1996). Hepatic and neuromuscular forms of glycogen storage disease type IV caused by mutations in the same glycogen-branching enzyme gene. J. Clin. Invest 97, 941–948. [DOI] [PMC free article] [PubMed] [Google Scholar]
- Berkovic SF, Andermann F, Carpenter S, and Wolfe LS (1986). Progressive myoclonus epilepsies: specific causes and diagnosis. N. Engl. J. Med 375,296–305. [DOI] [PubMed] [Google Scholar]
- Brown BI, and Brown DH (1966). Lack of an alpha-1,4-glucan: alpha-1,4-glucan 6-glycosyl transferase in a case of type IV glycogenosis. Proc. Natl. Acad. Sci. USA 56, 725–729. [DOI] [PMC free article] [PubMed] [Google Scholar]
- Chan EM, Bulman DE, Paterson AD, Turnbull J, Andermann E, Andermann F, Rouleau GA, Delgado-Escueta AV, Scherer SW, and Minassian BA (2003). Genetic mapping of a new Lafora progressive myoclonus epilepsy locus (EPM2B) on 6p22. J. Med. Genet 40, 671–675. [DOI] [PMC free article] [PubMed] [Google Scholar]
- Deng B, Sullivan MA, Li J, Tan X, Zhu C, Schulz BL, and Gilbert RG (2015). Molecular structure of glycogen in diabetic liver. Glycoconj. J 32, 113–118. [DOI] [PubMed] [Google Scholar]
- DePaoli-Roach AA, Tagliabracci VS, Segvich DM, Meyer CM, Irimia JM, and Roach PJ (2010). Genetic depletion of the malin E3 ubiquitin ligase in mice leads to lafora bodies and the accumulation of insoluble laforin. J. Biol. Chem 285, 25372–25381. [DOI] [PMC free article] [PubMed] [Google Scholar]
- DePaoli-Roach AA, Contreras CJ, Segvich DM, Heiss C, Ishihara M, Azadi P, and Roach PJ (2015). Glycogen phosphomonoester distribution in mouse models of the progressive myoclonic epilepsy, Lafora disease. J. Biol. Chem 290, 841–850. [DOI] [PMC free article] [PubMed] [Google Scholar]
- Emanuelle S, Brewer MK, Meekins DA, and Gentry MS (2016). Unique carbohydrate binding platforms employed by the glucan phosphatases. Cell. Mol. Life Sci 73, 2765–2778. [DOI] [PMC free article] [PubMed] [Google Scholar]
- Froese DS, Michaeli A, McCorvie TJ, Krojer T, Sasi M, Melaev E, Goldblum A, Zatsepin M, Lossos A, Álvarez R, et al. (2015). Structural basis of glycogen branching enzyme deficiency and pharmacologic rescue by rational peptide design. Hum. Mol. Genet 24, 5667–5676. [DOI] [PMC free article] [PubMed] [Google Scholar]
- Ganesh S, Delgado-Escueta AV, Sakamoto T, Avila MR, Machado-Salas J, Hoshii Y, Akagi T, Gomi H, Suzuki T, Amano K, et al. (2002). Targeted disruption of the Epm2a gene causes formation of Lafora inclusion bodies, neurodegeneration, ataxia, myoclonus epilepsy and impaired behavioral response in mice. Hum. Mol. Genet 11, 1251–1262. [DOI] [PubMed] [Google Scholar]
- Gayarre J, Duran-Trío L, Criado Garcia O, Aguado C, Juana-López L, Crespo I, Knecht E, Bovolenta P, and Rodríguez de Córdoba S (2014). The phosphatase activity of laforin is dispensable to rescue Epm2a−/− mice from Lafora disease. Brain 737, 806–818. [DOI] [PubMed] [Google Scholar]
- Gidley MJ, and Bulpin PV (1987). Crystallisation of malto-oligosaccharides as models of the crystalline forms of starch: minimum chain-length requirement for the formation of double-helices. Carbohydr. Res 767, 291–300. [Google Scholar]
- Guinovart JJ, Salavert A, Massague J, Ciudad CJ, Salsas E, and Itarte E (1979). Glycogen synthase: a new activity ratio assay expressing a high sensitivity to the phosphorylation state. FEBS Lett. 706, 284–288. [DOI] [PubMed] [Google Scholar]
- Hamielec AE, and Ouano AC (1978). Generalized universal molecular weight calibration parameter in GPC. J. Liq. Chromatogr 1, 111–120. [Google Scholar]
- Hays AP, Hallett M, Delfs J, Morris J, Sotrel A, Shevchuk MM, and DiMauro S (1981). Muscle phosphofructokinase deficiency: abnormal polysaccharide in a case of late-onset myopathy. Neurology 37, 1077–1086. [DOI] [PubMed] [Google Scholar]
- Hicks J, Wartchow E, and Mierau G (2011). Glycogen storage diseases: a brief review and update on clinical features, genetic abnormalities, pathologic features, and treatment. Ultrastruct. Pathol 35, 183–196. [DOI] [PubMed] [Google Scholar]
- Irimia JM, Tagliabracci VS, Meyer CM, Segvich DM, DePaoli-Roach AA, and Roach PJ (2015). Muscle glycogen remodeling and glycogen phosphate metabolism following exhaustive exercise of wild type and laforin knockout mice. J. Biol. Chem 290, 22686–22698. [DOI] [PMC free article] [PubMed] [Google Scholar]
- Jouyban A, Soltanpour S, and Chan H-K (2004). Asimple relationship between dielectric constant of mixed solvents with solvent composition and temperature. Int. J. Pharm 269, 353–360. [DOI] [PubMed] [Google Scholar]
- Kakhlon O, Glickstein H, Feinstein N, Liu Y, Baba O, Terashima T, Akman HO, Dimauro S, and Lossos A (2013). Polyglucosan neurotoxicity caused by glycogen branching enzyme deficiency can be reversed by inhibition of glycogen synthase. J. Neurochem 727, 101–113. [DOI] [PubMed] [Google Scholar]
- Kakhlon O, Ferreira I, Solmesky LJ, Khazanov N, Lossos A, Alvarez R, Yetil D, Pampou S, Weil M, Senderowitz H, et al. (2018). Guaiacol as a drug candidate for treating adult polyglucosan body disease. JCI Insight 3, 99694. [DOI] [PMC free article] [PubMed] [Google Scholar]
- Lowry OH, and Passonneau JV (1972). A Flexible System of Enzymatic Analysis (Academic Press; ). [Google Scholar]
- Mercier C, and Whelan WJ (1973). Further characterization of glycogen from type-IV glycogen-storage disease. Eur. J. Biochem 40, 221–223. [DOI] [PubMed] [Google Scholar]
- Mochel F, Schiffmann R, Steenweg ME, Akman HO, Wallace M, Sedel F, Laforêt P, Levy R, Powers JM, Demeret S, et al. (2012). Adult polyglucosan body disease: natural history and key magnetic resonance imaging findings. Ann. Neurol 72, 433–41. [DOI] [PMC free article] [PubMed] [Google Scholar]
- Nitschke F, Wang P, Schmieder P, Girard J-M, Awrey DE, Wang T, Israelian J, Zhao X, Turnbull J, Heydenreich M, et al. (2013). Hyperphosphorylation of glucosyl C6 carbons and altered structure of glycogen in the neurodegenerative epilepsy Lafora disease. Cell Metab. 17, 756–767. [DOI] [PubMed] [Google Scholar]
- Nitschke F, Sullivan MA, Wang P, Zhao X, Chown EE, Perri AM, Israelian L, Juana-Lopez L, Bovolenta P, Rodriguez de Cordoba S, et al. (2017). Abnormal glycogen chain length pattern, not hyperphosphorylation, is critical in Lafora disease. EMBO Mol. Med 9, 906–917. [DOI] [PMC free article] [PubMed] [Google Scholar]
- Nitschke F, Ahonen SJ, Nitschke S, Mitra S, and Minassian BA (2018). Lafora disease - from pathogenesis to treatment strategies. Nat. Rev. Neurol 14, 606–617. [DOI] [PMC free article] [PubMed] [Google Scholar]
- Orhan Akman H, Emmanuele V, Kurt YG, Kurt B, Sheiko T, DiMauro S, and Craigen WJ (2015). A novel mouse model that recapitulates adult-onset glycogenosis type 4. Hum. Mol. Genet 24, 6801–6810. [DOI] [PMC free article] [PubMed] [Google Scholar]
- Roach PJ (2015). Glycogen phosphorylation and Lafora disease. Mol. Aspects Med 46, 78–84. [DOI] [PMC free article] [PubMed] [Google Scholar]
- Roach PJ, Depaoli-Roach AA, Hurley TD, and Tagliabracci VS (2012). Glycogen and its metabolism: some new developments and old themes. Biochem. J 441, 763–787. [DOI] [PMC free article] [PubMed] [Google Scholar]
- Robitaille Y, Carpenter S, Karpati G, and DiMauro SD (1980). A distinct form of adult polyglucosan body disease with massive involvement of central and peripheral neuronal processes and astrocytes: a report of four cases and a review of the occurrence of polyglucosan bodies in other conditions such as Lafora’s disease and normal ageing. Brain 103, 315–336. [DOI] [PubMed] [Google Scholar]
- Solmesky LJ, Khazanov N, Senderowitz H, Wang P, Minassian BA, Ferreira IM, Yue WW, Lossos A, Weil M, and Kakhlon O (2017). A novel image-based high-throughput screening assay discovers therapeutic candidates for adult polyglucosan body disease. Biochem. J 474, 3403–3420. [DOI] [PMC free article] [PubMed] [Google Scholar]
- Sullivan MA, Vilaplana F, Cave RA, Stapleton D, Gray-Weale AA, and Gilbert RG (2010). Nature of alpha and beta particles in glycogen using molecular size distributions. Biomacromolecules 11, 1094–1100. [DOI] [PubMed] [Google Scholar]
- Sullivan MA, Powell PO, Witt T, Vilaplana F, Roura E, and Gilbert RG (2014). Improving size-exclusion chromatography separation for glycogen. J. Chromatogr. A 1332, 21–29. [DOI] [PubMed] [Google Scholar]
- Sullivan MA, Nitschke S, Steup M, Minassian BA, and Nitschke F (2017). Pathogenesis of Lafora disease: transition of soluble glycogen to insoluble polyglucosan. Int. J. Mol. Sci 18, 1743. [DOI] [PMC free article] [PubMed] [Google Scholar]
- Suzuki K, David E, and Kutschman B (1971). Presenile dementia with “Lafora-like” intraneuronal inclusions. Arch. Neurol 25, 69–80. [DOI] [PubMed] [Google Scholar]
- Suzuki Y, Lanner C, Kim JH, Vilardo PG, Zhang H, Yang J, Cooper LD, Steele M, Kennedy A, Bock CB, et al. (2001). Insulin control of glycogen metabolism in knockout mice lacking the muscle-specific protein phosphatase PP1G/RGL. Mol. Cell. Biol 21, 2683–2694. [DOI] [PMC free article] [PubMed] [Google Scholar]
- Tagliabracci VS, Turnbull J, Wang W, Girard J-M, Zhao X, Skurat AV, Delgado-Escueta AV, Minassian BA, Depaoli-Roach AA, and Roach PJ (2007). Laforin is a glycogen phosphatase, deficiency of which leads to elevated phosphorylation of glycogen in vivo. Proc. Natl. Acad. Sci. USA 104, 19262–19266. [DOI] [PMC free article] [PubMed] [Google Scholar]
- Tagliabracci VS, Girard JM, Segvich D, Meyer C, Turnbull J, Zhao X, Minassian BA, Depaoli-Roach AA, and Roach PJ (2008). Abnormal metabolism of glycogen phosphate as a cause for Lafora disease. J. Biol. Chem 283, 33816–33825. [DOI] [PMC free article] [PubMed] [Google Scholar]
- Tiberia E, Turnbull J, Wang T, Ruggieri A, Zhao XC, Pencea N, Israelian J, Wang Y, Ackerley CA, Wang P, et al. (2012). Increased laforin and laforin binding to glycogen underlie Lafora body formation in malin-deficient Lafora disease. J. Biol. Chem 287, 25650–25659. [DOI] [PMC free article] [PubMed] [Google Scholar]
- Turnbull J, Wang P, Girard JM, Ruggieri A, Wang TJ, Draginov AG, Kameka AP, Pencea N, Zhao X, Ackerley CA, and Minassian BA (2010). Glycogen hyperphosphorylation underlies lafora body formation. Ann. Neurol 68, 925–933. [DOI] [PubMed] [Google Scholar]
- Valles-Ortega J, Duran J, Garcia-Rocha M, Bosch C, Saez I, Pujadas L, Serafin A, Cañas X, Soriano E, Delgado-García JM, et al. (2011). Neurodegeneration and functional impairments associated with glycogen synthase accumulation in a mouse model of Lafora disease. EMBO Mol. Med 3, 667–681. [DOI] [PMC free article] [PubMed] [Google Scholar]
- Vilaplana F, and Gilbert RG (2010). Characterization of branched polysaccharides using multiple-detection size separation techniques. J. Sep. Sci 33, 3537–3554. [DOI] [PubMed] [Google Scholar]
- Vilchez D, Ros S, Cifuentes D, Pujadas L, Valles J, García-Fojeda B, Criado-García O, Fernandez-Sanchez E, Medrano-Fernandez I, Domínguez J, et al. (2007). Mechanism suppressing glycogen synthesis in neurons and its demise in progressive myoclonus epilepsy. Nat. Neurosci 10, 1407–1413. [DOI] [PubMed] [Google Scholar]
- Wang Y, Ma K, Wang P, Baba O, Zhang H, Parent JM, Zheng P, Liu Y, Minassian BA, and Liu Y (2013). Laforin prevents stress-induced polyglucosan body formation and Lafora disease progression in neurons. Mol. Neurobiol 48, 49–61. [DOI] [PMC free article] [PubMed] [Google Scholar]
- Wanson J-C, and Drochmans P (1968). Rabbit skeletal muscle glycogen. A morphological and biochemical study of glycogen β-particles isolated by the precipitation-centrifugation method. J. Cell Biol 38, 130–150. [DOI] [PMC free article] [PubMed] [Google Scholar]
- Welinder C, and Ekblad L (2011). Coomassie staining as loading control in western blot analysis. J. Proteome Res 10, 1416–1419. [DOI] [PubMed] [Google Scholar]
- Worby CA, Gentry MS, and Dixon JE (2008). Malin decreases glycogen accumulation by promoting the degradation of protein targeting to glycogen (PTG). J. Biol. Chem 283, 4069–4076. [DOI] [PMC free article] [PubMed] [Google Scholar]
Associated Data
This section collects any data citations, data availability statements, or supplementary materials included in this article.