Abstract
Fermented vegetables have emerged as prebiotics with various health benefits. However, the possible mechanisms behind their health benefits are unclear. To relate the metabolite profile changes in fermented mixed vegetables with associated health benefits of fermented vegetables, we analyzed the metabolite profiles of mixed vegetables, before and after fermentation by Lactobacillus plantarum, using gas chromatography/time-of-flight–mass spectrometry (GC/TOF–MS). To analyze health benefits of fermented vegetables, antioxidative and antiinflammatory activities were measured using RAW 264.7 cells. Among 78 metabolites identified by GC/TOF–MS in this study, those significantly increased after fermentation include antioxidative and/or antiinflammatory agents such as lactate, 3-phennyllactate, indole-3-lactate, β-hydroxybutyrate, γ-aminobutyrate, and glycerol. These metabolites may have been either newly synthesized or depolymerized from high molecular weight polymers from vegetables during fermentation. This is the first metabolomics study to relate metabolite profile changes with increased health benefits of fermented vegetables.
Introduction
The global market of functional foods, which are known to induce health benefits and help cure diseases, is rapidly growing [1,2]. The functional food market accounts for 5% of the overall food market and contributes greatly to the growth of the food industry [1,3]. Among various functional food markets, the probiotic food market is most active, accounting for 60–70% of the entire functional food market [4]. The production and consumption of non-dairy probiotic food, such as probiotic-fermented vegetables, have been especially growing due to the ongoing trend of vegetarianism and global prevalence of lactose intolerance [2,5].
Generally, probiotics require prebiotics to survive in gastric environment [5]. Vegetables are also recognized as prebiotics that provide nutrition to probiotics, thus resulting in health benefits on gastrointestinal environment [5]. Likewise, vegetables fermented with probiotic starters strongly enhance the production of beneficial molecules which inhibit the growth of pathogens in gastrointestinal environment, hence offering health benefits in the form of their antioxidative and antiinflammatory effects [5,6]. Many studies have found that after probiotic-induced fermentation, antioxidative, antiviral, antiinflammatory, and antitumor activities of vegetables increased [7–11]. Especially, Lactobacillus plantarum, a lactic acid bacterium with a vegetable origin, is a well-known probiotic that is commonly used as a starter culture for fermenting vegetables [12]. Many fermented foods containing L. plantarum as major strain have been reported to enhance health benefits during fermentation [12–15].
Despite these reports regarding the beneficial features of fermented vegetables, little has been elucidated regarding the causative factors behind the beneficial properties. More specifically, even less is known about how the metabolite changes during fermentation induce various health benefits. Previously, traditional fermented Korean vegetables such as soybeans [16] and kimchi [17] were studied for profiling fermentation-related metabolites, from which 41 [16] and 23 [17] metabolites were detected and identified, respectively. However, the small number of metabolites identified in those studies may be insufficient to either reflect or represent the general changes of metabolites during fermentation of vegetables.
Metabolomics is a study of comprehensive changes of metabolites that are caused either by or in living organisms [18]. Especially in case of fermentation processes, metabolites may also act as nutrients that directly affect growth of microorganisms and may be related to various health benefits arising from the fermented products [3,5]. To profile such metabolites, metabolomics is employed for unveiling metabolisms and identifying biomarkers for health benefits or diseases [18]. Thus, metabolomics can be used to interpret possible changes during the fermentation of vegetables by probiotics.
In this study, we hypothesized that various metabolites produced by probiotics fermenting prebiotic vegetables would induce health benefits. A total of 18 known prebiotic vegetables [7,19,20], such as tomato, cucumber, pear, apple, tangerine, water parsley, carrot, celery, onion, burdock, kale, spinach, aloe, chives, grape, jujube, cabbage, and perilla leaves, were mixed, and a representative probiotic microorganism, L. plantarum [12–15], was inoculated for fermenting the mixed vegetables. For analyzing the metabolite profile changes after fermentation of the mixed vegetables, gas chromatography/time-of-flight–mass spectrometry (GC/TOF–MS) was used. For assessing the health benefits from fermented mixed vegetables, antioxidative and antiinflammatory activities were tested by assays using 2,2-diphenyl-1-picrylhydrazyl (DPPH), nitric oxide (NO), interleukin-6 (IL-6), and tumor necrosis factor-α (TNF-α) cytokine in RAW 264.7 cells. To the best of our knowledge, this is the first report showing the relation between the changes in metabolite profiles and the enhancement of antioxidative and antiinflammatory activities of fermented vegetables.
Materials and methods
Mixed vegetable, a microbial strain, and fermentation conditions
To prepare fermented mixed vegetables, 18 different fruits and vegetables, namely, tomato, cucumber, pear, apple, tangerine, water parsley, carrot, celery, onion, burdock, kale, spinach, aloe, chives, grape, jujube, cabbage, and perilla leaves, were purchased at Hyundai Department Store (Seoul, South Korea). The fruits and vegetables were all produced in South Korea, of which cabbage and kale were organic, and the rest were conventionally grown. The fruits and vegetables were washed, sliced, and mixed with isomaltooligosaccharide, aloe extracts and starter culture. The composition (%, w/w) of the vegetable mixture is as follows; tomato (9.0%), cucumber (8.0%), pear (2.0%), apple (1.8%), tangerine (1.8%), water parsley (1.5%), carrot (1.5%), celery (1.5%), onion (1.5%), burdock (1.5%), kale (1.5%), spinach (1.5%), aloe (1.4%), chives (1.3%), grape (1.3%), jujube (1.3%), cabbage (1.0%), and perilla leaves (0.8%), isomaltooligosaccharide (24.0%), aloe extracts (36.0%, w/w), and the starter culture (0.005%). Three independent biological replicates of static cultivation were performed at 30°C with or without inoculation of L. plantarum PMO 08 for 72 h. The liquid portion in the mixture was obtained and used for CFU and pH measurement. Colony-forming units (CFUs) of total viable cells and total lactic acid bacteria were quantified by using plate count agar (Difco, Detroit, MI) and Bromo Cresol Purple (BCP) agar containing bromocresol purple (0.06 g/L) (Difco), respectively. To measure the pH of the mixture, a pH meter (Thermo Fisher Scientific, Waltham, MA) was used.
Metabolite extraction from fermented mixed vegetables
Metabolites were extracted as previously described for metabolite extraction from plants with slight modification [21]. Mixed vegetables were completely ground to obtain vegetable juice, 400 μl of which was mixed with 1200 μl of acidified methanol (99.875% methanol acidified with 0.125% formic acid, v/v) for extracting metabolites. To completely disintegrate plant cell walls for effectively extracting metabolites, the vegetable juice in the acidified methanol mixture was thoroughly vortexed for 30 s, sonicated for 15 min at 20°C, centrifuged at 20,000 × g for 10 min, and filtered through a 0.2 μm filter. From the filtrate, 100 μl metabolites were obtained; they were completely vacuum-dried at room temperature and used for metabolite analyses. For each group, six replicates consisting of three independent biological replicates × two technical replicates from each biological replicate.
High-performance liquid chromatographic analysis
A high-performance liquid chromatography (HPLC), equipped with a refractive index detector (Agilent 1100, Agilent Technologies, Waldbronn, Germany) and an Aminex HPX–87H organic acid column (Bio-Rad, Hercules, CA), was used for the quantification of lactic acid and acetic acid produced during fermentation. The mobile phase, 0.01 N H2SO4, was eluted at a constant flow rate of 0.5 ml/min at 65°C.
GC/TOF–MS analysis of intracellular metabolites
For the identification and quantification of metabolites using GC/TOF–MS, methoximation and silylation were performed for derivatization of metabolites. For methoximation, 10 μl of 40 mg/ml methoxyamine hydrochloride in pyridine (Sigma-Aldrich, St. Louis, MO) was added to the metabolite samples, and the mixture was incubated at 30°C for 90 min. For silylation, 50 μl of N-methyl-N-trimethylsilyl-trifluoroacetamide (Fluka, Buchs, Switzerland) was added to the metabolite samples, and the mixture was incubated at 37°C for 30 min.
For accurate analysis of metabolites using the GC/TOF–MS, quality control was performed on a daily basis following the same protocol using the identical reagents and analytical instruments with two blank samples and four calibration curves samples consisting of 31 pure reference compounds such as alanine and pyruvate [22]. A mixture of fatty acid methyl esters including methyl forms of C8, C9, C10, C12, C14, C16, C18, C20, C22, C24, C26, C28, and C30 was added to the derivatized sample as retention index markers. For the identification and relative quantification of metabolites, an Agilent 7890B GC (Agilent Technologies) coupled with a Pegasus HT-TOF MS (LECO, St. Joseph, MI) was used. Derivatized metabolite samples (0.5 μl) were injected into the GC instrument equipped with an Rtx-5Sil MS column (30 m length, 0.25 mm inner diameter, and 0.25 μm film thickness; Restek, Bellefonte, PA) with an additional 10 m guard column, in splitless mode. The initial oven temperature was set at 50°C for 1 min, then ramped to 330°C at a rate of 20°C/min, and held for 5 min. Mass spectra in the range of 85–500 m/z were recorded at an acquisition rate of 10 spectra/s. The temperatures of the ion source and the transfer line of TOF–MS were 250°C and 280°C, respectively. The injected sample was ionized by electron impact at 70 eV. For accurate analysis, derivatization and analysis of an entire sample set were completed in one day.
Data processing and statistical analyses for GC/TOF–MS raw data
For detection of peaks and deconvolution of mass spectra, the LECO ChromaTOF software (C version; LECO, St. Joseph, MI) was used for pre-processing the GC/TOF–MS raw data. The pre-processed data were further processed using an in-house library software, BinBase, for the identification of metabolites using the Fiehn library and the NIST library based on retention time and mass spectral similarities [23,24]. Peaks showing mass spectral similarity thresholds over 700 in comparison with authentic standards were regarded identical to their authentic standards. Intensities of the metabolites were reported as peak heights of their unique ion intensities. To treat missing values, the lowest background intensity was subtracted from the intensity of the quantified ion in its retention time region ± 5 s using MZmine software [24]. Raw data table was uploaded (S1 Table). Intensities of identified metabolites were normalized by volume of the vegetable extract. The normalized data were used in the statistical analyses, using partial least squares discriminant analysis (PLS-DA), hierarchical cluster analysis (HCA), Student’s t-test, Analysis of variance (ANOVA) and MetaMapp. PLS-DA was performed using the SIMCA-P+ software (version 12.0; Umetrics AB, Umea, Sweden). Student’s t-test and ANOVA were performed using the Statistica software (version 7.1; StatSoft, Tulsa, OK). HCA was performed using the MultiExperiment Viewer application [25]. The MetaMapp was performed using the MetaMapp and Cytoscape softwares [26].
DPPH, nitric oxide, IL-6, and TNF-α assays
For the DPPH assay, 1.0 ml of 0.2 mM DPPH solution was added to 2 ml of each sample, the mixture was vortexed and incubated for 30 min. The absorbance of the mixture was measured at 517 nm, and the percentage difference between the absorbances before and after incubation was calculated. For the in vitro tests using RAW cells, 100 μl of RAW 264.7 cells (5 × 10⁵ cells/ml) in Dulbecco's modified eagle’s medium (GE Healthcare, Chicago, IL) were transferred into a 96-well plate. After 24 h incubation, the medium was removed, and serum-free medium containing 1 mg/ml of the ground fermented fruits and vegetable sample and 100 ng/ml lipopolysaccharides (LPS) were added to the cells. After incubation for 24 h, 50 μl of the mixture of cells and media was used for analyzing NO, IL-6, and TNF-α levels using a NO detection kit (iNtRON Biotechnology, Seongnam, South Korea), an IL-6 enzyme-linked immunosorbent assay (ELISA) kit (Enzo, Farmingdale, NY), and a TNF-α ELISA kit (Enzo), respectively. For positive and negative controls, LPS or blank controls were used.
Results and discussion
Profiles of bacterial growth, pH, and extracellular metabolites during fermentation
Growth profiles of total and lactic acid bacteria (Fig 1A), extracellular metabolites, namely, lactic acid and acetic acid (Fig 1B), and pH (Fig 1C) of mixed vegetables were investigated during fermentation (Fig 1). In the growth profiles, inoculated mixed vegetable samples showed much higher initial viable cell numbers (Fig 1A), cell growth rates (Fig 1A), and final lactic acid concentrations (Fig 1B) than the non-inoculated vegetable samples. However, cell growth in the inoculated samples, stopped at 24 h, but lactic acid was actively produced until 72 h (Fig 1A and 1B). On the other hand, the non-inoculated samples showed two distinct exponential phases: one between 0 and 12 h and the other between 60 and 72 h (Fig 1A). Interestingly, the non-inoculated samples showed much higher acetic acid concentrations than the inoculated samples (Fig 1B), even though the former had lower viable cell numbers.
Fig 1. Comparison of fermentation profiles of the vegetable mixture.
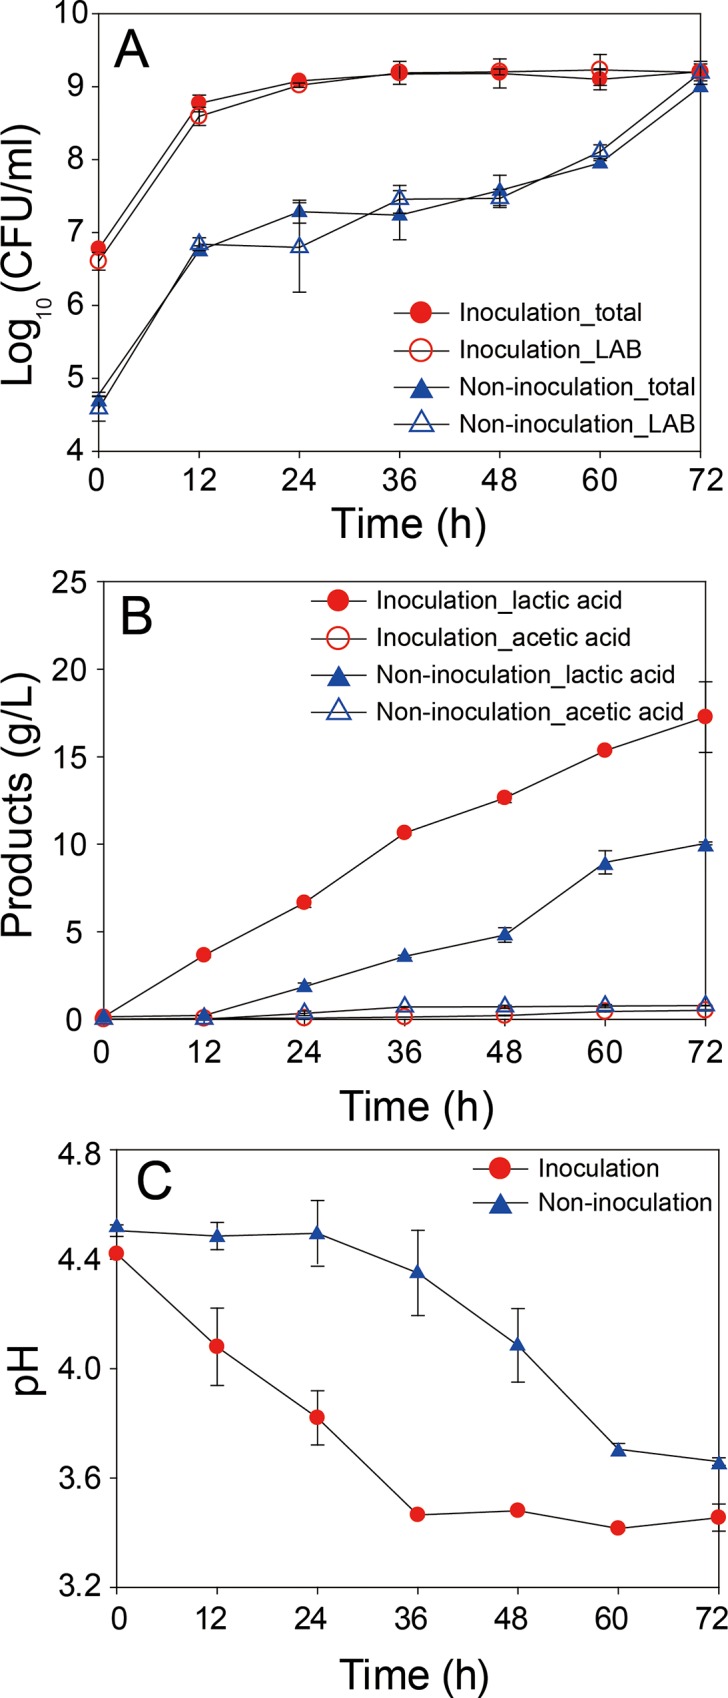
Colony forming units of total bacteria and lactic acid bacteria (A), concentration of lactic acid and acetic acid (B), and pH (C) are shown.
The mixed vegetables might have contained a diverse microbial community, consisting of various microorganisms because they were not pre-sterilized. Therefore, L. plantarum inoculation as the starter culture could affect the composition of the microbial community and hence the concentration of products. In contrast, the non-inoculated samples, showing lower initial cell numbers, would be affected directly by the various microorganisms present initially in the community derived from soil. This difference in the composition of microbial community in the mixed vegetables could result in the differences observed in growth patterns, product yield, and final microbial compositions (Fig 1A and 1B). To obtain reproducible data, the microbial composition of mixed vegetables was controlled in the inoculated samples and used for the analyses of metabolome and health benefits.
Identification of metabolites using GC/TOF–MS
To identify various metabolites in the mixed vegetable extracts, GC/TOF–MS was used. A total of 78 metabolites were detected and identified and comparatively quantified (S1 Table). Among the identified metabolites, the most frequently detected was a class of organic acids, which accounted for 28.2% of the total number of identified metabolites. Chemical classes of sugars and sugar alcohols, amino acids, fatty acids, amines, phosphates, and miscellaneous metabolites accounted for 23.1%, 20.5%, 14.1%, 5.1%, 5.1%, and 3.9%, respectively. The entire 78 metabolites identified by GC/TOF–MS in this study were used for statistical analyses of metabolite profiles of mixed vegetables.
Overall changes of metabolites during fermentation of mixed vegetables
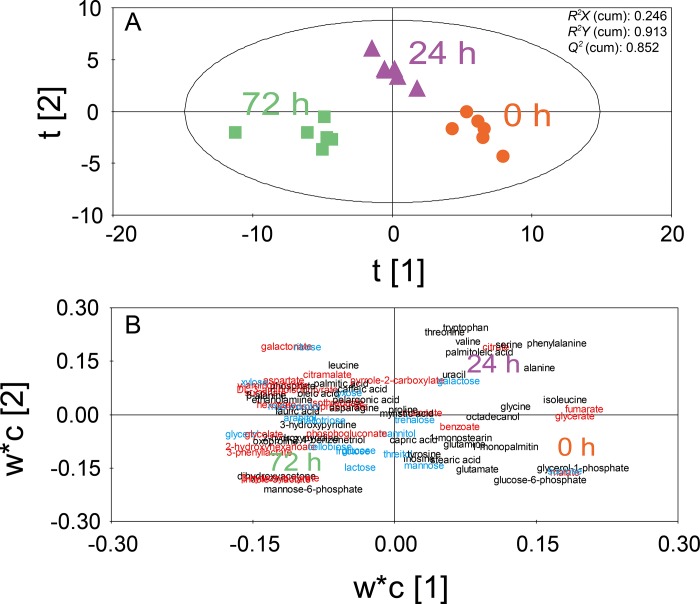
In order to statistically compare the overall change of metabolite profiles during fermentation, PLS-DA analysis was performed (Fig 2). The score plot of PLS-DA analysis using two axes showed clear separation between the metabolite profiles of different fermentation times (0, 24, and 72 h) based on the t[1] axis (Fig 2A). Samples at 0 h, 24 h, and 72 h were located on the negative, center, and positive sides of the score plot, respectively. The PLS-DA model, using two axes, showed a high explanation capability with a cumulative R2Y of 0.913 and a high prediction capability with a cumulative Q2 of 0.852. To show the distribution tendency of metabolites, a loading plot of the PLS-DA model was created (Fig 2B). The VIP values and loading scores of the PLS-DA model are listed in S2 Table. The loading plot of PLS-DA analysis showed many metabolites located on the negative side where the samples fermented for 72 h were placed (Fig 2B). In contrast, fewer metabolites were located at the center and positive side of the loading plot, which corresponded to the samples fermented for 0 h and 24 h (Fig 2B). Overall, the PLS-DA score and loading plots showed time-dependent changes of the metabolite profiles (Fig 2). Intensity of most metabolites increased during fermentation, many of which occurred on the negative side of the loading plot. Interestingly, among the metabolites that increased in abundance, organic acids, sugars, and sugar alcohols were predominant (Fig 2B). These metabolites may have been either newly synthesized or derived from the degradation of high molecular weight polymers from vegetables during fermentation.
Fig 2. PLS-DA of 78 identified metabolites from mixed vegetables at 0 h, 24 h, and 72 h after inoculation of Lactobacillus plantarum.
PLS-DA score plot (A) and PLS-DA loading plot (B) are shown. Colors represent chemical classes of metabolites (red: organic acids; blue: sugars and sugar alcohols; black: others).
Time-dependent changes of metabolite abundance during fermentation
To investigate the changes in metabolite abundance in more details, a volcano plot based on Student’s t-test was constructed (Fig 3). Comparing the samples from 0 h with those from 24 h, malate and sucrose were found depleted, and various organic acids such as 3-phenyllactate and 2-hydroxyhexanoate, monomeric sugars such as xylose, and amino acids such as β-alanine and tryptophan accumulated after 24 h (Fig 3A and S3 Table). During this period, microorganisms might have adapted to the fermentation environment, and actively grown using sucrose and malate. Microorganisms could synthesize various amino acids such as β-alanine and tryptophan for protein synthesis and cell growth, and could produce various organic acids including lactic acid, 3-phenyllactate, and 2-hydroxybutyrate. In this period, levels of various monomeric sugars also increased, which collectively indicated that the increased sugars probably resulted from the enzymatic degradation of polymers originating from either microorganisms [27] or vegetables [28].
Fig 3. Volcano plots of 78 primary metabolites based on Student’s t-test.
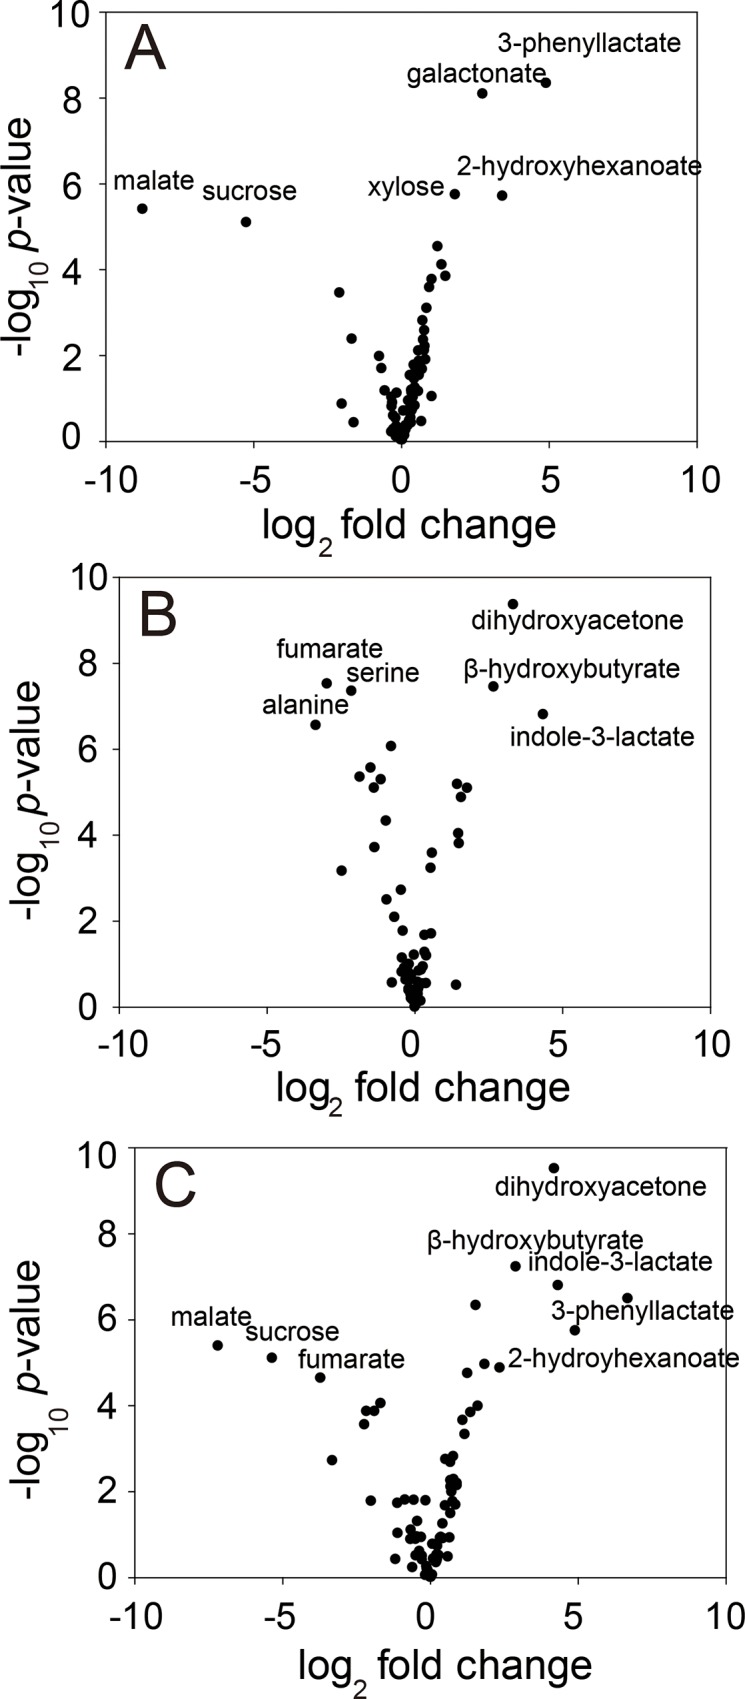
Comparison between 0 h and 24 h (A), 24 h and 72 h (B), and 0 h and 72 h (C) are shown.
Upon comparison between the samples at 24 h and 72 h, various amino acids such as alanine, serine, and phenylalanine and few organic acids such as citrate, glycerate, and fumarate were found to have significantly decreased (Fig 3B and S4 Table). Especially, citrate, which was analyzed to be the main component of the mixed vegetables before fermentation in this experiment, decreased remarkably during fermentation. In contrast, organic acids such as indole-3-lactate, β-hydroxybutyrate, and 3-phenyllactate and sugars such as dihydroxyacetone and glycerol significantly increased. It is likely that, during the fermentation period between 24 h and 72 h, microorganisms might have entered the stationary phase, producing various organic acids including lactic acid and low molecular weight sugars, rather than amino acids essential for cell growth. Citrate might have been utilized by microorganisms as an energy source [29].
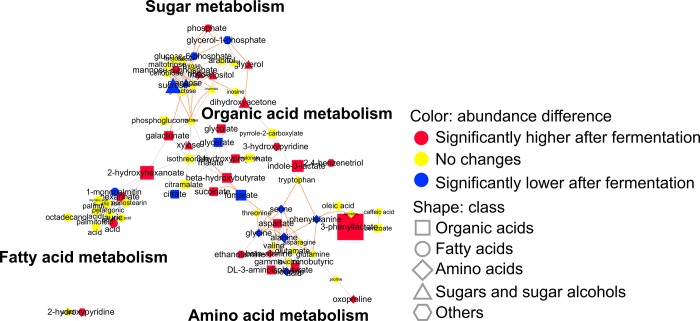
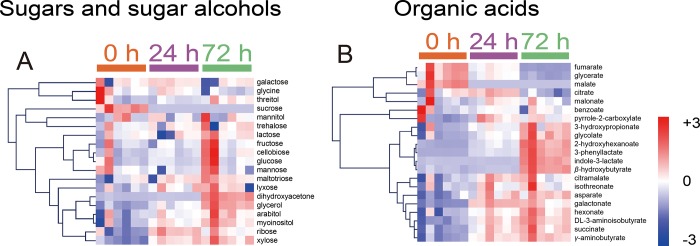
To compare the changes in metabolites before and after fermentation, samples at 0 and 72 h after inoculation were analyzed (Fig 3C and S5 Table). To show the changes in metabolite abundance before and after fermentation, based on metabolic pathways and structural similarities of metabolites, the MetaMapp analysis was performed based on the results of t-test between 0 h and 72 h (Fig 4). Malate and sucrose, the two main components of mixed vegetables in this study, significantly decreased after fermentation. In contrast, various organic acids such as 3-phenyllactate, 2-hydroxyhexanoate, and indole-3-lactate and low molecular weight sugars such as dihydroxyacetone, xylose, and ribose significantly increased. During the entire fermentation process, increases of various sugars and organic acids were evident. To demonstrate the time-dependent changes in the concentration of sugars and organic acids, ANOVA was performed between 0 h, 24 h, and 72 h. A total of 7 sugars and sugar alcohols (S6 Table), and 17 organic acids were significantly changed during the fermentation (S7 Table). To show time-dependent significant increase of independent sugars, sugar alcohols, and organic acids, the HCA analysis based on the Pearson correlation was performed (Fig 5). The HCA analysis showed time-dependent increase of independent sugars, sugar alcohols (Fig 5A), and organic acids (Fig 5B).
Fig 4. MetaMapp analysis for mapping 78 primary metabolites.
Classes of metabolites are represented by shape. Significant changes of metabolites are represented by color (p < 0.05). Magnitudes of fold changes are represented by sizes of symbols and labels. Biochemical and structural similarities are represented by purple and gray edges, respectively.
Fig 5. HCA of classes of sugars, sugar alcohols, and organic acids.
HCA plots for sugars and sugar alcohols (A) and organic acids (B) are shown. HCA correlations were based on the Pearson correlation.
Taken together, enzymes of microorganisms [27] and vegetables [28] might have degraded polymeric substances into various small molecules, mainly sugars or organic acids. Lactic acid bacteria might have utilized these small molecules, such as sucrose, malate, and citrate, as energy sources for the production of various organic acids such as lactic acid and 3-phennyllactate [29–31]. The increased levels of sugars and organic acids, during fermentation, might have antioxidative and antiinflammatory activities that could contribute to various health benefits in fermented vegetables.
Antioxidative and antiinflammatory activities of mixed vegetables
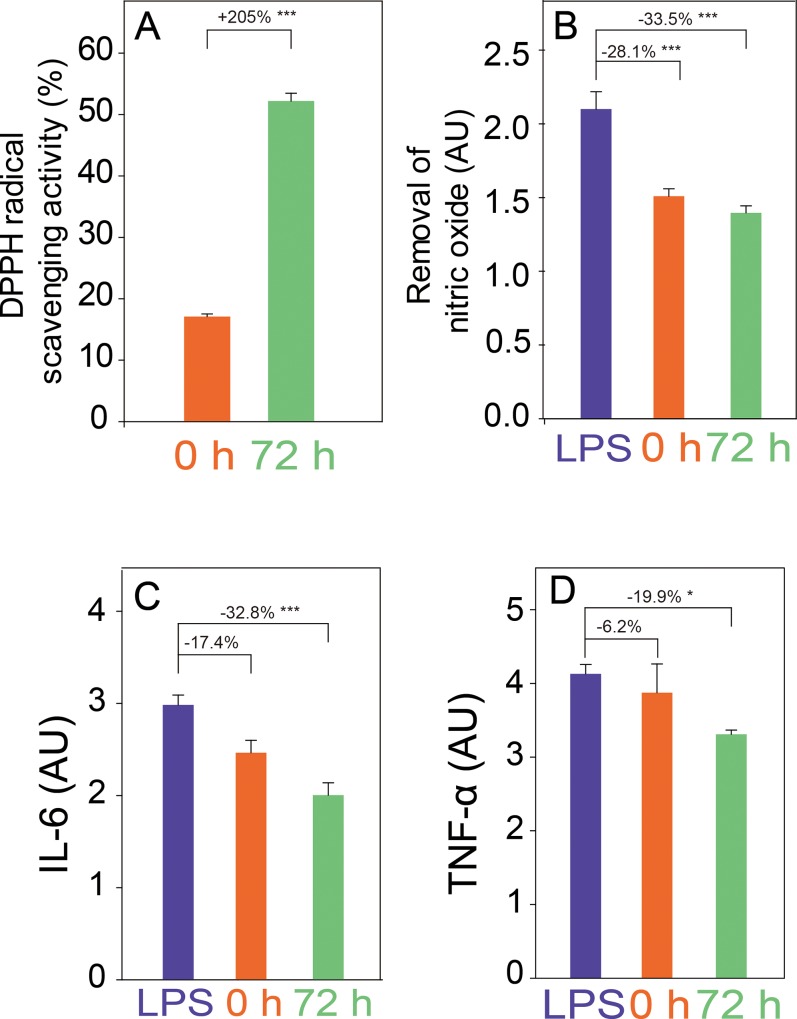
To determine whether the health benefits of mixed vegetables increase post fermentation, their antioxidative and antiinflammatory activities were analyzed before and after fermentation (Fig 6). The DPPH and NO assays of RAW cells revealed radical scavenging activity of fermented and non-fermented mixed vegetables (Fig 6A and 6B) although the activity significantly increased after fermentation. The IL-6 and TNF-α levels of RAW cells, treated with mixed vegetables, were also analyzed (Fig 6C and 6D). Treatment with the fermented mixed vegetables showed significant decreases in IL-6 and TNF-α levels. Taken together, it is evident that the antioxidative and antiinflammatory activities of the mixed vegetables significantly increased after fermentation.
Fig 6. Antioxidative and antiinflammatory activities of mixed vegetables before and after fermentation by Lactobacillus plantarum.
DPPH analysis (A), inhibition of nitric oxide (B), production of IL-6 (C), and TNF-α (D) in raw 264.7 cells are shown (*p < 0.05; ***p < 0.01).
Increased antioxidative and antiinflammatory activities in the fermented fruits and vegetables are directly related to the increased metabolites, especially organic acids. Various organic acids are known to possess antioxidative and antiinflammatory activities [32]. As seen earlier in the metabolite analyses, the significant increase of various organic acids after fermentation were evident in this study (Fig 5B). Therefore, it is possible to relate the increased antioxidative and antiinflammatory activities (Fig 6) of the fermented vegetables to the associated increase of various organic acids in the fermented vegetables (Fig 5B). Among the significantly increased organic acids, lactate [33], 3-phenyllactate [34], indole-3-lactate [35], β-hydroxybutyrate [36], and γ-aminobutyrate [37] are well-known scavengers of reactive oxygen species with high antioxidative activity. In addition, lactate [38], indole-3-lactate [39], β-hydroxybutyrate [40], γ-aminobutyrate [41, 42], and glycerol [43], which were found to have significantly increased after fermentation, in this study, are known to be antiinflammatory substances. Moreover, health benefits of fermented vegetables may not be limited to the antioxidative and antiinflammatory activities explored in this study. Among the significantly increased metabolites after fermentation, γ-aminobutyrate [44], β-alanine [45], and succinate [46] were also reported as antitumor substances. In particular, these metabolites are known to enhance health benefits through synergic effects when they are in food as a mixture rather than as a single metabolite [47–49]. Therefore, these metabolites in the fermented vegetables could also render additional health benefits. To provide useful information for future studies of fermented mixed vegetables using L. plantarum, raw metabolite analysis data have been uploaded (S1 Table). However, our presumption that the increased health benefits are due to metabolites produced by L. plantarum has a limitation of a lack of experimental validation. This can be verified by further studies such as applying metabolomic approaches to the fermented mixed vegetables before and after inoculation of L. plantarum.
Conclusions
In this study, a mixture of 18 different vegetables was fermented with L. plantarum. Significantly increased abundance of metabolites from primary metabolism, along with increased health benefits post fermentation, was observed in this study. During the fermentation of mixed vegetables, enzymes from both microorganisms and vegetables have degraded large molecules into small ones, which could have been utilized initially by the inoculated lactic acid bacteria as nutrients for their growth, producing various amino acids and organic acids. After growth completion, the lactic acid bacteria have produced much more organic acids including antioxidative (e.g. lactate, 3-phenyllactate, indole-3-lactate, β-hydroxybutyrate, and γ-aminobutyrate), antiinflammatory (e.g. lactate, indole-3-lactate, β-hydroxybutyrate, γ-aminobutyrate, and glycerol), and antitumor agents (e.g. γ-aminobutyrate, β-alanine, and succinate), resulting in increased health benefits of the fermented mixed vegetables. Our omics data and biological interpretation could be used to assist to unveil health benefits of vegetables fermented with lactic acid bacteria.
Supporting information
(XLSX)
(XLSX)
(XLSX)
(XLSX)
(XLSX)
(XLSX)
(XLSX)
Data Availability
The data underlying the results presented in the study are available within the paper and its Supporting Information file.
Funding Statement
This work was supported by the Pulmuone Institute of Technology (Keybase fermented vegetables extract), Pulmuone, Seoul, South Korea. The analysis of metabolome was supported by the Mid-career Researcher Program (NRF-2017R1A2B2005628) from the National Research Foundation of Korea and the Advanced Biomass R&D Center of Global Frontier Project (2011-0031359), both funded by the Korean Government (MIST), and also by the Institute of Biomedical Science and Food Safety at the Korea University Food Safety Hall. The funders had no role in study design, data collection and analysis, decision to publish, or preparation of the manuscript.
References
- 1.Koletzko B, Aggett PJ, Bindels JG, Bung P, Ferre P, Gil A, et al. Growth, development and differentiation: a functional food science approach. Br J Nutr. 1998;80: S5–S45. 10.1079/BJN19980104 [DOI] [PubMed] [Google Scholar]
- 2.Granato D, Branco GF, Nazzaro F, Cruz AG, Faria JAF. Functional foods and nondairy probiotic food development: trends, concepts, and products. Compr Rev Food Sci F. 2010;9: 292–302. 10.1111/j.1541-4337.2010.00110.x [DOI] [PubMed] [Google Scholar]
- 3.Tripathi MK, Giri SK. Probiotic functional foods: Survival of probiotics during processing and storage. J Funct Foods 2014;9: 225–241. 10.1016/j.jff.2014.04.030 [DOI] [Google Scholar]
- 4.Stanton C, Gardiner G, Lynch PB, Collins JK, Fitzgerald G, Ross RP. Probiotic cheese. Int Dairy J. 1998;8: 491–496. 10.1016/S0958-6946(98)00080-6 [DOI] [Google Scholar]
- 5.Spence JT. Challenges related to the composition of functional foods. J Food Compos Anal. 2006;19: S4–S6. 10.1016/j.jfca.2005.11.007 [DOI] [Google Scholar]
- 6.Tamang JP, Tamang B, Schillinger U, Guigas C, Holzapfel WH. Functional properties of lactic acid bacteria isolated from ethnic fermented vegetables of the Himalayas. Int J Food Microbiol. 2009;135: 28–33. 10.1016/j.ijfoodmicro.2009.07.016 [DOI] [PubMed] [Google Scholar]
- 7.Patel S, Goyal A. The current trends and future perspectives of prebiotics research: a review. 3 Biotech. 2012;2(2): 115–125. 10.1007/s13205-012-0044-x [DOI] [Google Scholar]
- 8.Swain MR, Anandharaj M, Ray RC, Rani PR. Fermented fruits and vegetables of Asia: a potential source of probiotics. Biotechnol Res Int. 2014;2014: 250424 10.1155/2014/250424 [DOI] [PMC free article] [PubMed] [Google Scholar]
- 9.Sun YP, Chou CC, Yu RC. Antioxidant activity of lactic-fermented Chinese cabbage. Food Chem. 2009;115: 912–917. 10.1016/j.foodchem.2008.12.097 [DOI] [Google Scholar]
- 10.Lee MH, Yoo SH, Ha SD, Choi C. Inactivation of feline calicivirus and murine norovirus during Dongchimi fermentation. Food Microbiol. 2012;31: 210–214. 10.1016/j.fm.2012.04.002 [DOI] [PubMed] [Google Scholar]
- 11.Oh YC, Cho WK, Oh JH, Im GY, Jeong YH, Yang MC, et al. Fermentation by Lactobacillus enhances anti-inflammatory effect of Oyaksungisan on LPS-stimulated RAW 264.7 mouse macrophage cells. BMC Complement Altern Med. 2012;12 10.1186/1472-6882-12-12 [DOI] [PMC free article] [PubMed] [Google Scholar]
- 12.Leroy F, Vuyst LD. Lactic acid bacteria as functional starter cultures for the food fermentation industry. Trends Food Sci Tech. 2004;15: 67–78. 10.1016/j.tifs.2003.09.004 [DOI] [Google Scholar]
- 13.Ruiz-Barba JL, Cathcart DP, Warner PJ, Jimenez-Diaz R. Use of Lactobacillus plantarum LPCO10, a bacteriocin producer, as a starter culture in spanish-style green olive fermentations. Appl Environ Microbiol. 1994;60(6):2059–2064 [DOI] [PMC free article] [PubMed] [Google Scholar]
- 14.Park HD, Rhee CH. Antimutagenic activity of Lactobacillus plantarum KLAB21 isolated from kimchi Korean fermented vegetables. Biotechnol Lett. 2001;23(19):1583–1589. 10.1023/A:1011921427581 [DOI] [Google Scholar]
- 15.Beganovic J, Pavunc AL, Gjuracic K, Spoljarec M, Suskovic J, Kos B. Improved sauerkraut production with probiotic strain Lactobacillus plantarum L4 and Leuconostoc mesenteroides LMG 7954. J Food Sci. 2011;76(2):M124–M129. 10.1111/j.1750-3841.2010.02030.x [DOI] [PubMed] [Google Scholar]
- 16.Baek JG, Shim SM, Kwon DY, Choi HK, Lee CH, Kim YS. Metabolite profiling of Cheonggukjang, a fermented soybean paste, inoculated with various Bacillus strains during fermentation. Biosci Biotech Bioch. 2010;74(9):1860–1868. 10.1271/bbb.100269 [DOI] [PubMed] [Google Scholar]
- 17.Jung JY, Lee SH, Lee HJ, Seo HY, Park WS, Jeon CO. Effects of Leuconostoc mesenteroides starter cultures on microbial communities and metabolites during kimchi fermentation. Int J Food Microbiol. 2012;153: 378–387. 10.1016/j.ijfoodmicro.2011.11.030 [DOI] [PubMed] [Google Scholar]
- 18.Fiehn O. Combining genomics, metabolome analysis, and biochemical modelling to understand metabolic networks. Comp Funct Genom. 2001;2: 155–168. 10.1002/cfg.82 [DOI] [PMC free article] [PubMed] [Google Scholar]
- 19.Douglas LC, Sanders ME. Probiotics and prebiotics in dietetics practice. J Am Diet Assoc. 2008;108(3):510–521. 10.1016/j.jada.2007.12.009 [DOI] [PubMed] [Google Scholar]
- 20.Jovanovic-Malinovska R, Kuzmanova S, Winkelhausen E. Oligosaccharide profile in fruits and vegetables as sources of prebiotics and functional foods. Int J Food Prop. 2014;17(5):949–965. 10.1080/10942912.2012.680221 [DOI] [Google Scholar]
- 21.De Vos RC, Moco S, Lommen A, Keurentjes JJ, Bino RJ, Hall RD. Untargeted large-scale plant metabolomics using liquid chromatography coupled to mass spectrometry. Nat Protoc. 2007;2: 778–791. 10.1038/nprot.2007.95 [DOI] [PubMed] [Google Scholar]
- 22.Lee DY, Fiehn O. High quality metabolomic data for Chlamydomonas reinhardtii. Plant Methods. 2008;4 10.1186/1746-4811-4-7 [DOI] [PMC free article] [PubMed] [Google Scholar]
- 23.Kind T, Wohlgemuth G, Lee DY, Lu Y, Palazoglu M, Shahbaz S, et al. FiehnLib: Mass spectral and retention index libraries for metabolomics based on quadrupole and time-of-flight gas chromatography/mass spectrometry. Anal Chem. 2009;81(24):10038–10048. 10.1021/ac9019522 [DOI] [PMC free article] [PubMed] [Google Scholar]
- 24.Skogerson K, Wohlgemuth G, Barupal DK, Fiehn O. The volatile compound BinBase mass spectral database. BMC Bioinformatics. 2011;12: 321 10.1186/1471-2105-12-321 [DOI] [PMC free article] [PubMed] [Google Scholar]
- 25.Chu VT, Gottardo R, Raftery AE, Bumgarner RE, Yeung KY. MeV+R: using MeV as a graphical user interface for Bioconductor applications in microarray analysis. Genome Biol. 2008;9(7). 10.1186/gb-2008-9-7-r118 [DOI] [PMC free article] [PubMed] [Google Scholar]
- 26.Barupal DK, Haldiya PK, Wohlgemuth G, Kind T, Kothari SL, Pinkerton KE, et al. MetaMapp: mapping and visualizing metabolomic data by integrating information from biochemical pathways and chemical and mass spectral similarity. BMC Bioinformatics. 2012;13 10.1186/1471-2105-13-99 [DOI] [PMC free article] [PubMed] [Google Scholar]
- 27.Lebeer S, Vanderleyden J, De Keersmaecker SC. Genes and molecules of lactobacilli supporting probiotic action. Microbiol Mol Biol Rev. 2008;72(4):728–764. 10.1128/MMBR.00017-08 [DOI] [PMC free article] [PubMed] [Google Scholar]
- 28.Ward OP, Moo-Young M. Enzymatic degradation of cell wall and related plant polysaccharides. Crit Rev Biotechnol. 1989;8(4):237–274. 10.3109/07388558909148194 [DOI] [PubMed] [Google Scholar]
- 29.Goffin P, van de Bunt B, Giovane M, Leveau JH, Hoppener-Ogawa S, Teusink B, et al. Understanding the physiology of Lactobacillus plantarum at zero growth. Mol Syst Biol. 2010;6:413 10.1038/msb.2010.67 [DOI] [PMC free article] [PubMed] [Google Scholar]
- 30.Valerio F, Lavermicocca P, Pascale M, Visconti A. Production of phenyllactic acid by lactic acid bacteria: an approach to the selection of strains contributing to food quality and preservation. FEMS Microbiol Lett. 2004;233(2):289–295. 10.1016/j.femsle.2004.02.020 [DOI] [PubMed] [Google Scholar]
- 31.Jia J, Mu W, Zhang T, Jiang B. Bioconversion of phenylpyruvate to phenyllactate: gene cloning, expression, and enzymatic characterization of D- and L1-lactate dehydrogenases from Lactobacillus plantarum SK002. Appl Biochem Biotechnol. 2010;162(1):242–251. 10.1007/s12010-009-8767-9 [DOI] [PubMed] [Google Scholar]
- 32.Winter CK, Davis SF. Organic foods. J Food Sci. 2006;71: R117–R124. 10.1111/j.1750-3841.2006.00196.x [DOI] [Google Scholar]
- 33.Groussard C, Morel I, Chevanne M, Monnier M, Cillard J, Delamarche A. Free radical scavenging and antioxidant effects of lactate ion: an in vitro study. J Appl Physiol. 2000;89: 169–175. 10.1152/jappl.2000.89.1.169 [DOI] [PubMed] [Google Scholar]
- 34.Fedotcheva NI, Kazakov RE, Kondrashova MN, Beloborodova NV. Toxic effects of microbial phenolic acids on the functions of mitochondria. Toxicol Lett. 2008;180: 182–188. 10.1016/j.toxlet.2008.06.861 [DOI] [PubMed] [Google Scholar]
- 35.Poeggeler B, Pappolla MA, Hardeland R, Rassoulpour A, Hodgkins PS, Guidetti P, et al. Indole-3-propionate: a potent hydroxyl radical scavenger in rat brain. Brain Res. 1999;815:382–388. 10.1016/S0006-8993(98)01027-0 [DOI] [PubMed] [Google Scholar]
- 36.Shimazu T, Hirschey MD, Newman J, He W, Shirakawa K, Le Moan N, et al. Suppression of oxidative stress by β-hydroxybutyrate, an endogenous histone deacetylase inhibitor. Science. 2013;339: 211–214. 10.1126/science.1227166 [DOI] [PMC free article] [PubMed] [Google Scholar]
- 37.Deng Y, Wang W, Yu P, Xi Z, Xu L, Li X, et al. Comparison of taurine, GABA, Glu, and Asp as scavengers of malondialdehyde in vitro and in vivo. Nanoscale Res Lett. 2013;8 10.1186/1556-276X-8-8 [DOI] [PMC free article] [PubMed] [Google Scholar]
- 38.Lerch MM, Conwell DL, Mayerle J. The anti-inflammasome effect of lactate and the lactate GPR81-receptor in pancreatic and liver inflammation. Gastroenterology. 2014;146: 1602–1605. 10.1053/j.gastro.2014.04.025 [DOI] [PubMed] [Google Scholar]
- 39.Neves AL, Chilloux J, Sarafian MH, Rahim MB, Boulange CL, Dumas ME. The microbiome and its pharmacological targets: therapeutic avenues in cardiometabolic diseases. Curr Opin Pharmacol. 2015;25: 36–44. 10.1016/j.coph.2015.09.013 [DOI] [PubMed] [Google Scholar]
- 40.Bae HR, Kim DH, Park MH, Lee B, Kim MJ, Lee EK, et al. β-Hydroxybutyrate suppresses inflammasome formation by ameliorating endoplasmic reticulum stress via AMPK activation. Oncotarget. 2016;7: 66444–66454. 10.18632/oncotarget.12119 [DOI] [PMC free article] [PubMed] [Google Scholar]
- 41.Bhat R, Axtell R, Mitra A, Miranda M, Lock C, Tsien RW, et al. Inhibitory role for GABA in autoimmune inflammation. P Natl Acad Sci USA. 2010;107: 2580–2585. 10.1073/pnas.0915139107 [DOI] [PMC free article] [PubMed] [Google Scholar]
- 42.Tian J, Yong J, Dang H, Kaufman DL. Oral GABA treatment downregulates inflammatory responses in a mouse model of rheumatoid arthritis. Autoimmunity. 2011;44: 465–470. 10.3109/08916934.2011.571223 [DOI] [PMC free article] [PubMed] [Google Scholar]
- 43.Szel E, Polyanka H, Szabo K, Hartmann P, Degovics D, Balazs B, et al. Anti-irritant and anti-inflammatory effects of glycerol and xylitol in sodium lauryl sulphate-induced acute irritation. J Eur Acad Dermatol Venereol. 2015;29: 2333–2341. 10.1111/jdv.13225 [DOI] [PubMed] [Google Scholar]
- 44.Oh CH, Oh SH. Effects of germinated brown rice extracts with enhanced levels of GABA on cancer cell proliferation and apoptosis. J Med Food. 2004;7: 19–23. 10.1089/109662004322984653 [DOI] [PubMed] [Google Scholar]
- 45.Vaughan RA, Gannon NP, Garcia-Smith R, Licon-Munoz Y, Barberena MA, Bisoffi M, et al. β-alanine suppresses malignant breast epithelial cell aggressiveness through alterations in metabolism and cellular acidity in vitro. Mol Cancer. 2014;13 10.1186/1476-4598-13-13 [DOI] [PMC free article] [PubMed] [Google Scholar]
- 46.Haraguchi T, Kayashima T, Okazaki Y, Inoue J, Mineo S, Matsubara K, et al. Cecal succinate elevated by some dietary polyphenols may inhibit colon cancer cell proliferation and angiogenesis. J Agr Food Chem. 2014;62: 5589–5594. 10.1021/jf501142k [DOI] [PubMed] [Google Scholar]
- 47.Shahidi F, Janitha PK, Wanasundara PD. Phenolic antioxidants. Crit Rev Food Sci Nutr. 1992;32(1):67–103. 10.1080/10408399209527581 [DOI] [PubMed] [Google Scholar]
- 48.Wada S, Fang X. The synergistic antioxidant effect of rosemary extract and α-tocopherol in sardine oil model system and frozen-crushed fish meat. J Food Process Pres. 1992;16(4):263–274. 10.1111/j.1745-4549.1992.tb00207.x [DOI] [Google Scholar]
- 49.Madsen HL, Bertelsen G. Spices as Antioxidants. Trends Food Sci Technol. 1995;6(8):271–277 [Google Scholar]
Associated Data
This section collects any data citations, data availability statements, or supplementary materials included in this article.
Supplementary Materials
(XLSX)
(XLSX)
(XLSX)
(XLSX)
(XLSX)
(XLSX)
(XLSX)
Data Availability Statement
The data underlying the results presented in the study are available within the paper and its Supporting Information file.


