Abstract
Measuring temperature during focused ultrasound (FUS) procedures is critical for characterization, calibration, and monitoring to ultimately ensure safety and efficacy. Despite the low cost and the high spatial and temporal resolutions of temperature measurements using thermocouples, the viscous heating (VH) artifact at the thermocouple-tissue interface requires reading corrections for correct thermometric analysis. In this study, a simulation pipeline is proposed to correct the VH artifact arising from temperature measurements using thermocouples in FUS fields. The numerical model consists of simulating a primary source of heating due to ultrasound absorption and a secondary source of heating from viscous forces generated by the thermocouple in the FUS field. Our numerical validation found that up to 90% of the measured temperature rise was due to VH effects. Experimental temperature measurements were performed using thermocouples embedded in fresh chicken breast samples. Temperature corrections were demonstrated for single high-intensity FUS pulses at 3.1 MHz and for multiple pulses (3.1 MHz, 100 Hz, and 500 Hz pulse repetition frequency). The VH accumulated during sonications and produced a temperature increase of 3.1 °C and 15.3 °C for the single and multiple pulse sequences, respectively. The methodology presented here enables the decoupling of the temperature increase generated by absorption and VH. Thus, more reliable temperature measurements can be extracted from thermocouple measurements by correcting for VH.
Mild hyperthermia or thermal ablation induced by focused ultrasound (FUS) has been widely explored clinically for the treatment of uterine fibroid,1,2 prostate,3,4 breast,5–7 and liver8,9 tumors as well as brain disorder.10–12 In addition, millisecond-long pulses employed in pulsed High-Intensity Focused Ultrasound (p-HIFU) have been demonstrated to be capable of enhancing the delivery of drugs, antibodies, plasmids, or nanoparticles in tumoral tissues13–18 through nonthermal15,17 and thermal mechanisms.18 Monitoring temperature during calibration and characterization of the techniques is crucial for ensuring the safety and efficacy of the treatment.
Magnetic Resonance Imaging (MRI) thermometry is used for guiding and monitoring therapy in MRgFUS systems.19 On the other hand, ultrasound image-guided FUS systems can monitor temperature changes in real-time using B-mode images that track apparent tissue displacements created by tissue expansion and changes in the speed of sound associated with the temperature increase.20–22 In both methods, accurate calibration and validation of the temperature measurements have to be conducted for different tissues, which are often conducted using thermocouple measurements in tissue-mimicking phantoms, ex vivo samples, and in vivo.
Despite the low cost and wide measurable temperature range with good precision, in situ temperature measurements using thermocouples during sonication are affected by an unavoidable effect called the viscous heating (VH) artifact.23,24 This temperature measurement artifact is generated by the motion of the thermocouple within the tissue. Viscous heating incurs a rapid increase in the temperature that distorts measurements. Based on previous studies, the artifact temperature due to viscous heating can reach 80% of the measurement when using wire thermocouples placed within the FUS focal region.25 Huang et al.26 proposed characterizing the viscous heating artifact in phantoms by closely mimicking the acoustic properties of the tissue of interest and then removing the artifact from actual measurements in tissues. However, this approach requires an arduous development and characterization of different tissues and their corresponding low-absorption tissue-mimicking phantoms. Another method consists of using thermocouples that do not exhibit viscous heating25,27,28 such as thin-film thermocouples (TFTs). However, TFTs are not widely available and are not suitable for invasive in vivo experiments, which currently limit their use.25
In this study, we describe a method for evaluating and removing viscous heating artifacts from experimental data based on numerical simulations using the Bio-Heat equation.29 A simulation pipeline is presented to model the viscous heating along with the heating due to ultrasound absorption in biological tissues. The temporal behavior of the artifact and the effects of the thermocouple diameter are also evaluated. Finally, we present how these simulations can be used to evaluate the contribution of the viscous heating in temperature rises measured in chicken breast samples.
The numerical model was created using the k-Wave Matlab Toolbox30 with the implementation of the bio-heat equation29 given by
| (1) |
where T, Ta, ρ, C, κ, and Qus are the temperature, arterial blood temperature, density, specific heat, thermal conductivity, and heat arising from the absorption of ultrasound by the tissue in the steady state, respectively. The steady state is reached when the amplitude of pressure and speed of the wave stabilize at the focus. Here, we consider Qus as the primary heat source. The spatial distribution of this source was derived from the pressure as
| (2) |
where α is the acoustic absorption, p the peak positive pressure, and c0 the speed of sound in the medium.
The heating simulation was performed using the absorption coefficient measured from three chicken breast samples. The attenuation of the samples and the FUS beam profile were obtained using a hydrophone in a water tank (HGL-0200, Onda Corporation, USA). The mean attenuation coefficient was determined by comparing the relative amplitude of ultrasound through transmission measurements in samples and in free water. The thicknesses of the samples, measured using a caliper at 18 different points, were 7.1 ± 1.8, 11.3 ± 2.8, and 8.5 ± 1.4 cm, respectively. The attenuation coefficients for each sample measured at an ultrasound frequency of 3.1 MHz were 12.4, 12.6, and 15.4 dB/cm. The coefficient α0 at 1 MHz was derated using α = α0·fn and n = 1.18 for soft tissue.31 An absorption to scattering ratio of 73/27 based on canine muscle attenuation at 37 °C,32 was applied as only the absorbed waves are converted into heating. The mean attenuation was 3.5 ± 0.4 dB cm−1 MHz−1 (close to the attenuation measured across fibers in human muscles:33 3.3 dB cm−1 MHz−1) with an absorption coefficient of 2.6 dB cm−1 MHz−1.
A secondary heat source Qvis modeled the viscous heating. To perform the experimental validation in chicken breast samples, the last term of Eq. (1) disappears since there is no blood perfusion. For in vivo measurements, the perfusion has to be considered and can easily be included in the simulation. Viscous forces applied to a cylindrical thermocouple can be transverse or aligned with the direction of ultrasound propagation. In this study, we have only investigated the transverse alignment. Thus, in the steady state, the heat generated per second per unit length of the thermocouple by the viscous forces is given by
| (3) |
where , with defined as the mass of tissue displaced per unit length of the thermocouple, and M is the mass per unit length of the thermocouple. The quantities k and can be expressed as a function of , with r0 defined as the radius of the thermocouple and ν the kinematic coefficient of shear viscosity. ω is the ultrasound frequency defined by ω = 2·π·f. Finally, U0 is the particle velocity at the tissue/thermocouple interface, which can be obtained by U0 = p/ρc0. Similar expressions can be computed for any other orientation of the thermocouple with respect to an ultrasound beam with angle θ derived from sin(θ) and cos(θ) compounding (Fry and Fry23,24). Both heat sources (Qus and Qvis) were switched “on” and “off” in loops to reproduce the ultrasound duty cycle and Pulse Repetition Frequency (PRF) in the p-HIFU case study. A summary of the tissue properties used in the simulation is given in Table I.
TABLE I.
Tissue properties adopted in the simulation for chicken breast samples.
| Sound speed | 1580 m s−1 |
| Density | 1090 kg m−3 |
| Thermal conductivity | 0.5 W m–1 K−1 |
| Specific heat | 3421 J kg–1 K−1 |
| Absorption | α0 = 2.57 dB cm−1 MHz−1 |
| (α = α0 f b) | b = 1.18 |
| Dynamic viscosity | 0.5 Pa s |
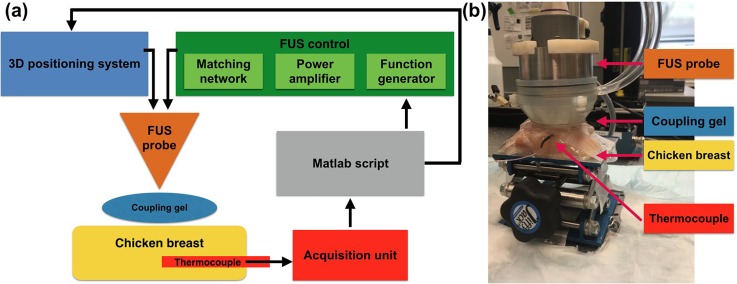
Experimental temperature measurements were performed using a commercial thermocouple [Micro wire T-type probe, 3 ft. lead. Teflon coated; Max diameter at tip 0.011 in. (0.3 mm); model Ultra Fast Micro Wire Type T, Thermoworks, UT, USA] fixed at one position to avoid damage in the sample from several withdrawals of the thermocouple. The FUS focus was positioned at the very edge of the thermocouple's sensitive area using a 3D positioning system (Velmex, inc., Bloomfield, NY, USA). This avoided artifacts in the temperature measurements due to the thermal diffusion of structures outside the region of interest. The thermocouple was inserted 5 mm below the chicken breast surface using ultrasound B-mode imaging guidance. The chicken breast samples were placed at an adjustable height platform covered with Parafilm M (Merck KGaA, Darmstadt, Germany) used to secure the sample and avoid tissue dehydration. A single-element FUS transducer with a center frequency of 3.1 MHz (inner diameter: 31.7 mm, outer diameter: 60.0 mm, radius of curvature: 50.0 mm; H-108, SonicConcepts, Seattle, WA, USA) was driven by a function generator (33560B, Keysight Inc., Santa Rosa, CA, USA) connected to a 50-dB amplifier (Electronics and Innovation Ltd., Rochester, NY, USA). The lateral and axial beam sizes (full width at half maximum) were 0.4 mm and 2.6 mm, respectively. A diagram and a picture of the experimental setup are provided in Fig. 1.
FIG. 1.
Presentation of the experimental setup. (a) Diagram of the experimental setup. The 3D positioning system, the function generator, and the thermocouple measurements are controlled using a single Matlab script. (b) Picture of the experimental setup highlighting its main features.
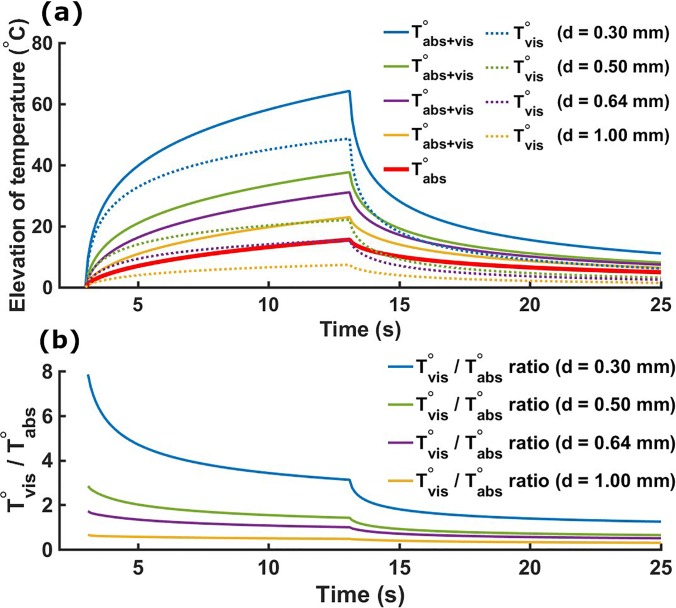
The numerical solution demonstrated in our study was implemented based on the analytical solution described by the Fry brothers23 and their companion paper reporting the experimental validation.24 The validation of our Qvis source was made by comparing the peak temperature measured experimentally with the peak temperature obtained using the simulation (using Qabs and Qvis). A maximum error of 10% was found in our study. We first investigated the contribution of the viscous heating in the temperature elevation for different thermocouple diameters. Figure 2(a) shows the simulated temperature elevations for four different thermocouples using 10-s single pulses at 1 MPa (ISPTA = 33.7 W cm−2). The temperature rise due to absorption and viscous heating was obtained by simulating the two heating sources Qabs and Qvis. The temperature rise solely due to absorption was obtained considering only Qabs, while the artifactual temperature rise due to viscous heating was obtained by subtracting the absorptive temperature contribution from the full temperature rise. The artifactual temperature elevation after sonication was 49 °C (diameter d = 0.30 mm), 22 °C (d = 0.50 mm), 16 °C (d = 0.64 mm), and 7.4 °C (d = 1.00 mm). The magnitude of the viscous heating artifact was inversely proportional to the thermocouple diameter, as observed experimentally by Morris et al.25 The Tvis/Tabs ratios for all thermocouples were maximum at the beginning of sonication and decreased over time, followed by a rapid decrease in this ratio at the end of sonication during the cooling period [Fig. 2(b)].
FIG. 2.
(a) Simulated temperature elevations using four different thermocouples (respective diameters d = 0.30 mm, d = 0.50 mm, d = 0.64 mm, and d = 1.00 mm). Solid lines present the temperature rise with both absorption and viscous heating (VH) inputs (Qabs and Qvis on). The solid red line presents the temperature rise with absorption only (Qabs on and Qvis off). Dashed lines present the viscous temperature rise obtained from subtracting the absorption only temperature elevation (solid red line) from the absorption and viscous heating (solid lines) temperature increases. (b) Simulated Tvis/Tabs ratios. This ratio is maximal after the start of sonication and decreases until its end (3 s < t < 13 s). A quick decrease in this ratio also appears at the beginning of the cooling period (t = 13 s).
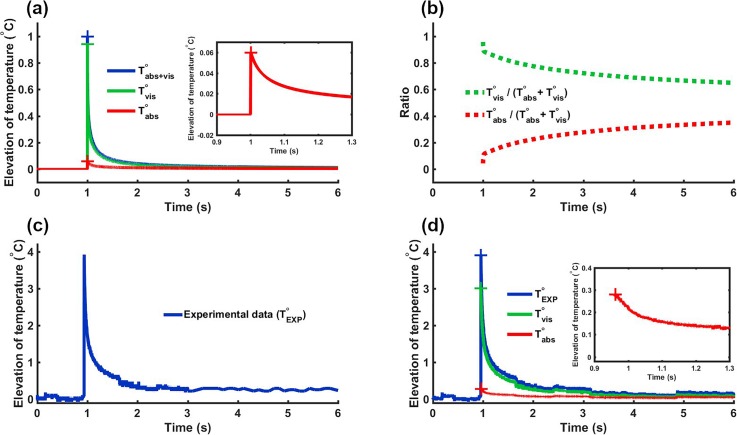
Beyond recovering fundamental properties of the viscous heating artifact, we further used our modeling to remove its contribution from experimental data. We verified that the relative proportion of the viscous heating on temperature elevation was independent over a large range of pressures. As a result, the proportion of viscous temperature Tvis/(Tabs + Tvis) and the proportion of absorption temperature Tabs/(Tabs + Tvis) can be derived at a given pressure and applied to correct data acquired at a slightly different pressure. Figure 3 illustrates this procedure for a single pulse of 1 ms at 22 MPa. Figure 3(a) shows the normalized temperature elevations at various conditions (sum of absorption and viscous, absorption only and viscous only) derived from the numerical simulation. Figure 3(b) presents the ratio Tvis/(Tabs + Tvis) derived from Fig. 3(a). The experimental data [Fig. 3(c)] were then multiplied by this ratio to obtain the temperature rise due to the viscous heating artifact. Figure 3(d) shows the raw experimental data (blue) along with their absorptive (red) and viscous heating artifact (green) components with the corrected temperature elevation shown in red.
FIG. 3.
Presentation of the pipeline for experimental data correction. (a) Normalized simulated temperature elevations (sum of viscous and absorption) for a 1 ms single pulse. (b) Tvis/(Tabs + Tvis) (green) and Tabs/(Tabs + Tvis) (red) ratios computed from simulations of (a). (c) Experimental data to correct (1 ms pulse at 22 MPa). (d) Corrected data. Viscous and absorptive contributions to temperature elevation are obtained by multiplying raw experimental data by the ratios presented in (b).
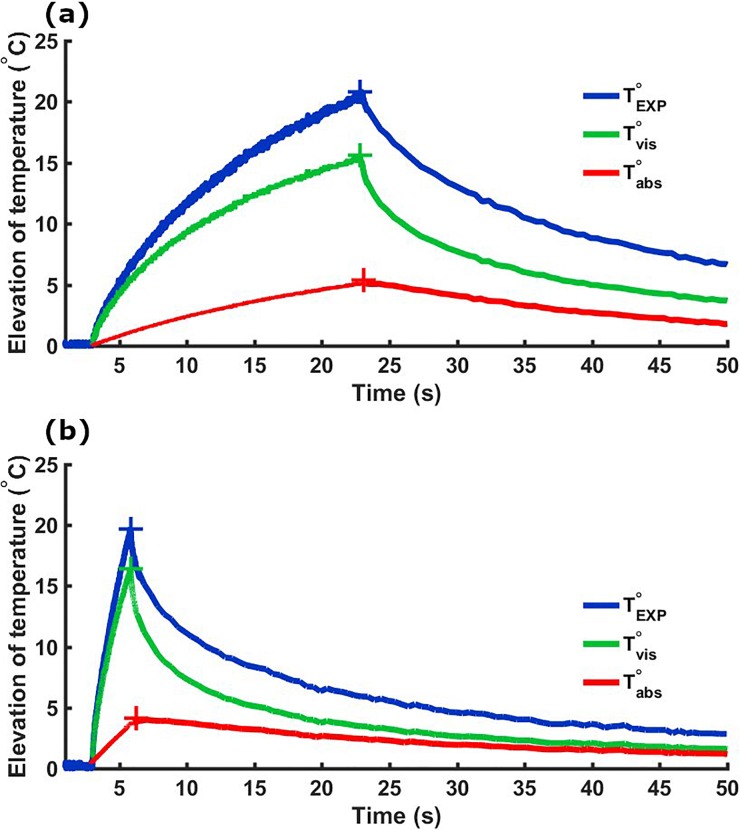
Finally, the same procedure was applied to correct temperature measurements obtained from the pulsed sequence. The most prominent artifact is expected at the start of sonication, leading to a rapid increase in temperature of the tissue surrounding the thermocouple. After a certain time, the viscous heating contribution reaches a plateau and any further temperature increase is due to absorption and conduction mechanisms. The stabilization of the artifact for the continuous wave sonication can be visualized in Fig. 2(b). However, the stabilization of the viscous heating is expected to be disrupted by pulsed sonication as a strong vibration of the thermocouple is introduced by the application of multiple pulses. Figure 4(a) presents an example of temperature elevation generated by a pulsed sonication used in pulsed-HIFU protocols to enhance drug delivery in tumoral tissues13–18 (8.8 MPa pulsed at a 100-Hz pulse repetition frequency, 10% duty cycle, and 20 s total duration). Additionally, we present the viscous heating and corrected experimental data for a pulsed sequence with a PRF of 500 Hz, a duty cycle of 50%, and a total sonication time of 2 s to demonstrate the robustness of our method. This study was limited to explore pressure levels where no cavitation is expected. Future work will explore the artifact introduced by cavitation in thermocouple measurements.
FIG. 4.
Temperature measurements with (red curves) and without (blue curves) correction of the viscous heating artifact. Two sequences made of 1 ms pulses at 8.8 MPa (peak negative pressure) with different PRF values are presented. (a) PRF = 100 Hz, duty cycle = 10%, and total duration = 20 s. (b) PRF = 500 Hz, duty cycle = 50%, and total duration = 2 s.
In summary, the simulation pipeline described herein allowed for the theoretical investigation of the viscous heating artifact generated by thermocouples exposed to FUS fields. We propose a method for correcting data acquired under variable experimental conditions. We presented an example case for p-HIFU applications that can also be used to correct experimental data acquired during tissue ablation procedures and other ultrasound therapies. The scope of this technique facilitates the characterization of tissue thermal properties under FUS procedures and the calibration of noninvasive thermometry techniques.
Acknowledgments
This study was supported in part by SoundStim Therapeutics, DARPA (HR0011-15-2-0054), Fonds ESPCI, and NIH (R01EB027576).
References
- 1. Wang Y., Wang Z.-B., and Xu Y.-H., Korean J. Radiol. 19, 724 (2018). 10.3348/kjr.2018.19.4.724 [DOI] [PMC free article] [PubMed] [Google Scholar]
- 2. Stewart E. A., Lytle B. L., Thomas L., Wegienka G. R., Jacoby V., Diamond M. P., Nicholson W. K., Anchan R. M., Venable S., Wallace K., Marsh E. E., Maxwell G. L., Borah B. J., Catherino W. H., and Myers E. R., Am. J. Obstet. Gynecol. 219, 95.e1 (2018). 10.1016/j.ajog.2018.05.004 [DOI] [PMC free article] [PubMed] [Google Scholar]
- 3. Linares-Espinós E., Carneiro A., Martínez-Salamanca J. I., Bianco F., Castro-Alfaro A., Cathelineau X., Valerio M., and Sanchez-Salas R., Minerva Urologica e Nefrologica 70, 252 (2018). 10.23736/S0393-2249.18.03094-1 [DOI] [PubMed] [Google Scholar]
- 4. Duran-Rivera A., Garcia A. M., Escudero J. J., Abad P. G., Arjona M. F., and Alcina E. L., Actas Urol. Esp. 42, 450 (2018). 10.1016/j.acuro.2017.11.007 [DOI] [PubMed] [Google Scholar]
- 5. Merckel L. G., Knuttel F. M., Deckers R., van Dalen T., Schubert G., Peters N. H. G. M., Weits T., van Diest P. J., Mali W. P. T. M., Vaessen P. H. H. B., van Gorp J. M. H. H., Moonen C. T. W., Bartels L. W., and van den Bosch M. A. A. J., Eur. Radiol. 26, 4037 (2016). 10.1007/s00330-016-4222-9 [DOI] [PMC free article] [PubMed] [Google Scholar]
- 6. Peek M. C., Ahmed M., Napoli A., Usiskin S., Baker R., and Douek M., Int. J. Hyperthermia 33, 191 (2017). 10.1080/02656736.2016.1230232 [DOI] [PubMed] [Google Scholar]
- 7. Knuttel F. M., Huijsse S. E. M., Feenstra T. L., Moonen C. T. W., van den Bosch M. A. A. J., Buskens E., Greuter M. J. W., and de Bock G. H., J. Ther. Ultrasound 5, 23 (2017). 10.1186/s40349-017-0101-3 [DOI] [PMC free article] [PubMed] [Google Scholar]
- 8. Aubry J.-F., Pauly K. B., Moonen C., Haar G., Ries M., Salomir R., Sokka S., Sekins K. M., Shapira Y., Ye F., Huff-Simonin H., Eames M., Hananel A., Kassell N., Napoli A., Hwang J. H., Wu F., Zhang L., Melzer A., Kim Y.-S., and Gedroyc W. M., J. Ther. Ultrasound 1, 13 (2013). 10.1186/2050-5736-1-13 [DOI] [PMC free article] [PubMed] [Google Scholar]
- 9. Orsi F., Arnone P., Chen W., and Zhang L., J. Cancer Res. Ther. 6, 414 (2010). 10.4103/0973-1482.77064 [DOI] [PubMed] [Google Scholar]
- 10. MacDonell J., Patel N., Rubino S., Ghoshal G., Fischer G., Burdette E. C., Hwang R., and Pilitsis J. G., Neurosurg. Focus 44, E11 (2018). 10.3171/2017.11.FOCUS17613 [DOI] [PMC free article] [PubMed] [Google Scholar]
- 11. Kim M., Jung N. Y., Park C. K., Chang W. S., Jung H. H., and Chang J. W., Stereotactic Funct. Neurosurg. 95, 279 (2017). 10.1159/000478866 [DOI] [PubMed] [Google Scholar]
- 12. Poon C. T., Shah K., Lin C., Tse R., Kim K. K., Mooney S., Aubert I., Stefanovic B., and Hynynen K., Sci. Rep. 8, 14061 (2018). 10.1038/s41598-018-32250-3 [DOI] [PMC free article] [PubMed] [Google Scholar]
- 13. Ziadloo A., Xie J., and Frenkel V., J. Acoust. Soc. Am. 133, 1827 (2013). 10.1121/1.4789390 [DOI] [PMC free article] [PubMed] [Google Scholar]
- 14. Dromi S., Frenkel V., Luk A., Traughber B., Angstadt M., Bur M., Poff J., Xie J., Libutti S. K., Li K. C., and Wood B. J., Clin. Cancer Res. 13, 2722 (2007). 10.1158/1078-0432.CCR-06-2443 [DOI] [PMC free article] [PubMed] [Google Scholar]
- 15. Frenkel V., Etherington A., Greene M., Quijano J., Xie J., Hunter F., Dromi S., and Li K. C., Acad. Radiol. 13, 469 (2006). 10.1016/j.acra.2005.08.024 [DOI] [PubMed] [Google Scholar]
- 16. Hancock H. A., Smith L. H., Cuesta J., Durrani A. K., Angstadt M., Palmeri M. L., Kimmel E., and Frenkel V., Ultrasound Med. Biol. 35, 1722 (2009). 10.1016/j.ultrasmedbio.2009.04.020 [DOI] [PMC free article] [PubMed] [Google Scholar]
- 17. O'Neill B. E., Vo H., Angstadt M., Li K. P., Quinn T., and Frenkel V., Ultrasound Med. Biol. 35, 416 (2009). 10.1016/j.ultrasmedbio.2008.09.021 [DOI] [PMC free article] [PubMed] [Google Scholar]
- 18. Sun Y., Xiong X., Pandya D., Jung Y., Mintz A., Hayasaka S., Wadas T. J., and Li K. C., J. Controlled Release 256, 1 (2017). 10.1016/j.jconrel.2017.04.017 [DOI] [PMC free article] [PubMed] [Google Scholar]
- 19. Rieke V. and Butts Pauly K., J. Magn. Reson. Imaging 27, 376 (2008). 10.1002/jmri.21265 [DOI] [PMC free article] [PubMed] [Google Scholar]
- 20. Pernot M., Tanter M., Bercoff J., Waters K. R., and Fink M., IEEE Trans. Ultrason., Ferroelectr., Freq. Control 51, 606 (2004). 10.1109/TUFFC.2004.1320832 [DOI] [PubMed] [Google Scholar]
- 21. Seip R. and Ebbini E. S., IEEE Trans. Biomed. Eng. 42, 828 (1995). 10.1109/10.398644 [DOI] [PubMed] [Google Scholar]
- 22. Simon C., VanBaren P., and Ebbini E. S., IEEE Trans. Ultrason., Ferroelectr., Freq. Control 45, 1088 (1998). 10.1109/58.710592 [DOI] [PubMed] [Google Scholar]
- 23. Fry W. J. and Fry R. B., J. Acoust. Soc. Am. 26, 294 (1954). 10.1121/1.1907332 [DOI] [Google Scholar]
- 24. Fry W. J. and Fry R. B., J. Acoust. Soc. Am. 26, 311 (1954). 10.1121/1.1907333 [DOI] [Google Scholar]
- 25. Morris H., Rivens I., Shaw A., and ter Haar G., Phys. Med. Biol. 53, 4759 (2008). 10.1088/0031-9155/53/17/020 [DOI] [PubMed] [Google Scholar]
- 26. Huang J., Holt R. G., Cleveland R. O., and Roy R. A., J. Acoust. Soc. Am. 116, 2451 (2004). 10.1121/1.1787124 [DOI] [PubMed] [Google Scholar]
- 27. Bacon D. R. and Shaw A., Phys. Med. Biol. 38, 1647 (1993). 10.1088/0031-9155/38/11/010 [DOI] [PubMed] [Google Scholar]
- 28. Shaw A., Pay N. M., Preston R. C., and Bond A. D., Ultrasound Med. Biol. 25, 121 (1999). 10.1016/S0301-5629(98)00136-7 [DOI] [PubMed] [Google Scholar]
- 29. Pennes H. H., J. Appl. Physiol. 1, 93 (1948). 10.1152/jappl.1948.1.2.93 [DOI] [PubMed] [Google Scholar]
- 30. Treeby B. E., Jaros J., Rendell A. P., and Cox B. T., J. Acoust. Soc. Am. 131, 4324 (2012). 10.1121/1.4712021 [DOI] [PubMed] [Google Scholar]
- 31. Goss S., Frizzell L., and Dunn F., Ultrasound Med. Biol. 5, 181 (1979). 10.1016/0301-5629(79)90086-3 [DOI] [PubMed] [Google Scholar]
- 32. Damianou C. A., Sanghvi N. T., Fry F. J., and Maass-Moreno R., J. Acoust. Soc. Am. 102, 628 (1997). 10.1121/1.419737 [DOI] [PubMed] [Google Scholar]
- 33. Azhari H., Basics of Biomedical Ultrasound for Engineers ( John Wiley & Sons, 2010). [Google Scholar]


