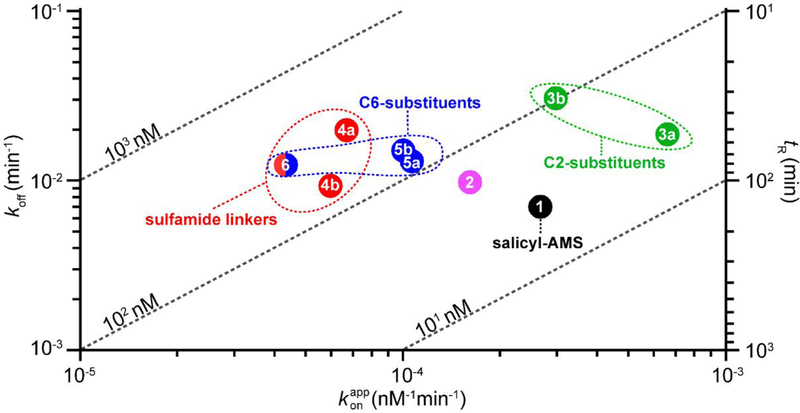
Figure 7.
Two-dimensional kinetic map for salicyl-AMS and its analogues. The map represents the data summarized in Table 1 and facilitates visualization of relationships between inhibitors and the kinetic parameters koff, , tR, and (diagonal dashed lines) noted in the text. The clustering of analogues with sulfamide-based linkers (4a, 4b, 6; red oval), modifications at C2 (3a, 3b; green oval), and modifications at C6 (5a, 5b, 6; blue oval) is indicated.

