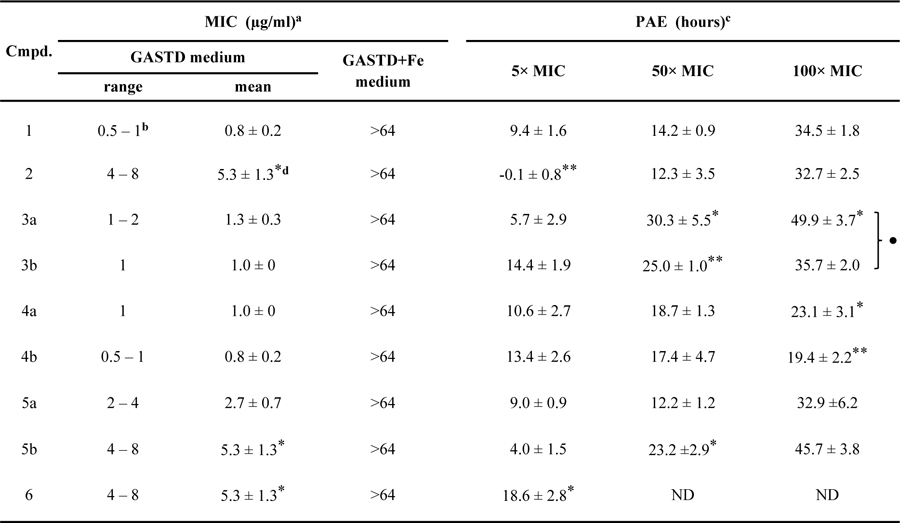
Table 3.
Antimicrobial activity and post-antibiotic effect of MbtAtb inhibitors in M. smegmatis ∆EM-pMbtAtb
 |
MIC data against Msm ∆EM-pMbtAtb shown represent ranges and mean values ± SEM of n = 3 independent experiments.
The MIC value for 1 was derived from experiments independent from those that rendered the MIC value shown in Table 2.
PAE was calculated as the difference between the time-to-threshold values of the inhibitor-exposed culture and the control cultures (Figure S9). The PAE data in Msm ∆EM-pMbtAtb represent mean values ± SEM of n = 3 independent experiments.
Statistical significance as per Student’s t-test is indicated.
*, *, and *** represent p values of ≤0.05; ≤0.01, and ≤0.001, respectively, for analogues vs. 1. ● represents p value of ≤0.05 for 3a vs. 3b, 4a vs. 4b, and 5a vs. 5b pairs. No dots or asterisks indicate no statistical significance. ND, not determined.
