

Abstract
Nicotinamide mononucleotide (NMN) is a biosynthetic precursor of NAD+ known to promote cellular NAD+ production and counteract age-associated pathologies associated with a decline in tissue NAD+ levels. How NMN is taken up into cells has not been entirely clear. Here we show that the Slc12a8 gene encodes a specific NMN transporter. We find that Slc12a8 is highly expressed and regulated by NAD+ in the murine small intestine. Slc12a8 knockdown abrogates the uptake of NMN in vitro and in vivo. We further show that Slc12a8 specifically transports NMN, but not nicotinamide riboside, and that NMN transport depends on the presence of sodium ion. Slc12a8 deficiency significantly decreases NAD+ levels in the jejunum and ileum, which is associated with reduced NMN uptake as traced by doubly labeled isotopic NMN. Finally, we observe that Slc12a8 expression is upregulated in the aged murine ileum, which contributes to the maintenance of ileal NAD+ levels. Our work identifies the first NMN transporter and demonstrates that Slc12a8 has a critical role in regulating intestinal NAD+ metabolism.
Introduction
It has been well documented that NAD+ declines in many tissues during aging, including skeletal muscle, liver, adipose tissue, brain, pancreas, spleen, heart, kidney, and lung, contributing to the development of various age-associated pathophysiologies 1–4. This phenomenon is caused, at least in part, by two molecular events: the age-associated decrease in NAD+ biosynthesis mediated by nicotinamide phosphoribosyltransferase (NAMPT), the rate-limiting NAD+ biosynthetic enzyme in mammals 5, and the age-associated increase in NAD+ consumption mediated by NAD+-consuming enzymes, such as poly-ADP-ribose polymerases 6 and CD38 7. In mammalian NAD+ biosynthesis, nicotinamide is a predominant precursor, and NAMPT catalyzes the conversion of nicotinamide and 5’-phosphoribose pyrophosphate into nicotinamide mononucleotide (NMN), a key NAD+ intermediate 8,9. NMN is also synthesized from nicotinamide riboside (NR), another NAD+ intermediate, by NR kinases, NRK1 and 2 10. NMN, together with ATP, is then converted into NAD+ by NMN adenylyltransferases, NMNAT1–3. A number of studies have reported that NMN conveys remarkable effects of improving disease conditions and mitigating age-associated physiological decline 5,11–18. For example, NMN treatment is able to restore glucose-stimulated insulin secretion in aged C57BL/6 mice and some genetic mouse models that show reduced insulin-secreting capability 19,20. NMN also enhances insulin sensitivity and secretion in mouse models of diet- and age-induced type 2 diabetes or obesity 5,11. NMN has also been shown to prevent ischemia/reperfusion injury in the heart 18. In addition, NMN maintains the neural stem/progenitor cell population in the aged hippocampus, improves mitochondrial function in aged skeletal muscle, and reverses arterial dysfunction in aged mice 12,13,16. In rodent models of Alzheimer’s disease, NMN is able to protect mitochondrial and cognitive functions 14,17. We have also demonstrated previously that NMN effectively mitigates age-associated physiological decline in regular chow-fed wild-type mice 15. Collectively, these findings strongly suggest that NMN is a critical endogenous compound for NAD+ biosynthesis and can be used as an efficient therapeutic and in preventive intervention against many age-associated disease conditions.
We have previously shown that NMN is absorbed from the gut into blood circulation within 2–3 min and transported into tissues within 10–30 min 5,15. NMN is then immediately utilized for NAD+ biosynthesis, significantly increasing NAD+ content in tissues over 60 min. This fast pharmacokinetics has recently been confirmed by using doubly labeled isotopic NMN (C13-D-NMN), showing its rapid absorption and conversion to NAD+ in peripheral tissues 15. On the other hand, it has also been proposed that NMN is converted extracellularly to NR, which is transported into cells and reconverted to NMN 21. Recent studies, however, have shown that the analyses of in vivo kinetics of these NAD+ intermediates are affected by differences in sample collection and extraction methodologies 22,23 (also see the Methods section). Therefore, it is critical to understand the mechanism by which NMN or NR is transported into cells or tissues. The fast pharmacokinetics of NMN led us to the hypothesis that there is an effective transporter that facilitates the direct uptake of NMN into the gut and other organs. Thus, we set out to identify this presumed NMN transporter in mammals.
Results
Identification of a NMN transporter
In our previous studies, we noticed that when NAMPT-mediated NAD+ biosynthesis was inhibited by FK866, a potent NAMPT inhibitor, in various types of primary cells, co-administration of NMN always produced higher NAD+ increases, compared to those that NMN induces in the absence of FK866 5,16,20. Thus, we hypothesized that the expression of a presumed NMN transporter might be upregulated when NAD+ levels decrease. Based on this hypothesis, we conducted gene expression profiling in FK866-treated primary mouse hepatocytes, pancreatic islets, and hippocampal neurospheres, searching for genes commonly upregulated in these three primary cultures. We focused our searches to genes that encode transporters or transmembrane proteins and found only one gene that fitted these criteria but whose function was unknown. This gene, Slc12a8, exhibited 2.06, 1.69, and 4.91 for Z ratio in primary hepatocytes, islets, and neurospheres, respectively (Fig. 1a). The Slc12a8 gene belongs to the SLC12 gene family of the electroneutral cation-chloride-coupled cotransporters, and the function of the protein encoded by this gene remains unknown 24. Close homologs exist in mouse, human, zebrafish, Drosophila, and C. elegans (Supplementary Fig. 1a). Although amino acid sequences are significantly diverged, the predicted ten membrane-spanning domains are conserved throughout these Slc12a8 homologs (Supplementary Fig. 1b). Slc12a8 is highly expressed in the small intestine and pancreas and moderately in the liver and white adipose tissue (Fig. 1b). We confirmed that Slc12a8 expression was induced significantly in mouse primary hepatocytes, mouse NIH3T3 fibroblasts, and ex vivo explants of jejunum and ileum when NAD+ was reduced by treatment with FK866, whereas this induction was suppressed when NAD+ was restored by co-administration of FK866 and NMN (Fig. 1c and Supplementary Figs. 1c-d).
Figure 1.
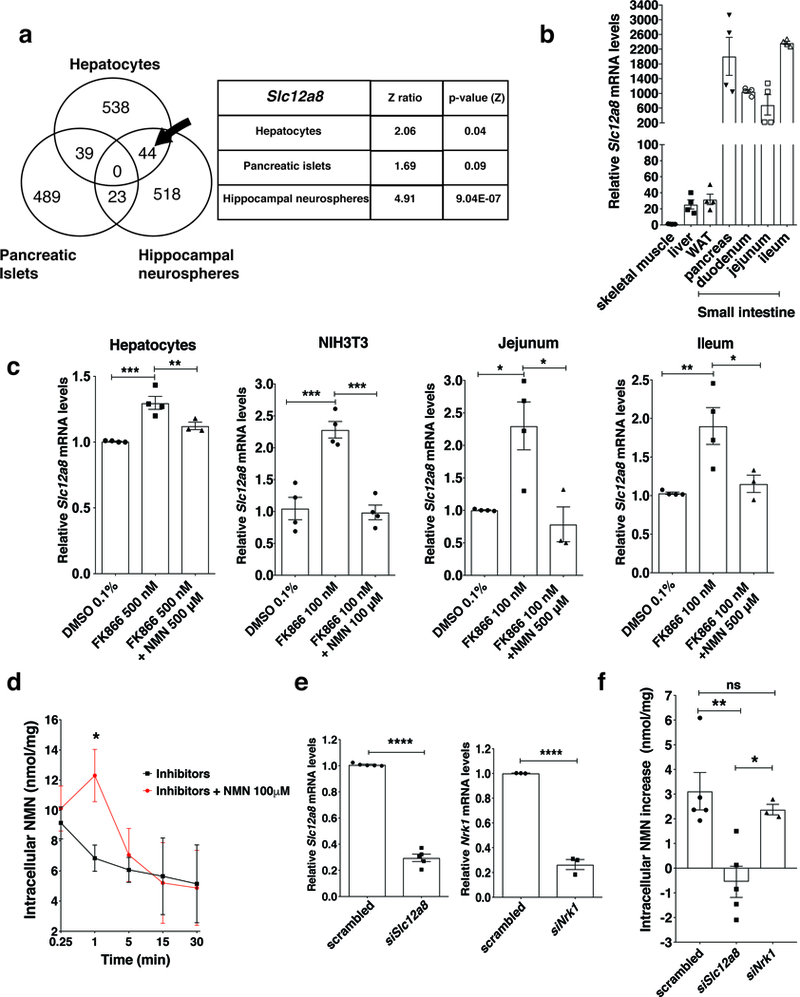
Identification and characterization of the Slc12a8 gene. a, Venn diagram of genes commonly upregulated in primary hepatocytes, pancreatic islets, and hippocampal neurospheres treated with FK866. Slc12a8 was identified in the section indicated by an arrow. Z ratios and two-sided p values for Slc12a8 in each cell type were calculated as described in the Methods section (n=4 biologically independent samples). b, Relative Slc12a8 mRNA levels in different tissues from B6 male mice at 3 months of age (n=4 mice). WAT, white adipose tissue. c, Relative Slc12a8 mRNA levels in primary mouse hepatocytes (n=4 mice, ** p=0.0191, ***p=0.0006), NIH3T3 fibroblasts (n=4 biologically independent samples, DMSO vs. FK866 ***p=0.0004, FK866 vs. FK866 plus NMN ***p=0.0003), and ex vivo explants of the jejunum and ileum (n=4 mice for DMSO and FK866 alone; n=3 mice for FK866 plus NMN; Jejunum, DMSO vs. FK866 *p=0.0168, FK866 vs. FK866+NMN *p=0.0111; Ileum, DMSO vs. FK866 **p=0.009, FK866 vs. FK866+NMN *p=0.0313) treated with 0.1% DMSO, FK866 alone or FK866 plus NMN (24h for cells, and 4 h for explants; analyzed using ANOVA with Tukey’s test). d, Time course of NMN uptake in mouse primary hepatocytes. Hepatocytes were pretreated with 500 nM FK866 for 24 h and then incubated with a cocktail of 20 μM dipyridamole, 500 μM AOPCP, and 500 nM FK866, with or without 100 μM NMN. NMN was measured by HPLC (n=4 mice, except for 3 data sets for 15 and 30 time points for inhibitors only; analyzed using ANOVA with Sidak’s test, *p=0.0262). e, Knockdown efficiencies of Slc12a8 and Nrk1 mRNA in mouse primary hepatocytes (n=5 mice for Slc12a8 silencing and n=3 for Nrk1 silencing; analyzed by unpaired two-sided t-test, siSlc12a8 ****p<0.0001, siNrk1 ****p<0.0001). f, Increases in intracellular NMN content measured by HPLC in primary hepatocytes treated with scrambled, Slc12a8, and Nrk1 siRNA at 1 min after addition of 100 μM NMN. Culture conditions were the same as described in d (n=5 mice for Slc12a8 silencing and n=3 for Nrk1 silencing; analyzed by ANOVA with Tukey’s test, **p=0.0052, *p=0.0413). All values are presented as mean ± SEM.
To begin to examine whether the Slc12a8 gene encodes the NMN transporter, we first determined the kinetics of NMN uptake in mouse primary hepatocytes. To inhibit the extracellular degradation of NMN to NR by CD73, the uptake of NR into cells through nucleoside transporters, and the intracellular NMN synthesis by NAMPT, we used AOPCP (adenosine-5′-[α, β-methylene]diphosphate), dipyridamole, and FK866, respectively. AOPCP inhibits 5’-nucleotidase activity by 97% (Supplementary Fig. 1f). A cocktail of these inhibitors did not affect cell viability up to 30 min (Supplementary Fig. 1e). In the presence of these inhibitors, we added 100 μM NMN and found that intracellular NMN levels significantly increased at 1 min time point compared to the control in mouse primary hepatocytes (Fig. 1d). In this condition using the same inhibitors and 100 μM NMN, we knocked down Slc12a8 and Nrk1, a major NR kinase that converts NR to NMN intracellularly 10, and examined the uptake of NMN at 1 min time point in primary hepatocytes. The knockdown (KD) efficiencies for both genes are approximately 80% (Fig. 1e). Interestingly, the fast uptake of NMN was completely abrogated in Slc12a8-KD hepatocytes, whereas no significant reduction in NMN uptake was observed in Nrk1-KD hepatocytes (Fig. 1f), suggesting that Slc12a8 is necessary for the fast uptake of NMN in primary hepatocytes, and the observed increase in intracellular NMN is not due to the conversion of NR or nicotinamide into NMN.
Biochemical features of the Slc12a8 protein
Next, we overexpressed the full-length mouse Slc12a8 cDNA in mouse NIH3T3 cells. We chose this cell line because it does not have any detectable extracellular activities of CD73 (converting NMN to NR) and CD38 (degrading NMN to nicotinamide and phosphoribose) and also has very weak NMN uptake activity (see Fig. 2b). The observed molecular weight of the full-length Slc12a8 protein is ~90 kDa, which was also confirmed with N- and C-terminally FLAG-tagged Slc12a8 proteins (Supplementary Fig. 2a). Slc12a8 protein levels were significantly increased ~2.2-fold in Slc12a8-overexpressing NIH3T3 (Slc12a8-OE) cells (Fig. 2a). We then determined the kinetics of NMN uptake using 3H-labeled NMN in Slc12a8-OE and control cells. The uptake of 3H-NMN was significantly enhanced at 3 and 5 min time points in Slc12a8-OE cells, compared to control cells (Fig. 2b). Using these Slc12a8-OE cells, we determined the Michaelis-Menten parameters for the Slc12a8 protein. The Km and the Vmax for NMN were calculated to be 34.1 ± 8.3 μM and 11.5 ± 1.2 pmol/min/mg, respectively (Fig. 2c). Notably, this Km is consistent with a detected range of NMN concentrations in mouse plasma and erythrocytes 20,25,26. To further analyze the specificity of Slc12a8, we produced proteoliposomes by combining the membrane fractions of Slc12a8-OE or control NIH3T3 cells with the phospholipid bilayers derived from deproteinized erythrocyte plasma membrane. Slc12a8-OE-derived proteoliposomes incorporated significantly higher (~2-fold) levels of 3H-NMN than those in control-derived proteoliposomes (Supplementary Fig. 2b). Using these Slc12a8-OE proteoliposomes, we examined whether the uptake of 3H-NMN into proteoliposomes would be competed by excess amounts of various cold NAD+-related compounds. 150 μM of cold NMN showed complete competition against 3H-NMN uptake, whereas NAD+, AMP, nicotinic acid mononucleotide (NaMN), and nicotinamide showed minimal or negligible competition at the same concentration (Fig. 2d). We confirmed that NaMN, a structurally very similar compound to NMN, was not transported into Slc12a8-OE proteoliposomes (Supplementary Fig. 2c). Interestingly, 150 μM NR exhibited ~70% displacement (Fig. 2d), and therefore, we further determined IC50 concentrations for NMN and NR, using the proteoliposome system. The IC50 for NMN was 22.8 ± 3.6 μM, whereas the IC50 for NR was 77.4 ± 10.8 μM (Fig. 2e). This result suggests that the Slc12a8 protein is specific primarily to NMN under physiological conditions because NR levels have not been shown to reach such high concentrations in pathophysiological conditions, such as in blood 22,27 and ascitic exudates 28. To definitively determine the specificity of Slc12a8 between NMN and NR, we gave doubly labeled, 3-Da heavier, isotopic NMN or NR (O18-D-NMN or O18-D-NR) to Slc12a8-OE and control NIH3T3 cells and measured these isotopic compounds transported into cells within 5 min. When treating with 25 μM O18-D-NMN, Slc12a8-OE cells showed approximately 4-fold higher uptake of O18-D-NMN compared to control cells but no increase in O18-D-NR, demonstrating unequivocal NMN uptake without any conversion of NMN to NR outside of cells within 5 min (Fig. 2f). On the other hand, when treating with 25 μM O18-D-NR, equivalent levels of O18-D-NMN synthesis and equivalent transport of O18-D-NR were detected in both Slc12a8-OE and control cells (Fig. 2f). These results clearly demonstrate that Slc12a8 specifically transports NMN, but not NR, in a minute-order.
Figure 2.
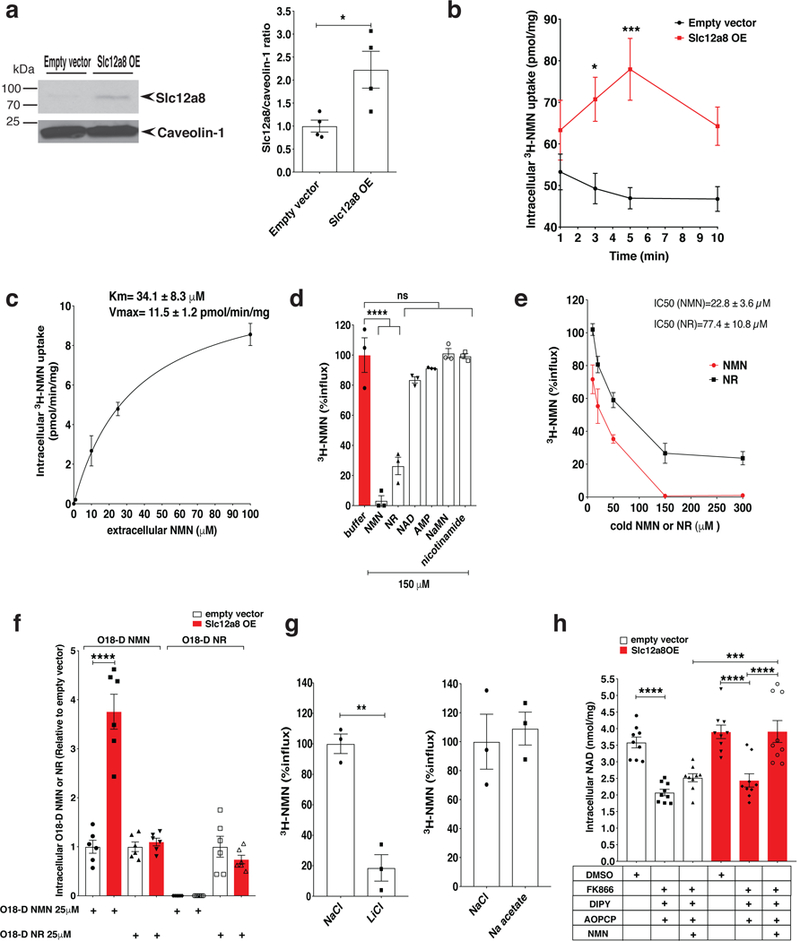
The kinetic features of the Slc12a8 NMN transporter and its specificity, sodium dependency, and effects on NAD+ biosynthesis. a, Slc12a8 protein expression in plasma membrane fractions from control and Slc12a8-OE NIH3T3 cells (left panel). Slc12a8 protein levels normalized to caveolin-1 protein levels are shown for each cell line (right panel; n=4 independent experiments; analyzed by unpaired two-sided t-test, *p=0.0271). b, Uptake of 3H-labeled NMN (3H-NMN; 25 μM, 37°C) in control and Slc12a8-OE NIH3T3 cells (n=12 biologically independent samples; analyzed by ANOVA with Sidak’s test, *p=0.0136, ***p=0.0001). c, Km and Vmax of Slc12a8 for NMN transport. Those values were determined by non-linear regression analysis by subtracting the backgrounds of control cells (n=5 biologically independent samples for 1 and 10 μM, and n=4 biologically independent samples for 25 and 100 μM). d, Substrate specificity of Slc12a8. Transport of 3H-NMN (150 nM, 25°C) into proteoliposomes derived from Slc12a8-OE cells was measured at 2 min in the presence of competing cold compounds (n=3 biologically independent samples, analyzed by ANOVA with Dunnett’s test, ****p=0.0001; ns, not significant). e, The half maximal inhibitory concentrations (IC50) of NMN and NR. Data are shown as percentages of 3H-NMN uptake (n=3 biologically independent samples; IC50 was calculated by non-linear regression analysis). f, Intracellular levels of doubly labeled, isotopic NMN (O18-D-NMN) and NR (O18-D-NR) were measured by mass spectrometry in control and Slc12a8-OE NIH3T3 cells incubated with 25 μM O18-D-NMN or O18-D-NR for 5 min (n=6 biologically independent samples; analyzed by unpaired two-sided t-test, ****p<0.0001). Values are expressed relative to O18-D-NMN or O18-D-NR levels detected in control NIH3T3 cells. g, Ion dependency of NMN uptake by Slc12a8. Sodium ion (Na+) or chloride ion (Cl-) was replaced with an equimolar concentration of lithium (Li+) or acetate, respectively (n=3 biologically independent samples, analyzed by unpaired two-sided t-test, **p=0.0017). h, Intracellular NAD+ content was measured as described in the Methods section (n=9 biologically independent samples; analyzed by ANOVA with Tukey’s test; control, DMSO vs inhibitors ****p<0.0001; Slc12a8-OE, DMSO vs. inhibitors ****p<0.0001, inhibitors vs. inhibitors+NMN ****p<0.0001; control, inhibitors+NMN vs. Slc12a8-OE, inhibitors+NMN ***p=0.0002). All values are presented as mean ± SEM.
We next assessed the ion dependency of Slc12a8 for NMN transport, using the Slc12a8-OE proteoliposome system. When sodium was replaced with lithium, the 3H-NMN incorporation was dramatically reduced by ~80% (Fig. 2g), indicating that NMN transport by Slc12a8 is sodium ion-dependent. Potassium ion is not sufficient to elicit the NMN-transporting function of Slc12a8 (Supplementary Fig. 2d), and chloride ion is not required for NMN transport (Fig. 2g), which distinguishes Slc12a8 from other known Slc12a family members that function as cation-chloride cotransporters 24,29. Lastly, we compared the effect of Slc12a8 overexpression on NAD+ biosynthesis in NIH3T3 cells. When control and Slc12a8-OE NIH3T3 cells were pre-treated for 1 hr with a cocktail of 100 nM FK866, 2 μM dipyridamole, and 500 μM AOPCP, intracellular NAD+ levels were significantly reduced in both control and Slc12a8-OE cells (Fig. 2h). However, additional 1-hr incubation with 100 μM NMN was able to restore NAD+ levels to the original levels only in Slc12a8-OE cells, not in control NIH3T3 cells (Fig. 2h). Furthermore, this Slc12a8-mediated restoration of NAD+ was not affected by WNK463, a specific inhibitor for the WNK kinase that regulates the activity of the cation-chloride cotransporters 29 (Supplementary Fig. 2e). All these results strongly support the function and the specificity of Slc12a8 as a novel NMN transporter in mammals.
In vivo validation of the NMN transporter
To further evaluate the NMN-transporting function of Slc12a8 in vivo, we first knocked down Slc12a8 in the small intestine, one of the tissues that have highest Slc12a8 expression, by giving oral gavages of lentiviruses carrying control firefly luciferase (fLuc) shRNA or Slc12a8 shRNA to young wild-type mice. Slc12a8 protein levels were reduced by ~60% in the jejunum and ~50% in the ileum in the mice receiving the Slc12a8 shRNA-expressing lentivirus in the gut, compared to the mice receiving the fLuc shRNA-expressing lentivirus (Fig. 3a). When orally administering NMN (500 mg/kg body weight) to those mice, plasma NMN levels significantly increased at 5 min in the control mice, whereas they did not increase at all in the Slc12a8-KD mice (Fig. 3b). Instead, plasma nicotinamide levels tended to be higher in Slc12a8-KD mice compared to control mice (Fig. 3c), probably because higher levels of NMN were subjected to degradation to nicotinamide in Slc12a8-KD mice. Consistent with these results, NAD+ levels were significantly decreased in the jejunum of Slc12a8-KD mice compared to control mice (Fig. 3d). In the ileum, there were small NAD+ decreases, which did not reach statistical significance, in Slc12a8-KD mice (Fig. 3d). These results suggest that Slc12a8 in the small intestine is important to transport NMN from the gut into the circulation, affecting NAD+ levels in the small intestine and the systemic NMN supply in vivo.
Figure 3.
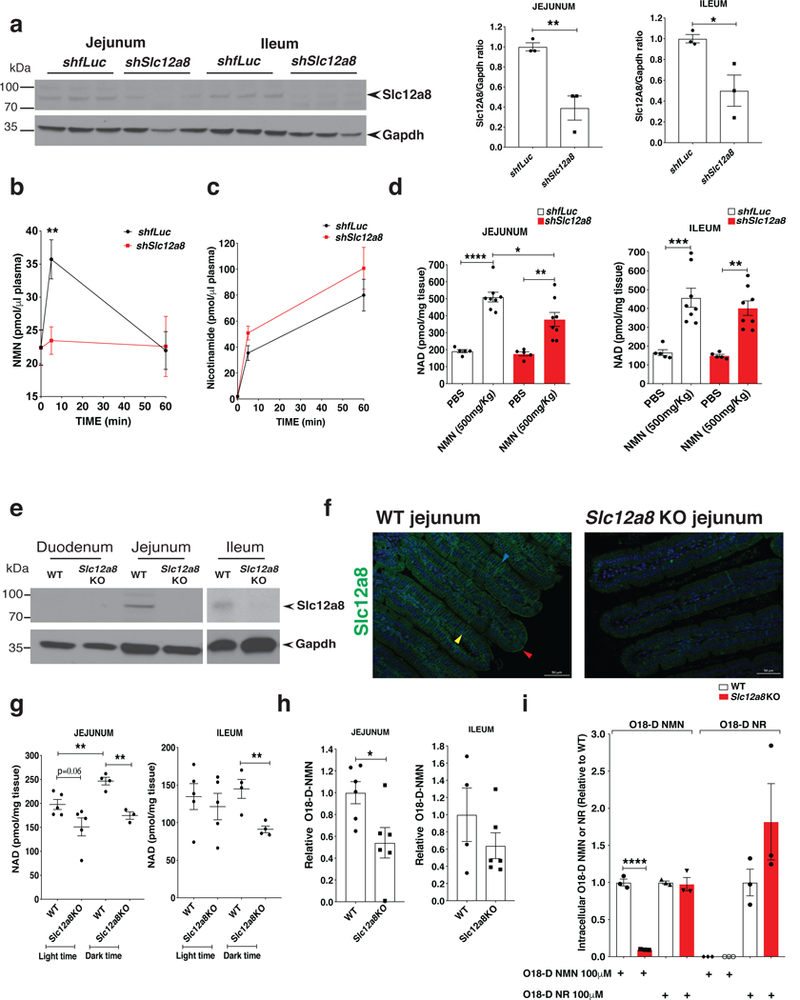
The in vivo knockdown (KD) of Slc12a8 in the small intestine. a, Slc12a8 protein levels in control and Slc12a8 KD jejunum and ileum samples. A representative Western blot is shown (left panel), and bar graphs show Slc12a8 protein levels normalized to Gapdh protein levels (right panel) (n=3 mice, repeated twice; B6 males at 3–4 months of age; analyzed by unpaired two-sided t-test, *p=0.0324, **p=0.0085). b, Plasma NMN levels after an oral gavage of NMN (500 mg/kg body weight) in control and Slc12a8 KD mice (n=6 mice; B6 males at 3–4 months of age; analyzed by ANOVA with Sidak’s test, **p=0.0080). c, Plasma nicotinamide levels in the same mice described in b (n=6 mice). d, Tissue NAD+ levels in the jejunum and ileum samples collected at 60 min time point after an oral gavage, as described in b (n=5 mice for PBS, and n=8 for NMN; B6 males at 3–4 months of age; analyzed by ANOVA with Tukey’s test; Jejunum, shfLuc PBS vs. NMN **** p<0.0001, shSlc12a8 PBS vs. NMN **p=0.0029, shfLuc NMN vs. shSlc12a8 NMN *p=0.0029; Ileum, shfLuc PBS vs. NMN ***p=0.0003, shSlc12a8 PBS vs. NMN **p=0.0030 ). e, Slc12a8 and Gapdh proteins in tissue lysates of the duodenum, jejunum, and ileum of Slc12a8KO mice and wild-type littermates (WT) (n=3 mice). f, Immunostaining of Slc12a8 (green) in the jejunum from 10 month-old Slc12a8KO female mice and WT littermates (n=3 mice). Red, blue, and yellow arrowheads indicate apical, lateral and basal membranes, respectively. Scale bars: 50 μm. g, Tissue NAD+ levels in the jejunum and ileum from Slc12a8KO mice and WT littermates, collected during light time (9–10 am) or during dark time (9–10 pm) (n=5 mice for the light time, and n=4 mice for the dark time, except for the 3 data points for the jejunum of Slc12a8KO mice; females at 8–10 months of age; analyzed by unpaired two-sided t-test; Jejunum, dark time WT vs. Slc12a8KO **p=0.0015, light time WT vs. dark time WT **p=0.0093; Ileum, dark time WT vs. Slc12a8KO **p=0.0069). h, Levels of doubly labeled, isotopic NMN (O18-D-NMN) in the jejunum and ileum by mass spectrometry at 10 min after orally administering 500 mg/kg of O18-D-NMN in Slc12a8KO mice and WT littermates (n=6 mice, 3 males and 3 females at 7–8 months of age, except for 2 males and 2 females for the wild-type ileum; analyzed by unpaired two-sided t-test, *p=0.0239). Values are expressed relative to O18-D-NMN levels detected in WT. i, Intracellular levels of O18-D-NMN and O18-D-NR by mass spectrometry in primary hepatocytes isolated from 5 month-old Slc12a8KO male mice and WT littermates and incubated with 100 μM O18-D-NMN or O18-D-NR for 5 min (n=3 mice; analyzed by unpaired two-sided t-test, ****p<0.0001). Values are expressed relative to O18-D-NMN or O18-D-NR levels detected in WT. All values are presented as mean ± SEM.
We also produced whole-body Slc12a8 knockout (Slc12a8KO) mice by excising the exon 4 of the Slc12a8 gene using the CRISPR-CAS9 system. The birth ratio of these knockout mice was lower than the expected Mendelian ratio, implying that there was some premature death during the embryonic stage. However, the pups that were born safely were able to grow to adults, and they did not show any gross abnormalities. In these adult Slc12a8KO mice, we confirmed that the expression of the full-length Slc12a8 mRNA was completely abolished in tissues (Supplementary Fig. 3a). We also confirmed that the Slc12a8 protein was abolished in the jejunum, ileum, and pancreas of the Slc12a8KO mice by Western blotting (Fig. 3e and Supplementary Fig. 3b). The duodenum does not express the Slc12a8 protein (Fig. 3e), even though it expresses high levels of Slc12a8 mRNA (Fig. 1b). Immunostaining signals of Slc12a8 in the gut, which are detected predominantly in apical, lateral, and basal membranes of the villi in the jejunum and ileum of wild-type mice, were abolished in Slc12a8KO mice (Fig. 3f and Supplementary Fig. 3c), confirming the localization of Slc12a8 in the gut epithelia. Consistent with these findings, the Slc12a8KO mice showed significant decreases in NAD+ levels in the jejunum and ileum, but not in the duodenum, particularly during the dark time when NAD+ levels usually rise (Fig. 3g and Supplementary Fig. 3d). NAD+ decreases were also detected in the pancreas during both light and dark times (Supplementary Fig. 3d). To further confirm whether NMN transport is compromised in the small intestine of the Slc12a8KO mice, we conducted a gavage of doubly labeled, isotopic NMN (O18-D-NMN) and measured the direct uptake of O18-D-NMN into the jejunum and ileum. At 10 min after administering O18-D-NMN by oral gavage, we clearly detected O18-D-NMN in the wild-type jejunum and ileum, whereas the uptake of O18-D-NMN decreased by 46% and 36% in the jejunum and ileum of the Slc12a8KO mice, respectively (Fig. 3h).
Lastly, by using primary hepatocytes from control and Slc12a8KO mice, we again compared the transport of O18-D-NMN and O18-D-NR. When treating with 100 μM O18-D-NMN, Slc12a8KO hepatocytes showed ~90% reduction in O18-D-NMN uptake, compared to control wild-type hepatocytes at 5 min (Fig. 3i). Both cells showed no detectable levels of O18-D-NR (Fig. 3i). On the other hand, when treating with 100 μM O18-D-NR, equivalent levels of O18-D-NMN synthesis were detected in both Slc12a8KO and control hepatocytes, although there appeared to be some compensatory increases in O18-D-NR uptake in Slc12a8KO hepatocytes (Fig. 3i). These results provide strong support for the specificity and the minute-order kinetics of Slc12a8 as a novel NMN transporter.
Slc12a8 maintains NAD+ levels in the aged gut
It has been well documented that NAD+ decreases over age in multiple tissues 4. We found that the jejunum and ileum in 24 month-old mice also showed NAD+ decreases, compared to 2 month-old mice, although the difference did not reach statistical significance in the jejunum (Fig. 4a). Consistent with this phenomenon, Slc12a8 expression was also significantly upregulated in the aged ileum (Fig. 4b). To investigate the biological relevance of this Slc12a8 upregulation in the aged ileum, we first gave an oral gavage of NMN to young (3 month-old) and aged (26 month-old) wild-type mice. Although the absolute plasma NMN levels were lower throughout all time points in aged mice compared to young mice (Fig. 4c), the fold increases of plasma NMN levels were higher in aged mice compared to young mice (Fig. 4d). NAD+ levels were also increased in aged mice to the levels close to young mice after NMN oral gavage (Fig. 4e), and their fold increases were equivalent between young and aged mice (Fig. 4f), indicating that the upregulation of Slc12a8 plays an important role in counteracting age-associated NAD+ decline in the small intestine. To further test this possibility, we conducted oral gavages of lentiviruses carrying control fLuc shRNA and Slc12a8 shRNA to 2- and 24-month-old mice and examined their NAD+ levels in the gut. Knockdown efficiencies were similar between young and aged mice (Supplementary Figs. 4a-b). Significant NAD+ decreases were detected in the ilea of the aged, but not young, Slc12a8-KD mice (Fig. 4g). Luminal NMN content in the jejunum and ileum did not show any significant differences between young and aged mice (Supplementary Fig. 4c). Contrarily, we also overexpressed Slc12a8 in the small intestine of young wild-type mice by giving oral gavages of the Slc12a8-expressing lentivirus. The Slc12a8 protein was overexpressed ~1.5-fold in the ilea (Supplementary Fig. 4d), which induced significant NAD+ increases in the ileum (Supplementary Fig. 4e). Taken together, these results demonstrate that the upregulation of Slc12a8 in the ileum contributes to the maintenance of NAD+ levels in the aged intestine.
Figure 4.
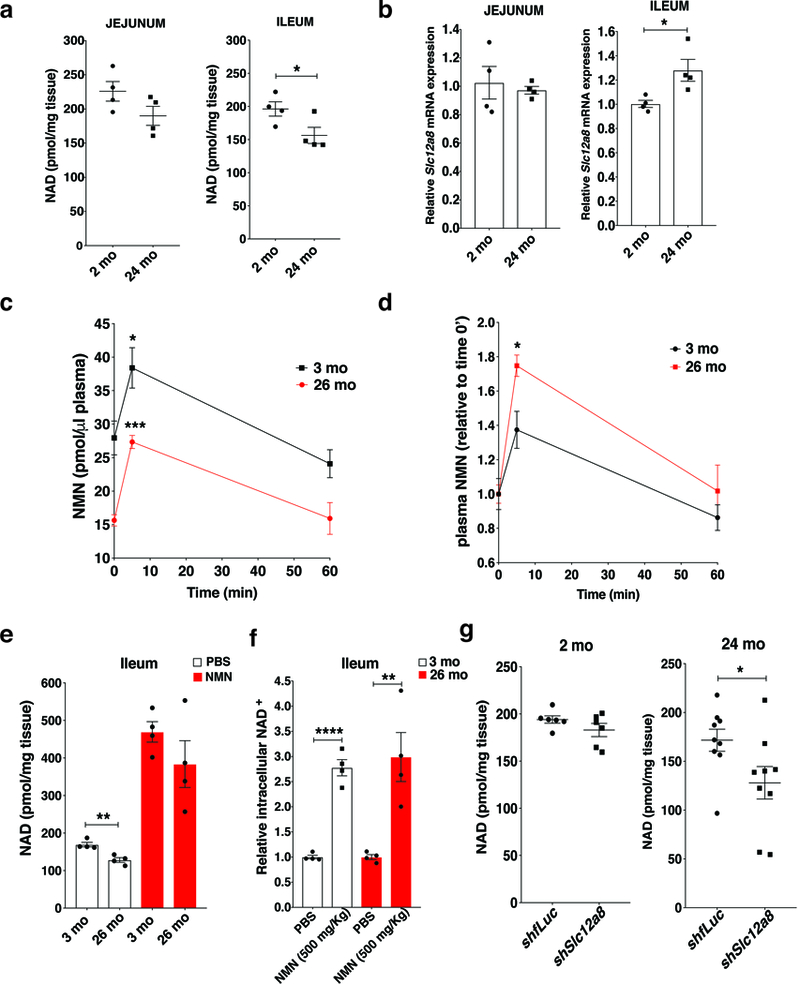
The age-associated upregulation of Slc12a8 in the ileum and its effect on NMN uptake and ileal NAD+ biosynthesis in aged mice. a, b, NAD+ levels (a) and relative Slc12a8 mRNA levels (b) in the jejuna and ilea from 2 month-old (2 mo) and 24-month-old (24 mo) B6 female mice. Tissue samples were collected during the dark time (9–10 pm) (n=4 mice for each age, analyzed by unpaired two-sided t-test; NAD+ levels, *p=0.0492; Slc12a8 mRNA levels, *p=0.0269). c, d, Plasma NMN levels (c) and their relative changes (d) after an oral gavage of NMN (500 mg/kg body weight) in 3 month-old (3 mo) and 26 month-old (26 mo) B6 female mice (n=4 mice; analyzed by ANOVA with Sidak’s test; c, *p= 0.0328, ***p=0.0010; d, *p= 0.0257). e, f, Ileal NAD+ levels (e) and their relative comparisons (f) in the ileal samples collected at 60 min time point after an oral gavage in 3 month-old (3 mo) and 26 month-old (26 mo) B6 female mice (n=4 mice each for PBS and NMN, analyzed by unpaired two-sided t-test; e, **p=0.0033; f, **p=0.0066 **** p<0.0001). g, NAD+ levels in the ilea of 2 and 24 month-old control and intestinal Slc12a8 KD B6 female mice (n=6 mice each for 2 month-old control and intestinal Slc12a8-KD B6 female mice, and n=9 mice each for 24 month-old control and intestinal Slc12a8 KD B6 female mice; analyzed by unpaired two-sided t-test, *p=0.0496). All values are presented as mean ± SEM.
Discussion
We have previously demonstrated that the transport of NMN from the gut to the circulation and then to tissues occurred within 10 min 15. However, the mechanism that mediates such minute-order transport of NMN has so far remained unknown. In this study, we demonstrate that the Slc12a8 gene encodes a novel NMN transporter in mammals. The mRNA expression of the Slc12a8 gene is upregulated in response to NAD+ decline, allowing cells to meet to an urgent demand of NAD+ biosynthesis. The Slc12a8 NMN transporter is specific to NMN and requires the sodium ion for the transport of NMN. The abrogation or the deficiency of Slc12a8 in cell culture and in the small intestine significantly reduces the uptake of NMN, resulting in reduced NAD+ levels in the jejunum and ileum in vivo. Conversely, cellular and intestinal overexpression of full-length Slc12a8 provides a full capacity of NMN transport to the cells that otherwise exhibit minimal NMN transport and also increases ileal NAD+ levels in vivo, respectively. Furthermore, the whole-body Slc12a8KO mice display significant defects in direct, minute-order NMN transport and NAD+ biosynthesis, particularly in the jejunum and ileum. In the aged ileum, Slc12a8 expression is upregulated in response to decreased NAD+ content. Perturbation of this Slc12a8 upregulation in the aged ileum affects homeostatic regulation of ileal NAD+, causing further decreased NAD+ in the aged ileum. Thus, this newly identified NMN transporter encoded by the Slc12a8 gene, namely, the transmembrane nucleotide transporter identified for the first time in mammals, functions to regulate NMN-driven NAD+ biosynthesis and maintain intestinal NAD+ levels in aged individuals.
How NMN is transported into cells has long been a matter of debate in the field of NAD+ biology. It has been believed that NMN needs to be converted first to NR by CD73 outside of cells and then NR is transported into cells, likely through the nucleoside transporter, and reconverted to NMN by NRK1/2 21,30. Although this process can occur over the course of 24h 21, such hourly kinetics cannot explain the minute-order uptake of NMN into the cell. Additionally, how to analyze the in vivo kinetics of NMN is also critical, and the results could be significantly affected by differences in sample collection and extraction methodologies 22,23. For example, plasma samples need to be processed immediately after collection, as we did in this study, because freezing blood or plasma samples causes inaccurate measures of NMN levels. The results presented in this study strongly indicate that Slc12a8 is specific to NMN, not to NR, and its Km is consistent with a measured range of NMN concentrations 20,25,26. Even NaMN, structurally very close to NMN, cannot be transported by Slc12a8. Furthermore, its dependency on sodium ion, but not chloride or potassium ions, and its insensitivity to WNK463 distinguish Slc12a8 from other known cation-chloride cotransporters. Nonetheless, because a very high, supra-physiological concentration of NR can compete against NMN, NR might be able to interact with Slc12a8 weakly. To elucidate the precise details of the structure-function relationship between Slc12a8 and NMN, it will be of great importance to determine the crystal structure of the Slc12a8 NMN transporter.
The results from gut-specific Slc12a8-KD mice and whole-body Slc12a8KO mice demonstrate that the major place where NMN is absorbed is the small intestine, particularly the jejunum and ileum. Whereas we can detect NMN in the luminal content of the jejunum and ileum, the source of NMN remains unknown at this moment. For humans, certain vegetables and fruits contain NMN 15. Additionally, it has been reported that human and cow milk contains NMN at micromolar concentrations 31,32. For mice, one interesting possibility is that NMN could be produced from the enzymatic degradation of NAD+ in the small intestine. Another possibility is that certain gut bacterial species may produce NMN. If this is the case, the Slc12a8 NMN transporter would likely play a critical role in the symbiotic regulation of NAD+ biosynthesis between the microbiota and the host.
Remarkably, the function of the Slc12a8 NMN transporter becomes crucial in aged individuals compared to young ones. In response to significant decreases in NAD+ levels, the aged ileum upregulates Slc12a8 expression and tries to maintain its NAD+ levels. When enough NMN is supplied, this feedback system can function adequately to maintain comparable levels of NAD+ to those in young ilea. Therefore, increasing NMN availability or stimulating the function of the NMN transporter could effectively counteract age-associated NAD+ decline in the aged small intestine. In addition to aging, the NMN-transporting function of Slc12a8 might also be important for the pathogenesis of some diseases. For example, the human SLC12A8 gene has been identified as a psoriasis susceptibility candidate gene 33. Most recently, it has been reported that the high expression of SLC12A8 and its genetic polymorphism are associated with better prognosis of patients with pancreatic ductal adenocarcinomas 34 and breast cancers 35, respectively. Thus, the Slc12a8 NMN transporter could be a new, interesting target for pharmaceutical drug development.
In conclusion, the identification and the characterization of the Slc12a8 NMN transporter further advances our understanding of the physiological importance of NMN as a key systemic NAD+ intermediate. Because NMN conveys remarkable effects of mitigating age-associated physiological decline in mice 4,15, identifying compounds that could promote the NMN-transporting function of the Slc12a8 protein will provide an interesting opportunity to develop a more effective anti-aging intervention, combined with NMN administration.
Methods
Microarray Analysis.
Total RNA was isolated from primary hepatocytes, pancreatic islets, and hippocampal neurospheres, treated with 0.1% DMSO (control) or FK866 (200 nM for primary hepatocytes, and 10 nM for pancreatic islets and hippocampal neurospheres). Primary hepatocytes and pancreatic islets were isolated from 3 month-old C57BL/6J (B6) male mice (Jackson Laboratories). To determine transcriptional changes induced by FK866 treatment, microarray analyses were conducted using the Illumina Mouse Ref 8 whole genome microarrays (version 2). The background-subtracted raw microarray data were subjected to Z score transformation, and Z ratios were calculated as described previously 5. All data were analyzed by the R statistical software package.
Cell culture and ex vivo small intestine explant culture.
NIH3T3 cells (originally purchased from the American Type Culture Collection [ATCC]) were cultured at 37 °C and 5% CO2 in Dulbecco’s modified Eagle’s medium (DMEM) supplemented with 10% fetal bovine serum (FBS), 100 units/ml penicillin, and 100 μg/ml streptomycin. For Slc12a8 mRNA expression analysis, 2.5 × 10⁵ cells per well were incubated in 6-well plates with DMEM with 1% FBS containing 0.1% DMSO or 100 nM FK866 or 100 nM FK866 plus 100 μM NMN for 24h. Small intestines from 3 month-old C57BL/6J (B6) male mice (Jackson Laboratories) were cut into three segments with duodenum/jejunum/ileum length ratios of 1:3:2 36. One centimeter of each segment was opened longitudinally, washed once with cold PBS, and incubated for 4h at 37°C with 0.1% DMSO or 100 nM FK866 or 100 nM FK866 plus 500 μM NMN in the 1:1 mixture of DMEM and Ham’s F-12 medium (Sigma) with 5% FBS and the following additives: 5 μg/ml insulin (Sigma), 20 ng/ml epidermal growth factor (Sigma), 1x B27 supplement (GIBCO), 1 mM Sodium pyruvate (Corning), 100 units/ml penicillin, 100 μg/ml streptomycin, and 2 mM glutamax (GIBCO). Cellular and tissue total RNA samples, which were extracted using the PureLink RNA Mini kit (Cat# 12183025, Ambion), were analyzed by quantitative RT-PCR, and relative expression levels were calculated for each gene by normalizing to Gapdh expression levels 16.
NAD+ and NMN measurements by HPLC.
NAD+ and NMN were extracted from cells and tissues with perchloric acid, neutralized with K2CO3 on ice, and quantitated by our high-performance liquid chromatography (HPLC) system (Shimadzu) with a Supelco LC-18-T column (15cm × 4.6cm; Sigma) and a Hypercarb column (15cm × 4.6cm; Thermo Scientific), respectively 5,37.
Flow cytometry analysis.
2 × 10⁶ NIH3T3 cells were incubated in a 10-cm culture dish with DMEM with 1% FBS containing 0.1% DMSO or 100 nM FK866 or 100 nM FK866 plus 100 μM NMN for 48h at 37°C and 5% CO2. Cells were then washed once with cold PBS, treated with 0.02% EDTA in PBS, and stained for flow cytometry using a commercially available polyclonal rabbit anti-mouse Slc12a8 antibody (ARP44039, Aviva, CA) at 1:200, a secondary goat anti-rabbit IgG (H+L) conjugated with Alexa Fluor 488 at 1:2000 (Invitrogen), and the survival marker Zombie Dye at 1:400 (Biolegend) for 25 min at 4˚C. Cells were then washed and analyzed by the Gallios Flow Cytometer (BeckmanCoulter). For the intracellular staining, cells were first fixed in 2% PFA for 10 min at room temperature and then permeabilized in saponin-containing buffer for another 10 min at RT. Slc12a8 staining was performed in permeabilization buffer for 25 min at 4°C. Samples were analyzed by the Gallios Flow Cytometer, and data were analyzed using Kaluza 1.3 (BeckmanCoulter). Dead cells were excluded using a Zombie Aqua Fixable Viability Kit (Biolegend).
Hepatocytes isolation, 5’-nucleotidase activity assay, NMN uptake measurement, and silencing of Slc12a8 and Nrk1 expression.
Primary hepatocytes were isolated from 3 month-old B6 male mice (Jackson Laboratories) by a two-step hepatic portal perfusion with calcium and magnesium-free Hanks’ salt solution followed by DMEM containing 0.25 mg/mL collagenase (Type IV, Cat # C5138, Sigma) 38. Cells were cultured overnight in 6-well plates coated with poly-L-lysine at 37°C and 5% CO2 in DMEM supplemented with 10% FBS, 100 units/ml penicillin, and 100 μg/ml streptomycin (pen/strep) before conducting any experiments. Slc12a8 mRNA expression and NAD+ content were evaluated by incubating hepatocytes with 500 nM FK866 or 500 nM FK866 plus 500 μM NMN in DMEM with 1% FBS for 24h. To make sure whether adenosine-5′-[α, β-methylene]diphosphate (AOPCP) inhibits 5’-nucleotidase activity, 1.5 × 10⁵ cells per well were grown in 12-well plates with 500 nM FK866 in DMEM with 1% FBS for 24h and then incubated in 1.4 ml of Hanks’ buffered saline solution with Ca2+ and Mg2+ at pH 7.5 (HBSS, GIBCO) in the presence of 100 μM adenosine monophosphate (AMP) or 100 μM AMP plus 500 μM AOPCP. At different time points (0, 1, 5, 15, and 30 min), 200 μl of each culture supernatant were collected and extracted by adding 28 μl of 70% perchloric acid. The amounts of adenosine produced were determined by HPLC. Elution times for AMP and adenosine were 4.7 and 17.4 min, respectively. To examine cell viability, Celltiter 96 AQueous One Solution Cell Proliferation Solution (Promega, MA) was used, and the absorbance was measured at λ=490 after 4h incubation. For NMN uptake measurement, 1.5 × 10⁵ cells per well were grown in 12-well plates with 500 nM FK866 in DMEM with 1% FBS for 24h and then incubated in 1 ml of HBSS in the presence of 500 μM AOPCP, 20 μM dipyridamole, and 500 nM FK866 or these inhibitors plus 100 μM NMN. At different time points (0, 0.25, 1, 5, 15, and 30 min), cells were washed once with cold HBSS and lysed in cold 10% perchloric acid. Intracellular NMN levels were measured by HPLC as described previously 5. For gene silencing experiments, 10 μg of ON-TARGET plus mouse siRNA (Thermo scientific) specific to Slc12a8 (J-042450–12-0020) or Nrk1 (J 051839–11-0010) or a negative control siRNA (NON-targeting siRNA #1, D-001810–01-20) were electroporated into one million cells per condition, mixed with 100 μl AMAXA Mouse Hepatocyte Nucleofector Solution (Lonza), using the Nucleofector program H-26 following the manufacturer’s instructions. The electroporated cells were incubated in the cuvette for 15 min before addition of media. 2.5×10⁵ cells per well were seeded in 6-well plates coated with poly-L-lysine at 37°C and 5% CO2 in DMEM containing 10% FBS and penicillin-streptomycin for 48h after electroporation. Those cells were incubated with 500 nM FK866 in DMEM with 1% FBS for 24h. NMN uptake was measured by HPLC after incubating cells in HBSS with 500 μM AOPCP, 20 μM dipyridamole, and 500 nM FK866 or these inhibitors plus 100 μM NMN for 1 min at room temperature. Silencing efficiencies were evaluated by quantitative RT-PCR.
Generation of NIH3T3 cells stably overexpressing the full-length mouse Slc12a8 cDNA.
The coding region of full-length mouse Slc12a8 cDNA (GenBank Reference Sequence: NM_134251) was amplified from mouse liver by PCR using PfuUltra II Fusion HS DNA polymerase (Agilent, CA) with the following forward and reverse primers containing XhoI sites:Slc12a8 forward: 5’-ATACTCGAGGAGAATGGCCCAGAGGTCTC-3’, Slc12a8 reverse: 5’- TCAACTACGGAGGGATGATCGAGCTCATT −3’
The resulting 2118-bp fragment of full-length Slc12a8 cDNA was digested with XhoI and cloned into pBluescript SK- vector. Slc12a8 cDNA fragment was then subcloned into the mammalian expression vector pCXN2 39. N- or C-terminally FLAG-tagged versions of full-length Slc12a8 cDNA were produced using the following forward and reverse primer sets containing XhoI sites and FLAG-tag sequences:, N-terminally FLAG-tagged Slc12a8, Forward: 5’-ATACTCGAGCCACCATGGACTACAAAGACGATGACGACAAGGGCGCCCAGAGGTCTCCG-3’Reverse: 5’- TCAACTACGGAGGGATGATCGAGCTCATT −3’C-terminally FLAG-tagged Slc12a8Forward: 5’- ATACTCGAGCCACCATGGCCCAGAGGTCTCCG −3’Reverse: 5’-TCAACTACGGAGGGATGCCGCTGATGTTTCTGCTACTGCTGTTCATCGAGCTCATT −3’
The resultant FLAG-tagged Slc12a8 cDNA fragments were cloned into the mammalian expression vector pIRES-EGFP-puro (Addgene, Cat#45567). The Slc12a8 cDNA sequence in the final vector was confirmed by sequencing. NIH3T3 cells were transfected with 5 μg of pCXN2 carrying the full-length Slc12a8 cDNA (Slc12a8-OE) or only pCXN2 vector (control) or 5 μg of pIRES-EGFP-puro carrying the full-length Slc12a8 cDNA with N- or C-terminal FLAG-tag (Slc12a8-OE) or only pIRES-EGFP-puro vector (control) using the SuperFect transfection reagent (QIAGEN) and cultured in DMEM supplemented with 10% FBS, antibiotics, and 300 μg/ml G418 (Invitrogen) or 1 μg/ml puromycin (Sigma, MO) for 2 weeks. Resistant cells were pooled, and aliquots were frozen for further experiments. To confirm Slc12a8 protein expression levels, plasma membrane (PM) fractions were prepared from control and Slc12a8-OE cells or N- or C-terminally FLAG-tagged Slc12a8-OE cells, as described previously 40. Briefly, 7.5×10⁷ cells cultured in five 10-cm dishes were used. After 2 washes with ice-cold HES buffer (20 mM HEPES, 1 mM EDTA, and 255 mM sucrose, pH 7.4), cells were collected by scraping in HES buffer (3 ml/dish) containing a protease inhibitor cocktail (Roche) and homogenized by passing 5 times through a 22-gauge needle. All subsequent steps were performed at 4°C. The homogenate was centrifuged (Avanti J-E; Beckman-Coulter) at 10,000 g in a JA 25.5 rotor for 15 min. The resulting supernatant was layered on the top of a 10-ml sucrose cushion (38.5% sucrose, 20 mM HEPES, and 1 mM EDTA, pH 7) and centrifuged at 53,000 g for 120 min. The interface containing the PM fraction was carefully removed, resuspended in 10 ml HES buffer, and centrifuged at 50,000 g for 30 min, yielding the PM fraction in the pellet. PM fractions from control or Slc12a8-OE cells were lysed with RIPA buffer (150 mM sodium chloride, 1.0% NP-40, 0.25% sodium deoxycholate, 0.1% SDS, 50 mM Tris, pH 7.5, 2 mM EDTA, 1 mM PMSF, 0.5mM DTT and protease inhibitor cocktail) and boiled for 5 minutes in 1x Laemmli buffer. Western blotting was conducted with rabbit polyclonal anti-mouse Slc12a8 (1:500, ARP44039, Aviva, CA) or monoclonal anti-FLAG MS (1:500, #F3165, Sigma, MO), and anti-Caveolin-1 (1:2000, #3238, Cell Signaling, MA) antibodies. Band intensity was quantitated on the Amersham Hyperfilm™ ECL (GE Healthcare limited) by Photoshop. To measure intracellular NAD+ levels, 2×10⁵ control and Slc12a8-OE NIH3T3 cells were preincubating with 2 μM dipyridamole, 500 μM AOPCP, 100 nM FK866, and in some experiments, 10 μM WNK463, a pan-WNK kinase inhibitor (MCE, # HY-100626), for 1h and then with the same inhibitors combined with 100 μM NMN for an additional 1h in DMEM 1%FBS at 37°C. At the end of incubation, cells were washed once with cold PBS and lysed in 10% perchloric acid. NAD+ levels were determined by HPLC, as described above.
NMN uptake analyses with radiolabeled NMN.
Control and Slc12a8-OE NIH3T3 cells were harvested by centrifugation (400g, 5 min), washed once in HBSS, and incubated at 37°C in HBSS [pH 7.5] (5×10⁶ cells/ml) containing 100 nM 3H-β-nicotinamide mononucleotide (9 Ci/mmol; Moravek Biochemicals, CA) and unlabeled NMN to make the final concentration 25 μM. At the designated time points (1, 3, 5 and 10 minutes), aliquots of the cells (100 μl) were collected and placed in 1.5-ml microcentrifuge tubes containing silicone-mineral oil (density, 1.015; Sigma-Aldrich) on the top of 2 M potassium hydroxide solution, followed by centrifugation at 16,000g for 30s. Cells were separated from the buffer and pelleted through the silicone-mineral oil layer. The radioactivity in these cell pellets was determined by a liquid scintillation counter. For calculating Km and Vmax, we used the same condition described above, but with various total concentrations of NMN, ranging from 1 μM to 100 μM. At the 4-min time point, 100 μl of cell suspension was collected and pelleted in the same way described above. The radioactivity in cell pellets was determined by a liquid scintillation counter. The radioactivity measured in control NIH3T3 cells was subtracted to calculate Slc12a8-specific NMN uptake in Slc12a8-OE NIH3T3 cells.
Proteoliposome experiments.
Proteoliposome preparation was carried out as previously described 41. Briefly, 2×10⁷ control or Slc12a8-OE NIH3T3 cells were resuspended in 1 ml of lysis buffer (10 mM Tris-HCl, pH 8.3, 150 mM NaCl, 0.3 M sucrose, protease inhibitor cocktail) and disrupted using a homogenizer. The lysate was centrifuged for 10 min at 3,000g, and the supernatant was collected and centrifuged for 15 min at 100,000g. The membrane proteins were solubilized with buffer A (10 mM Tris-HCl [pH 8.3] containing 150 mM NaCl and 0.5% n-octyl-β-glucopyranoside). Separately, total lipids were extracted from hemoglobin-free erythrocyte membranes (ghosts) as described previously 42. Total lipids from human erythrocyte membranes (3 mg) were dried and resuspended with 600 μl of solubilized membrane proteins (at approximately 0.7 mg/ml protein concentration). The resulting emulsions were sonicated in ice for 1 min and dialyzed against 5 liters of buffer A without n-octyl-β-glucopyranoside (dialysis buffer) for 24h at 4°C. Proteoliposomes were recovered, centrifuged for 15 min at 100,000g, resuspended in 900 μl dialysis buffer and passed 5 times through a 30-gauge needle. To examine the Na+-, K+- or Cl--dependency of Slc12a8, NaCl was replaced with 150 mM LiCl, KCl, or CH3COONa, respectively. All steps were carried out at 4°C. Proteoliposomes (30 μl in triplicate for each condition) were incubated for 2, 5, and 10 min at 25°C in the presence of 150 nM (105 cpm/ml) 3H-β-NMN (specific activity, 9.1 Ci/mmole) with or without 150 μM label-free compounds (NMN, NR, NAD, AMP, nicotinic acid mononucleotide [NaMN], and nicotinamide). At the end of incubations, samples were filtered on a glass fiber paper. Filters were washed with 3 ml of dialysis buffer, dried, and counted for radioactivity. In each experiment, we always measured the non-specific binding/uptake of 3H-NMN by adding 150 nM 3H-NMN and 300 μM of cold NMN (2000-fold higher concentration) to the proteoliposomes derived from Slc12a8-OE NIH3T3 cells and measuring the radioactivity of 3H-NMN after extensive washes. Because specific NMN transport should be displaced completely by the 2000-fold higher concentration of cold NMN, 3H-NMN detected in this condition must be due to a non-specific/non-kinetic transport and/or a non-specific binding to proteoliposomes. Such values due to non-specific transport/biding of 3H-NMN were always measured in each experiment and subtracted from all measured values of 3H-NMN transported into proteoliposomes in each condition. To examine whether Slc12a8 could transport NaMN, proteoliposomes (300 μl in triplicate for each condition) were incubated for 5 min with 5 mM NMN or NaMN (Sigma, #N7764). Right after incubation, samples were filtered on a glass fiber paper (0.25 cm2 area), and nucleotides were extracted with 200 μl of 0.6 M perchloric acid. Extracts were neutralized with 2 M K2CO3, and nucleotides were quantitated by HPLC.
In vivo Slc12a8 knockdown and overexpression.
To generate shRNA-expressing lentiviral constructs, 56-bp double-stranded oligonucleotides, each of which contains a sense target sequence, a microRNA-based loop sequence (CTTCCTGTCA), an antisense sequence, a termination sequence of four thymidines, and appropriate restriction enzyme sites at both ends, were generated for mouse Slc12a8 and firefly luciferase (fLuc) and cloned into the U6-PGK-GFP vector provided by the Viral Vectors Core at Washington University School of Medicine. The sense Slc12a8 sequence is ‘5–5GCCTAGAGTGAACAGAGAAGA-3’. To generate the Slc12a8-expressing lentiviral construct, a 2118-bp fragment of full-length Slc12a8 cDNA was subcloned into the FCIV.FM1 vector provided by the Viral Vectors Core. Lentiviruses were produced by co-transfecting HEK293T cells with the shRNA- or Slc12a8-expressing vectors and three packaging vectors (pMD-Lg, pCMV-G, and RSV-REV) using SuperFect transfection reagent (QIAGEN). Culture supernatant was collected 48 hr after transfection 43. Knockdown or overexpression efficiencies were tested using primary intestinal cultures 44. Large-scale lentivirus production was carried out by the Viral Vectors Core at the Hope Center for Neurological Disorders at Washington University. C57BL/6J mice (Jackson Laboratories) orally received fLuc or Slc12a8 shRNA lentivirus with a titer of 5 × 10⁶ transduction units or vector-only or Slc12a8-expressing lentivirus with a titer of 3 × 10⁶ transduction units after an overnight fast for two consecutive days.
Generation of antibodies against mouse Slc12a8 and tissue Western blot analysis.
Two different polyclonal rabbit antisera were produced against a synthetized N-terminal peptide (AQRSPQELFHEAAQQGC) of mouse Slc12a8 (Covance, PA). Mouse tissues were homogenized with RIPA buffer and boiled in 1x Laemmli buffer for 5 min. Western blotting was conducted with a rabbit polyclonal antiserum against the N-terminal portion of mouse Slc12a8 (1:500, Covance, PA) and an anti-Gapdh antibody (1:1000, MAB374, Millipore, MO). Band intensity was quantitated on the Amersham Hyperfilmtm ECL (GE Healthcare limited) by Photoshop.
Generation of the whole-body Slc12a8 knockout mice.
Whole-body Slc12a8 knockout (Slc12a8KO) mice were generated with the CRISPR-CAS9 technology by the Transgenic Vectors Core of Washington University. CRISPR gRNAs were designed to flank exon 4 of the Slc12a8 gene. gRNA sequences were as follows: 5’ gRNA; 5’- agtgcatgtatagacgtatg - 3’ and 3’ gRNA; 5’ - cctcacaaatatttacaggc - 3’. gRNAs were obtained as gBlocks (IDT). Cleavage activity was assessed by transfecting N2A cells with gBlock and Cas9 plasmid (addgene # 42230) using XtremegeneHP (Roche). Cleavage activity was determined by T7E1 assay using standard methods. gRNA was in vitro transcribed using the T7 Megashort Script Kit (Ambion). Cas9 RNA was in vitro transcribed using the mMessage mMachine T7 Ultra Kit (Ambion). All RNA was purified using Megaclear Columns (Ambion). RNA was microinjected into C57BL/6J × CBA hybrid zygotes at a concentration of 50 ng/μl Cas9, 25 ng/μl gRNA, and 100 ng/μl ssODN in the Washington University Mouse Genetic Core Facility. Whole-body knockout alleles were detected by PCR across the cleavage site and confirmed by sequencing. One heterozygous founder was established, and the mice were backcrossed to wild-type C57BL/6J mice (Jackson Laboratories) for 5 generations before analysis. Slc12a8-deficient heterozygous mice were crossed to generate homozygous Slc12a8KO mice. Wild-type littermates were used as controls.
Production of O18-D-NR and O18-D-NMN.
18O nicotinamide was prepared from the hydrolysis of cyanopyridine in 18O water 45. 1,2-2H,3,5-tetraacetate was synthesized from D-[2-2H]-ribose (purchased from Omicron Biochemicals) 46. 18O-2H labelled nicotinamide riboside (O18-D-NR) was synthesized from 18O-nicotinamide and D-ribofuranose 1,2-2H,3,5-tetraacetate 47. 18O-2H nicotinamide mononucleotide (O18-D-NMN) was synthesized from 18O-2H nicotinamide riboside, as described previously 15.
Isotopic tracing experiment.
3×10⁵ primary hepatocytes isolated from 5 month-old male Slc12a8KO mice and their wild-type littermates were incubated in 6-well plates with 100 μM O18-D-NMN or O18-D-NR in DMEM with 1% FBS for 5 min at 37°C. 3×10⁵ control and Slc12a8-OE NIH3T3 cells were incubated in 6-well plates with 25 μM O18-D-NMN or O18-D-NR in DMEM with 1% FBS for 5 min at 37°C. After incubation, cells were washed twice with cold PBS and lysed in a cold 1:1 mixture of reagent-grade methanol and water. Seven-to-eight month-old Slc12a8KO mice and their wild-type littermates were orally administered with O18-D-NMN at a dose of 500mg/kg or PBS after an overnight fast. The jejunum and ileum were collected at 10 min after oral gavage. A 1:1 mixture of reagent-grade methanol and water (4°C) were added to the frozen tissue (60 μL/mg tissue). After sonication, extracts were centrifuged at 12,000g for 15 min at 4°C. Chloroform was added to the extracts at a ratio of 1:1 (v/v), thoroughly shaken for 30s, and centrifuged at 12,000g for 10 min at 4°C. The upper phase (methanol and water) was separated from the lower (organic) phase and lyophilized by speed vacuum at room temperature, reconstituted with 5 mM ammonium formate and centrifuged at 12,000g for 10 min. Serial dilutions of NMN, O18-D-NMN, and O18-D-NR at concentrations ranging 128–1000 nmol/L in 5 mM ammonium formate were used for calibration. Liquid chromatography was performed by HPLC (1290; Agilent) with Atlantis T3 (LC 2.1 × 150mm, 3 mm; Waters) at a flow rate of 0.15 ml/min with 5 mM ammonium formate for mobile phase A and 100% methanol for mobile phase B. Metabolites were eluted with gradients of 0–10 min, 0–70% B; 10–15 min, 70% B; 16–20 min, 0% B. The metabolites were analyzed with a Triple Quadrupole mass spectrometer (6470; Agilent) under positive ESI multiple reaction monitoring (MRM) using parameters for NMN (335>123), O18-D-NMN (338>125), and O18-D-NR (258>125). Fragmentation, collision, and post acceleration voltages were 135V, 8V, 7V for NMN and 130V, 20V, 1V for NR. Peaks of NMN, O18-D-NMN, and O18-D-NR were identified using the MassHunter quantitative analysis tool (Agilent). The areas under the peaks of O18-D-NMN and O18-D-NR were calculated by subtracting the background values of PBS controls.
Animal experimentation.
All mice were group-housed in a barrier facility with 12hr light/12hr dark cycles. Mice were maintained ad libitum on a standard chow diet (LabDiet 5053; LabDiet, St. Louis, MO). For plasma NMN kinetics and tissue NAD+ detection, 3–4 month-old male C57BL/6J mice (Jackson Laboratories) that received an oral gavage of fLuc or Slc12a8 shRNA lentivirus, and 3 and 26 month-old female C57BL/6J mice (Charles River) were fasted overnight. Blood was collected from their tail veins at 0, 5 and 60 min after an oral gavage of NMN (500 mg/kg) or PBS. Immediately after blood collection, plasma was separated and quickly extracted with perchloric acid. At this step, it is critical to avoid freezing plasma samples. To show the importance of this procedural precaution, we gave an oral gavage of doubly labeled isotopic NMN (O18-D-NMN) to seventh-month old male C57BL/6J mice (Jackson Laboratories) and measured O18-D-NMN (M+3), O18-NMN (M+2), and NMN (M+0) at 5 min by extracting plasma samples freshly (without freezing/thawing). In this experimental condition, we were able to detect O18-D-NMN (M+3) reliably in plasma samples at 5 min after oral gavage (Supplementary Fig. 4f), different from the recently reported results 23. Indeed, extraction of NR from human plasma samples also require a similar caution 22. Tissue samples were also collected at 60 min time points after an oral gavage of NMN (500 mg/kg) or PBS. NAD+ levels and Slc12a8 mRNA expression were determined in tissues from 2- or 24-month-old female C57BL/6J mice (Jackson Laboratories) or those in which Slc12a8 was knocked down specifically in the small intestine, as described above. Luminal NMN content was compared by mass spectrometry in the jejunum and ileum between 3 and 26 month-old female C57BL/6J mice (Charles River) fasted overnight. All animal studies were approved by the Washington University Institutional Animal Care and Use Committee and were in accordance with NIH guidelines.
Immunostaining of Slc12a8 in the small intestine.
Jejuna and Ilea were prepared by the Swiss-roll method and fixed overnight in 10% buffered formalin (Sigma-Aldrich). Fixed tissues were dehydrated, embedded in paraffin, and sectioned at 5-μm thickness by the Elvie L. Taylor Histology Core Facility of Washington university. Antigen retrieval was performed in sodium citrate buffer (10 mM Tris-sodium citrate dihydrate [pH 6.0], 0.05% Tween 20) followed by blocking of endogenous peroxidase activity in 3% hydrogen peroxide in TBS-T (0.1M Tris-HCl [pH 7.5], 0.15M NaCl, 0.05% Tween 20). After blocking with 10% normal goat serum in TBS-T, samples were incubated overnight at 4ºC with a rabbit anti-mouse-Slc12a8 antibody (1:100, ARP44039, Aviva, CA) and subsequently with HRP-conjugated goat anti-rabbit IgG (1:1,000) antibody using the FITC TSA kit (Parkin Elmer) according to the manufacturer’s protocol. Nuclei were stained with DAPI (Sigma #D9542). Digital images were collected with a fluorescence microscope (ApoTome 2, Zeiss).
Statistical Analyses.
Differences between two groups were assessed using the unpaired, two-tailed Student’s t test. Comparisons among several groups were performed using one-way ANOVA with various post hoc tests indicated in figure legends. Z ratios and two-sided p values for Slc12a8 in Figure 1a were calculated as previously described 48. For comparisons, p values <0.05 were considered statistically significant. All experiments were performed independently at least twice. GraphPad Prism (Version 7) was used to conduct statistical analyses.
Supplementary Material
Acknowledgements
We thank Claudia Cantoni for flow cytometric analysis, Lucrezia Guida for her support in proteoliposome preparation, and Renate Lewis for the production of Slc12a8KO mice. We also thank Mr. Edward Schulak for his generous support to A.G., members of the Imai lab for critical comments and suggestions on this study, and staff members in the core facilities provided by Diabetes Research Center (P30 DK020579), Nutrition Obesity Research Center (P30 DK56341), and the Hope Center for Neurological Disorders at Washington University. This work was also performed in a facility supported by NCRR grant C06 RR015502. A.G. was supported as the Tanaka Scholar by Mr. Tsunemaru Tanaka and Ms. Megumi Tanaka. M.E.M was supported by U.K. Research Councils and Biotechnology and Biological Science Research Council (BBSRC; BB/N001842/1). This work was mainly supported by grants from the National Institute on Aging (AG024150, AG037457, AG047902) to S.I.
Footnotes
Author information
Reprints and permissions information is available at www.nature.com/reprints. Correspondence and requests for materials should be address to S.I. (imaishin@wustl.edu).
Data availability.The microarray data used in this study has been deposited into the NCBI GEO database (GEO accession numbers GSE49784 and GSE118365). All data generated or analyzed during this study are included in the article and its Supplementary Information.
Competing interests
A.G. and S.I. are inventors of a patent (PCT/US18/46233) about the Slc12a8 NMN transporter, whose applicant is Washington University and which has been licensed by Teijin Limited (Japan). Other authors declare no competing financial interests.
References
- 1.Canto C, Menzies KJ & Auwerx J NAD(+) Metabolism and the Control of Energy Homeostasis: A Balancing Act between Mitochondria and the Nucleus. Cell Metab. 22, 31–53, doi: 10.1016/j.cmet.2015.05.023 (2015). [DOI] [PMC free article] [PubMed] [Google Scholar]
- 2.Rajman L, Chwalek K & Sinclair DA Therapeutic Potential of NAD-Boosting Molecules: The In Vivo Evidence. Cell Metab 27, 529–547, doi: 10.1016/j.cmet.2018.02.011 (2018). [DOI] [PMC free article] [PubMed] [Google Scholar]
- 3.Verdin E NAD(+) in aging, metabolism, and neurodegeneration. Science 350, 1208–1213, doi: 10.1126/science.aac4854 (2015). [DOI] [PubMed] [Google Scholar]
- 4.Yoshino J, Baur JA & Imai SI NAD(+) Intermediates: The Biology and Therapeutic Potential of NMN and NR. Cell Metab 27, 513–528, doi: 10.1016/j.cmet.2017.11.002 (2018). [DOI] [PMC free article] [PubMed] [Google Scholar]
- 5.Yoshino J, Mills KF, Yoon MJ & Imai S Nicotinamide mononucleotide, a key NAD(+) intermediate, treats the pathophysiology of diet- and age-induced diabetes in mice. Cell Metab. 14, 528–536, doi:S1550-4131(11)00346-9[pii]10.1016/j.cmet.2011.08.014 (2011). [DOI] [PMC free article] [PubMed] [Google Scholar]
- 6.Mouchiroud L et al. The NAD(+)/Sirtuin Pathway Modulates Longevity through Activation of Mitochondrial UPR and FOXO Signaling. Cell 154, 430–441, doi:S0092-8674(13)00755-1[pii]10.1016/j.cell.2013.06.016 (2013). [DOI] [PMC free article] [PubMed] [Google Scholar]
- 7.Camacho-Pereira J et al. CD38 Dictates Age-Related NAD Decline and Mitochondrial Dysfunction through an SIRT3-Dependent Mechanism. Cell Metab. 23, 1127–1139, doi: 10.1016/j.cmet.2016.05.006 (2016). [DOI] [PMC free article] [PubMed] [Google Scholar]
- 8.Garten A et al. Physiological and pathophysiological roles of NAMPT and NAD metabolism. Nat. Rev. Endocrinol. 11, 535–546, doi: 10.1038/nrendo.2015.117 (2015). [DOI] [PubMed] [Google Scholar]
- 9.Imai S Nicotinamide phosphoribosyltransferase (Nampt): a link between NAD biology, metabolism, and diseases. Curr. Pharm. Des. 15, 20–28 (2009). [DOI] [PMC free article] [PubMed] [Google Scholar]
- 10.Belenky P et al. Nicotinamide riboside promotes Sir2 silencing and extends lifespan via Nrk and Urh1/Pnp1/Meu1 pathways to NAD+. Cell 129, 473–484 (2007). [DOI] [PubMed] [Google Scholar]
- 11.Caton PW, Kieswich J, Yaqoob MM, Holness MJ & Sugden MC Nicotinamide mononucleotide protects against pro-inflammatory cytokine-mediated impairment of mouse islet function. Diabetologia 54, 3083–3092, doi: 10.1007/s00125-011-2288-0 (2011). [DOI] [PubMed] [Google Scholar]
- 12.de Picciotto NE et al. Nicotinamide mononucleotide supplementation reverses vascular dysfunction and oxidative stress with aging in mice. Aging Cell 15, 522–530, doi: 10.1111/acel.12461 (2016). [DOI] [PMC free article] [PubMed] [Google Scholar]
- 13.Gomes AP et al. Declining NAD(+) Induces a Pseudohypoxic State Disrupting Nuclear-Mitochondrial Communication during Aging. Cell 155, 1624–1638, doi:S0092-8674(13)01521-3[pii]10.1016/j.cell.2013.11.037 (2013). [DOI] [PMC free article] [PubMed] [Google Scholar]
- 14.Long AN et al. Effect of nicotinamide mononucleotide on brain mitochondrial respiratory deficits in an Alzheimer’s disease-relevant murine model. BMC Neurol 15, 19, doi: 10.1186/s12883-015-0272-x (2015). [DOI] [PMC free article] [PubMed] [Google Scholar]
- 15.Mills KF et al. Long-Term Administration of Nicotinamide Mononucleotide Mitigates Age-Associated Physiological Decline in Mice. Cell Metab. 24, 795–806, doi: 10.1016/j.cmet.2016.09.013 (2016). [DOI] [PMC free article] [PubMed] [Google Scholar]
- 16.Stein LR & Imai S Specific ablation of Nampt in adult neural stem cells recapitulates their functional defects during aging. EMBO J. 33, 1321–1340, doi: 10.1002/embj.201386917 (2014). [DOI] [PMC free article] [PubMed] [Google Scholar]
- 17.Wang X, Hu X, Yang Y, Takata T & Sakurai T Nicotinamide mononucleotide protects against beta-amyloid oligomer-induced cognitive impairment and neuronal death. Brain Res 1643, 1–9, doi: 10.1016/j.brainres.2016.04.060 (2016). [DOI] [PubMed] [Google Scholar]
- 18.Yamamoto T et al. Nicotinamide mononucleotide, an intermediate of NAD+ synthesis, protects the heart from ischemia and reperfusion. PLoS One 9, e98972, doi: 10.1371/journal.pone.0098972 (2014). [DOI] [PMC free article] [PubMed] [Google Scholar]
- 19.Ramsey KM, Mills KF, Satoh A & Imai S Age-associated loss of Sirt1-mediated enhancement of glucose-stimulated insulin secretion in β cell-specific Sirt1-overexpressing (BESTO) mice. Aging Cell 7, 78–88 (2008). [DOI] [PMC free article] [PubMed] [Google Scholar]
- 20.Revollo JR et al. Nampt/PBEF/visfatin regulates insulin secretion in β cells as a systemic NAD biosynthetic enzyme. Cell Metab. 6, 363–375 (2007). [DOI] [PMC free article] [PubMed] [Google Scholar]
- 21.Ratajczak J et al. NRK1 controls nicotinamide mononucleotide and nicotinamide riboside metabolism in mammalian cells. Nat. Commun. 7, 13103, doi: 10.1038/ncomms13103 (2016). [DOI] [PMC free article] [PubMed] [Google Scholar]
- 22.Airhart SE et al. An open-label, non-randomized study of the pharmacokinetics of the nutritional supplement nicotinamide riboside (NR) and its effects on blood NAD+ levels in healthy volunteers. PLoS One 12, e0186459, doi: 10.1371/journal.pone.0186459 (2017). [DOI] [PMC free article] [PubMed] [Google Scholar]
- 23.Liu L et al. Quantitative Analysis of NAD Synthesis-Breakdown Fluxes. Cell Metab. 27, 1067–1080 e1065, doi: 10.1016/j.cmet.2018.03.018 (2018). [DOI] [PMC free article] [PubMed] [Google Scholar]
- 24.Hebert SC, Mount DB & Gamba G Molecular physiology of cation-coupled Cl- cotransport: the SLC12 family. Pflugers Arch. 447, 580–593, doi: 10.1007/s00424-003-1066-3 (2004). [DOI] [PubMed] [Google Scholar]
- 25.Ramsey KM et al. Circadian clock feedback cycle through NAMPT-mediated NAD+ biosynthesis. Science 324, 651–654, doi:1171641[pii]10.1126/science.1171641 (2009). [DOI] [PMC free article] [PubMed] [Google Scholar]
- 26.Yamada K, Hara N, Shibata T, Osago H & Tsuchiya M The simultaneous measurement of nicotinamide adenine dinucleotide and related compounds by liquid chromatography/electrospray ionization tandem mass spectrometry. Anal. Biochem. 352, 282–285 (2006). [DOI] [PubMed] [Google Scholar]
- 27.Shi W et al. Effects of a wide range of dietary nicotinamide riboside (NR) concentrations on metabolic flexibility and white adipose tissue (WAT) of mice fed a mildly obesogenic diet. Mol Nutr Food Res 61, doi: 10.1002/mnfr.201600878 (2017). [DOI] [PMC free article] [PubMed] [Google Scholar]
- 28.Sociali G et al. Antitumor effect of combined NAMPT and CD73 inhibition in an ovarian cancer model. Oncotarget 7, 2968–2984, doi: 10.18632/oncotarget.6502 (2016). [DOI] [PMC free article] [PubMed] [Google Scholar]
- 29.Alessi DR et al. The WNK-SPAK/OSR1 pathway: master regulator of cation-chloride cotransporters. Sci Signal 7, re3, doi: 10.1126/scisignal.2005365 (2014). [DOI] [PubMed] [Google Scholar]
- 30.Belenky P, Bogan KL & Brenner C NAD+ metabolism in health and disease. Trends Biochem. Sci. 32, 12–19 (2007). [DOI] [PubMed] [Google Scholar]
- 31.Bieganowski P & Brenner C Discoveries of nicotinamide riboside as a nutrient and conserved NRK genes establish a Preiss-Handler independent route to NAD+ in fungi and humans. Cell 117, 495–502 (2004). [DOI] [PubMed] [Google Scholar]
- 32.Ummarino S et al. Simultaneous quantitation of nicotinamide riboside, nicotinamide mononucleotide and nicotinamide adenine dinucleotide in milk by a novel enzyme-coupled assay. Food Chem. 221, 161–168, doi: 10.1016/j.foodchem.2016.10.032 (2017). [DOI] [PubMed] [Google Scholar]
- 33.Hewett D et al. Identification of a psoriasis susceptibility candidate gene by linkage disequilibrium mapping with a localized single nucleotide polymorphism map. Genomics 79, 305–314, doi: 10.1006/geno.2002.6720 (2002). [DOI] [PubMed] [Google Scholar]
- 34.Feigin ME et al. Recurrent noncoding regulatory mutations in pancreatic ductal adenocarcinoma. Nat Genet. 49, 825–833, doi: 10.1038/ng.3861 (2017). [DOI] [PMC free article] [PubMed] [Google Scholar]
- 35.Kim JE et al. Associations between genetic polymorphisms of membrane transporter genes and prognosis after chemotherapy: meta-analysis and finding from Seoul Breast Cancer Study (SEBCS). Pharmacogenomics J, doi: 10.1038/s41397-018-0016-6 (2018). [DOI] [PubMed] [Google Scholar]
- 36.Wang HH, Patel SB, Carey MC & Wang DQ Quantifying anomalous intestinal sterol uptake, lymphatic transport, and biliary secretion in Abcg8(−/−) mice. Hepatology 45, 998–1006, doi: 10.1002/hep.21579 (2007). [DOI] [PMC free article] [PubMed] [Google Scholar]
- 37.Yoshino J & Imai S Accurate Measurement of Nicotinamide Adenine Dinucleotide (NAD(+)) with High-Performance Liquid Chromatography. Methods Mol. Biol. 1077, 203–215, doi: 10.1007/978-1-62703-637-5_14 (2013). [DOI] [PMC free article] [PubMed] [Google Scholar]
- 38.Grimm AA, Brace CS, Wang T, Stormo GD & Imai S A nutrient-sensitive interaction between Sirt1 and HNF-1alpha regulates Crp expression. Aging Cell 10, 305–317, doi: 10.1111/j.1474-9726.2010.00667.x (2011). [DOI] [PMC free article] [PubMed] [Google Scholar]
- 39.Revollo JR, Grimm AA & Imai S The NAD biosynthesis pathway mediated by nicotinamide phosphoribosyltransferase regulates Sir2 activity in mammalian cells. J. Biol. Chem. 279, 50754–50763 (2004). [DOI] [PubMed] [Google Scholar]
- 40.Bruzzone S et al. The plant hormone abscisic acid increases in human plasma after hyperglycemia and stimulates glucose consumption by adipocytes and myoblasts. FASEB J. 26, 1251–1260, doi: 10.1096/fj.11-190140 (2012). [DOI] [PubMed] [Google Scholar]
- 41.Bruzzone S, Guida L, Zocchi E, Franco L & De Flora A Connexin 43 hemi channels mediate Ca2+-regulated transmembrane NAD+ fluxes in intact cells. FASEB J. 15, 10–12, doi: 10.1096/fj.00-0566fje (2001). [DOI] [PubMed] [Google Scholar]
- 42.Franco L et al. The transmembrane glycoprotein CD38 is a catalytically active transporter responsible for generation and influx of the second messenger cyclic ADP-ribose across membranes. FASEB J. 12, 1507–1520 (1998). [DOI] [PubMed] [Google Scholar]
- 43.Satoh A et al. Sirt1 Extends Life Span and Delays Aging in Mice through the Regulation of Nk2 Homeobox 1 in the DMH and LH. Cell Metab. 18, 416–430, doi:S1550-4131(13)00333-1[pii]10.1016/j.cmet.2013.07.013 (2013). [DOI] [PMC free article] [PubMed] [Google Scholar]
- 44.Sato T & Clevers H Primary mouse small intestinal epithelial cell cultures. Methods Mol. Biol. 945, 319–328, doi: 10.1007/978-1-62703-125-7_19 (2013). [DOI] [PubMed] [Google Scholar]
- 45.Kolodziejska-Huben M, Kaminski Z & Paneth P Preparation of 18O-labelled nicotinamide. J. Label. Compd. Radiopharm. 45, 1005–1010, doi: 10.1002/jlcr.617 (2002). [DOI] [Google Scholar]
- 46.Chatterjee A, Hazra AB, Abdelwahed S, Hilmey DG & Begley TPA “radical dance” in thiamin biosynthesis: mechanistic analysis of the bacterial hydroxymethylpyrimidine phosphate synthase. Angew. Chem. Int. Ed. Engl. 49, 8653–8656, doi: 10.1002/anie.201003419 (2010). [DOI] [PMC free article] [PubMed] [Google Scholar]
- 47.Fouquerel E et al. ARTD1/PARP1 negatively regulates glycolysis by inhibiting hexokinase 1 independent of NAD+ depletion. Cell Rep. 8, 1819–1831, doi: 10.1016/j.celrep.2014.08.036 (2014). [DOI] [PMC free article] [PubMed] [Google Scholar]
- 48.Cheadle C, Vawter MP, Freed WJ & Becker KG Analysis of microarray data using Z score transformation. J. Mol. Diagn. 5, 73–81, doi: 10.1016/S1525-1578(10)60455-2 (2003). [DOI] [PMC free article] [PubMed] [Google Scholar]
Associated Data
This section collects any data citations, data availability statements, or supplementary materials included in this article.