

A next generation cancer drug candidate, a CDC7 inhibitor, TAK-931, was developed, which is being evaluated in clinical trials.
Abstract
Replication stress (RS) is a cancer hallmark; chemotherapeutic drugs targeting RS are widely used as treatments for various cancers. To develop next-generation RS-inducing anticancer drugs, cell division cycle 7 (CDC7) has recently attracted attention as a target. We have developed an oral CDC7-selective inhibitor, TAK-931, as a candidate clinical anticancer drug. TAK-931 induced S phase delay and RS. TAK-931–induced RS caused mitotic aberrations through centrosome dysregulation and chromosome missegregation, resulting in irreversible antiproliferative effects in cancer cells. TAK-931 exhibited significant antiproliferative activity in preclinical animal models. Furthermore, in indication-seeking studies using large-scale cell panel data, TAK-931 exhibited higher antiproliferative activities in RAS-mutant versus RAS–wild-type cells; this finding was confirmed in pancreatic patient-derived xenografts. Comparison analysis of cell panel data also demonstrated a unique efficacy spectrum for TAK-931 compared with currently used chemotherapeutic drugs. Our findings help to elucidate the molecular mechanisms for TAK-931 and identify potential target indications.
INTRODUCTION
Cancer is characterized by genomic instability, with high rates of mutation and genomic rearrangements leading to aggressive and therapy-resistant tumors (1, 2). One proposed mechanism causing genomic instability in cancer is replication stress (RS) (3). RS is defined as inefficient DNA replication that causes DNA replication forks to either progress slowly or stall, making them susceptible to DNA damage (4). A stalled replication fork can lead to DNA double-strand breaks (DSBs) or incomplete sister chromatid separation during mitosis (5). Many endogenous or exogenous hindrances to DNA replication can generate RS in cancer, such as shortages in nucleotides and/or replication factors, misincorporation of nucleotides, template DNA lesions, defects in unwinding, and perturbations in DNA structure (6, 7). In addition to having direct effects on DNA structure, RS, fork collapse, and subsequent genomic instability can be induced by oncogene activation (5, 6, 8–10). Examples include KRAS mutations, MYC amplification/activation, E2F activation, cyclin E overexpression, cell division cycle (CDC) 25A overexpression, RB mutations, p53 mutations, and alterations of other G1-S transition–promoting factors, which implicate RS as a central feature of cancer progression (6).
As RS is regarded as a cancer hallmark, there is considerable interest in targeting RS in cancer therapy (1, 6). Chemotherapeutic drugs that generate RS are widely used for both solid and hematological cancers (6). Nucleoside and nitrogenous base analogs, such as gemcitabine and 5-fluorouracil, reduce the size of the deoxyribonucleotide triphosphate (dNTP) pool available for DNA synthesis and can alter the relative proportions of the four dNTPs. Perturbations in dNTP levels reduce DNA replication speed, stalling replication forks and enhancing RS (11, 12). However, these analogs can also be incorporated into RNA during transcription, potentially contributing to toxic side effects in nondividing tissues. To reduce debilitating side effects, the proteins that play important roles in DNA replication have recently attracted attention as targets for next-generation anticancer drugs.
Of the regulatory proteins involved in DNA replication, the serine/threonine kinase CDC7 (also known as DBF4-dependent kinase) is emerging as an attractive target (13–19). During the late G1–to–S phase, CDC7 kinase is activated by binding to its regulatory protein, DBF4, which then phosphorylates Ser40 on minichromosome maintenance 2 (MCM2) proteins loaded onto chromatin to initiate DNA synthesis (20, 21). CDC7 kinase plays important roles in the maintenance of DNA replication forks and DNA damage response (DDR) pathways (22). In addition, CDC7 up-regulation has been correlated with poor prognosis in diffuse large B cell lymphoma (DLBCL), ovarian cancer, and triple-negative breast cancer (23). A prognostic association with high MCM2 expression has also been reported in breast cancer, non–small cell lung cancer, renal cell carcinoma, DLBCL, and squamous cell carcinomas.
This study reports the development of an oral, small-molecule, CDC7-selective inhibitor, TAK-931, designed to inhibit CDC7 activity in a time-dependent and adenosine 5′-triphosphate (ATP)–competitive manner. TAK-931 was shown to induce prolonged RS and consequent mitotic aberrations, potently inhibiting proliferation in both in vitro and in vivo preclinical cancer models. Furthermore, comparative analyses in large-scale cell panels revealed that TAK-931 was more effective against RAS-mutant cancer cell lines than against cell lines with wild-type alleles, showing a unique antiproliferative spectrum in a broad range of cancer cell lines. TAK-931 also showed antitumor efficacy in multiple patient-derived xenograft (PDX) models, suggesting that TAK-931 is a cancer therapeutic with a unique mechanism of action.
RESULTS
TAK-931 is a highly selective small-molecule inhibitor of CDC7 kinase
A small-molecule inhibitor of CDC7, TAK-931 (2-[(2S)-1-azabicyclo[2.2.2]oct-2-yl]-6-(3-methyl-1H-pyrazol-4-yl)thieno[3,2-d]pyrimidin-4(3H)-one hemihydrate), was developed as a clinical candidate (Fig. 1A and fig. S1A). TAK-931 potently inhibited the enzymatic activity of CDC7 kinase with an IC50 (median inhibitory concentration) <0.3 nM but was a poor inhibitor of CDK2 kinase, which was used as an enzymatic control (IC50 = 6300 nM) (Fig. 1B). In addition, kinase selectivity assays also demonstrated high selectivity of TAK-931 against CDC7, which was >120 times higher than that of the other 317 tested kinases (Fig. 1C and fig. S1B). The inhibitory activity of TAK-931 was reduced at high ATP concentrations (fig. S1C, blue line) but improved with preincubation of TAK-931 and CDC7 (fig. S1C, black line). The kinetic profiling and interaction analyses of TAK-931 with CDC7 protein revealed that the KD value (equilibrium dissociation constant), Koff value (dissociation rate constant), and residence time were 4.24 × 10⁻¹⁰ M, 6.30 × 10⁻⁴/s, and 26 min, respectively (18). These results indicate that TAK-931 is a time-dependent, ATP-competitive inhibitor.
Fig. 1. TAK-931 is an ATP-competitive type of CDC7-selective inhibitor.
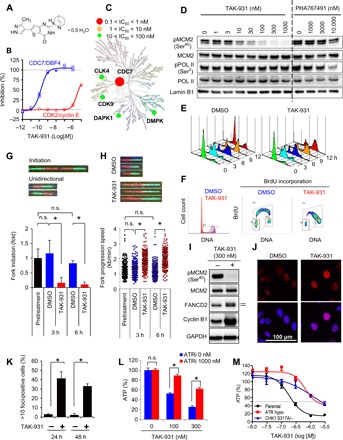
(A) Chemical structure of TAK-931. (B) Enzymatic inhibitory activities of TAK-931 against CDC7/DBF4 (blue) and CDK2/cyclin E (red). (C) Kinome tree depiction of IC50 values of TAK-931 inhibition. Illustration reproduced courtesy of Cell Signaling Technology Inc. (www.cellsignal.com). (D) Cellular activity of TAK-931. COLO205 cells were treated with the indicated concentration of TAK-931 or PHA767491 for 4 hours. pMCM2 and pPOL II were used for the target engagement markers of CDC7 kinase and CDK9 kinase, respectively. MCM2, POL II, and Lamin B1 were used for the loading controls. PHA767491 was used as a reference compound. (E) TAK-931 delays S phase progression. The cells (G1-S synchronized by dT block) were treated with DMSO (control, left) and TAK-931 (300 nM, right). The cells were collected at the indicated time points after the TAK-931 treatment and analyzed by flow cytometry. (F) Effect of TAK-931 on BrdU incorporation in HeLa cells. HeLa cells were treated with DMSO (red) or TAK-931 (300 nM; blue) for 24 hours, and then BrdU was incorporated for 30 min. The cells were stained with propidium iodide and anti-BrdU antibody to be analyzed by flow cytometry. (G) Effects of TAK-931 on origin firing; HeLa cells treated with DMSO (blue) or TAK-931 (300 nM; red). Top: Representative images of DNA fibers. Green and red indicate CldU- and IdU-labeled DNA fibers, respectively. Data are presented as means ± SD (n = 3). Differences were considered significant at *P ≤ 0.05. n.s., not significant. (H) Effects of TAK-931 on fork progression. Top: Representative images of DNA fibers with DMSO or TAK-931 treatment. Differences were considered significant at *P ≤ 0.05. (I) TAK-931 induction of RS. HeLa cells were treated with TAK-931 (300 nM) for 24 hours. Immunoblotting of pMCM2, MCM2, FANCD2, cyclin B1, and glyceraldehyde-3-phosphate dehydrogenase (GAPDH) was performed. Upper band of FANCD2 indicates ubiquitinated FANCD2. Ubiquitinated FANCD2 and cyclin B1 were used for the markers of RS and S-G2 arrest, respectively. MCM2 and GAPDH were used for the loading controls. (J) Effects of TAK-931 on FANCD2 foci formation. Red and blue signals indicate FANCD2 and DAPI (DNA). HeLa cells were treated with TAK-931 (300 nM) for 24 hours. (K) Quantification of FANCD2 foci formation in HeLa cells treated with DMSO (−) or TAK-931 (+). The y axis indicate percentage of cells with >10 foci per nucleus. Data are presented as means ± SD (n = 3). Differences were considered significant at *P ≤ 0.05. (L) ATR-mediated RS signaling involvement in TAK-931 antiproliferative effects. COLO205 cells were treated with TAK-931 alone or TAK-931 + ATR inhibitor (VE-821, 1 μM) at the indicated concentrations for 72 hours. Blue and red bars indicate TAK-931 alone and TAK-931 + VE-821 treatments, respectively [means ± SD (n = 3)]. Relative ATP amounts were calculated with chemiluminescence assay and compared with the chemiluminescence value of DMSO treatment. Statistical analysis was performed using Student’s t test. Differences were considered significant at P < 0.05. (M) Contribution of ATR and CHK1 to TAK-931 antiproliferative effect. DLD1-based isogenic cell lines were treated with the indicated concentration of TAK-931 for 72 hours. Black, red, and blue lines indicate parental, ATR hypomutation, and CHK1 mutation (S317A/−), respectively.
Next, the cellular effects of TAK-931 were assessed in COLO205 cells. CDC7 kinase specifically phosphorylates MCM2 on Ser40 (pMCM2) (21, 24, 25), whereas CDK9, which is the second high-affinity target of TAK-931 (fig. S1B), phosphorylates RNA polymerase II on Ser2 (pPOL II) (26). Thus, pMCM2 and pPOL II were used as markers for target engagement pharmacodynamics (PD) for CDC7 kinase and CDK9, respectively. PHA767491, another CDC7 chemical inhibitor (14), was used as a reference compound. Dose-dependent inhibition of pMCM2 was detected at TAK-931 concentrations of 10 to 100 nM, and maximal pMCM2 inhibition was sustained up to 1000 nM, the highest TAK-931 concentration tested (Fig. 1D). In contrast, reduced pPOL II was not detected with TAK-931, even at 1000 nM. As for PHA767491, dose-dependent inhibition of pPOL II was detected at 1000 to 10,000 nM, with partial inhibition of pMCM2 observed at the highest PHA767491 concentration, 10,000 nM (Fig. 1D). These results demonstrate that TAK-931 has a high selectivity against CDC7 kinase in cell assays.
TAK-931 induces RS and prolongs the late S phase, resulting in inhibition of cancer cell proliferation
Given that CDC7 kinase regulates DNA replication, the pharmacological inhibition of CDC7 activity by TAK-931 was also expected to induce delayed S phase progression, RS, and S phase checkpoint activation. S phase progression was monitored by time-course, fluorescence-activated cell sorting (FACS) analysis in synchronous HeLa cells treated with TAK-931 (27). Treatment with 300 nM TAK-931 was mainly used for the following studies, because this concentration potently inhibited pMCM2 to undetectable levels in various cell lines (fig. S1D). Control cells [treated with dimethyl sulfoxide (DMSO)] progressed through the S phase in 9 hours and entered the next G1 phase 12 hours after the dT block release (Fig. 1E, left). In contrast, although S phase entry was observed, TAK-931–treated cells exhibited delayed S phase progression, stalling at late S and/or G2 phase 12 hours after release (Fig. 1E, right). The propidium iodide and bromodeoxyuridine (BrdU) incorporation assay in asynchronous (AS) cells also revealed that TAK-931–treated HeLa cells stalled at the late S–G2 phase (Fig. 1F). Prolonged S phase was also detected under the AS condition in TAK-931–treated COLO205, SW948, and PANC-1 cells, while the effects of TAK-931 on the prolonged S phase were relatively moderate in untransformed fibroblasts, as previously reported (fig. S1, E and F) (28).
A DNA fiber assay was performed to determine how TAK-931 affects S phase stalling in terms of origin firing and replication fork velocity (fig. S2A) (29, 30). As shown in Fig. 1G, TAK-931 significantly reduced fork initiation compared with DMSO-treated cells. In contrast, TAK-931 enhanced fork progression (Fig. 1H). This phenotype is similar to those previously reported with other CDC7 inhibitors (14, 31). These results suggest that CDC7 plays important roles in the initiation of origin firing, with subsequent negative regulation of fork progression in the fired origin, showing that origin firing is closely linked to fork progression in a CDC7-mediated manner (29, 30). Given that TAK-931 did not completely inhibit fork firing (Fig. 1G), it is possible that the small number of active forks, supported by the increased speed of fork progression, could initiate S phase entry followed by delayed S phase progression, rather than a complete G1-S arrest, in TAK-931–treated cells (Fig. 1, E to H).
Immunoblotting revealed that TAK-931 caused DNA RS (ubiquitinated FANCD2), DDR (pChk1), S-G2 phase arrest (cyclin B1 and pCDC2), and apoptosis [γH2A.X and cleaved poly[adenosine diphosphate (ADP)–ribose] polymerase (PARP)] in HeLa and COLO205 cells (Fig. 1I and fig. S2B, left). Immunofluorescence findings demonstrated that TAK-931 significantly elevated foci formation of FANCD2 and RPA2 [markers of single-strand breaks (SSBs)], but not 53BP1 (a marker of DSBs), indicating that TAK-931 induces RS to generate SSBs, but not DSBs, during prolonged S phase arrest (Fig. 1, J and K, and fig. S2, C and D). In contrast, in MRC5 cells, TAK-931 induced DDR and S-G2 checkpoint activation, but not γH2A.X or cleavage of PARP (fig. S2B, right). TAK-931 also exhibited less antiproliferative activity in these fibroblasts than in COLO205 and HeLa cells (fig. S2, E and F). These studies demonstrate that TAK-931 induces DNA RS and DNA SSBs, inhibits proliferation, and stalls S phase progression in cancer cells. Moreover, the antiproliferative activity of TAK-931 against untransformed fibroblasts appears to be relatively modest.
To determine RS effects of TAK-931 on proliferation inhibition in cancer cells, we performed rescue assays using a small-molecule inhibitor of ataxia telangiectasia and Rad3-related protein (ATR), VE-821 (32). ATR is a hub protein of S phase checkpoint machinery, which monitors aberrant DNA replication such as stalled replication forks. ATR inhibition was expected to silence the DDR signaling cascade stimulated by TAK-931 and attenuate TAK-931 antiproliferative activity. As shown in Fig. 1L, TAK-931 inhibited proliferation of COLO205 cells in a concentration-dependent manner, and VE-821 significantly attenuated this TAK-931–induced inhibition. VE-821 also attenuated TAK-931–mediated S phase stalling in SW948 and PANC-1 cells (fig. S2G). To confirm the contribution of the ATR pathway to TAK-931 sensitivity, we compared antiproliferative effects in isogenic ATR-hypomutant (A2101G/A2101G) (33) and CHK1-mutant (S317A/−) DLD1 cell lines. Both the ATR-hypomutant and CHK1-mutant cell lines were less sensitive to TAK-931 compared with their parental cell line (Fig. 1M). These ATR-mediated effects of TAK-931 suggest that DNA RS is a key biological event for the antiproliferative activity of TAK-931.
Phosphoproteomics with TAK-931 treatment
Next, we determined the time-dependent antiproliferative effects of TAK-931. COLO205 cells were treated with TAK-931 for 8, 24, 48, or 72 hours and then assayed for cell viability (fig. S3A). The 48- and 72-hour treatments showed comparable, potent antiproliferative effects, while treatments ≤24 hours showed milder effects (Fig. 2A). These data suggest that the biological events associated with proliferation inhibition are triggered at least 24 hours after TAK-931 treatment. To determine the signaling pathways affected by TAK-931, we performed a time-dependent phosphoproteomics analysis at 0, 4, and 24 hours (Fig. 2B). Stable Isotope Labeling with Amino Acids in Cell Culture (SILAC)–labeled COLO205 cells with the indicated TAK-931 treatments were subjected to quantitative mass spectrometry (MS), detecting 15,128 phosphorylation sites of the 4426 phosphoproteins (fig. S3B). Although pMCM2 inhibition by TAK-931 was detected by immunoblotting (fig. S3C), the phosphoproteomics analysis did not identify pMCM2, presumably because of technical difficulties in detecting its quantitative phosphorylation status. After 4 hours of treatment, only two phosphorylation sites were detected as significantly down-regulated: MAX gene-associated protein (MGA) and alpha-enolase (ENO1) (table S1 and Fig. 2C, left). However, after 24 hours of treatment, 51 phosphorylation sites were identified as being significantly altered, including 44 up-regulations and 7 down-regulations (Fig. 2C, right; table S1; and fig. S3D). Immunoblotting confirmed elevated phosphorylation of CDC6, a phosphoprotein detected by the phosphoproteomics analysis, at Ser106 (pCDC6) in TAK-931–treated cells (fig. S3E). Gene ontology (GO) enrichment analysis in the categories of biological process (BP) and cellular component (CC) revealed that 10 GO terms from BP and 2 GO terms from CC were significantly enriched in the treated cells after 24 hours (Fig. 2D). Network analysis of the changed phosphorylation profile (34) also revealed that significant network modules existed after 24 hours of treatment, including DNA replication/damage, mitotic progression/spindle assembly, nucleus assembly, guanosine triphosphatase (GTPase) activity, cell migration, cell adhesion, TP53, and protein translation (Fig. 2E). No network was observed after 4 hours of treatment due to very low numbers of altered phosphorylation sites. These pathway analyses suggest that TAK-931–induced RS could result in mitotic aberrations, leading to elevated spindle assembly checkpoint (SAC) activity and prolonged mitotic arrest. The up-regulation of p53 pathways and down-regulation of protein translation pathways also appear to be associated with stress responses to the long-term RS caused by TAK-931.
Fig. 2. Phosphoproteomics analysis in COLO205 cells treated with TAK-931.

(A) Time-dependent antiproliferative activity of TAK-931 in COLO205 cells. The relative ATP concentration was calculated using chemiluminescence assay and compared with the chemiluminescence value of 0 nM treatment. Gray, green, blue, and red bars indicate 8-, 24-, 48-, and 72-hour treatments, respectively [means ± SD (n = 3)]. Statistical analysis was performed using Student’s t test. Differences were considered significant at *P < 0.05 and **P < 0.01. (B) Experimental schemes for phosphoproteomics analysis. The SILAC-labeled COLO205 cells were treated with TAK-931 at 100 nM for 0, 4, and 24 hours (red lines indicate TAK-931 treatment). (C) Volcano plot of quantified phosphorylation sites. The x axis indicates the log10-scaled mean ratio of each phosphorylation site between TAK-931 and DMSO treatment. The plus and minus indicate up-regulation and down-regulation, respectively. The gray lines indicate twofold changes. The y axis indicates the SD. The volcano plots of 4 (left)– and 24 (right)–hour treatments are shown. The significantly changed phosphorylation sites are depicted in red. (D) GO term enrichment analysis. The significantly regulated phosphoproteins are used for the GO term enrichment analysis (2 phosphosites for 4 hours and 51 for 24 hours). Enrichment analysis was performed by nonconditional hypergeometric testing using Fisher’s exact test. To account for multiple hypotheses testing, false discovery rate (FDR) correction according to Benjamin-Hochberg was performed. Indicated are GO categories, GO term names, and calculated q values. q values at <0.05 (FDR < 5%) are considered significantly enriched regulated phosphoproteins. (E) Subextractor network analysis with the quantified phosphoproteins of the 24-hour treatment. Subnetworks predominantly comprising phosphoproteins regulated upon the 24-hour treatment are focused and illustrated. The color of the protein node is determined by the regulation (according to the z score), which does not rely on significance after FDR correction. When a protein harbors more than one phosphorylation site, the coloring is determined by the highest regulation. Blue, down-regulation; red, up-regulation; intensity, magnitude of the regulation.
TAK-931–induced RS causes centrosome overduplication and premature separation
To confirm the mitotic aberrations from the phosphoproteomics analysis, we conducted a time-dependent cell cycle analysis after TAK-931 treatment using histone H3 phosphorylated at Ser10 (pHH3) as a mitotic marker. HeLa cells were primarily used for the following experiments because of their ease of use in both cell cycle and microscopic analyses (35). The percentage of pHH3-positive cells in the DMSO-treated control was relatively stable at each time point, ranging between 2.3 and 3.6% (Fig. 3, A and B, and fig. S3F). In contrast, in the TAK-931–treated group, the percentage of pHH3-positive cells gradually declined in a time-dependent manner until 8 hours after treatment initiation (1.8% at 4 hours and 0.6% at 8 hours), indicating that TAK-931 delays S phase progression and reduces mitotic cell numbers. However, the percentage of pHH3-positive cells increased after 24 hours of treatment to 1.9% and reached 7.8% after 48 hours of treatment, surpassing the control cells (Fig. 3B). These results suggest that TAK-931–treated cells escape S-G2 arrest during long-term treatment and, in turn, exhibit prolonged mitosis, presumably due to SAC activation by mitotic aberrations.
Fig. 3. TAK-931–induced RS causes mitotic aberration.
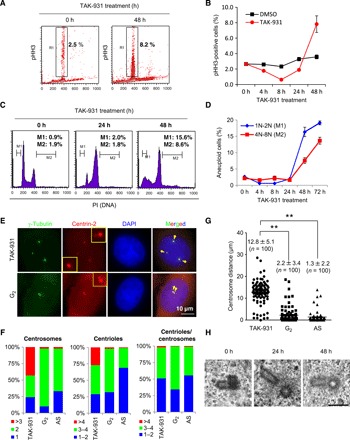
(A) Effect of TAK-931 on mitotic arrest in a time-dependent manner. HeLa cells were treated with TAK-931 at 300 nM for the indicated number of hours. pHH3 was used as a mitotic index. R1 indicates the percentage of pHH3-positive cells. (B) Time-dependent mitotic accumulation in TAK-931–treated cells. TAK-931–treated HeLa cells were collected at the indicated time points for FACS. The graph indicates the quantified pHH3-positive cells [means ± SD (n = 3)]. Red and black lines indicate TAK-931– and DMSO-treated HeLa cells, respectively. (C) Cell cycle histogram of TAK-931–treated cells. HeLa cells were treated with TAK-931 at 300 nM and then collected at the indicated time points for FACS analysis. M1 and M2 indicate the cell populations with 1N-2N and 4N-8N DNA content, respectively. Representative histograms are shown. (D) Time-dependent accumulation of aneuploid cells by TAK-931 treatment. The graph indicates the quantified M1 and M2 cells [means ± SD (n = 3)]. Blue and red lines indicate M1 (1N-2N) and M2 (4N-8N), respectively. (E) Centrosome disorganization in TAK-931–treated cells. Representative immunofluorescence pictures of TAK-931–treated (TAK-931; top) and G2-synchronous HeLa cells (G2; bottom) are shown. Centrin-2–RFP–expressing HeLa cells were treated with TAK-931 for 24 hours. Cells 7 hours after dT release were used as the G2-synchronous cells. Green, red, and blue signals indicate γ-tubulin (centrosome)–, centrin-2 (centriole)–, 4′,6-diamidino-2-phenylindole (DAPI)–stained DNA, respectively. (F) Quantitative analysis of mitotic morphology in TAK-931–treated (TAK-931), G2-synchronous, and AS HeLa cells. The graphs show the percentage of cells with the indicated centrosome numbers (left), centriole numbers (middle), and centriole per centrosome numbers (right). (G) Quantitative analysis of centrosome distance in TAK-931–treated, G2-synchronous, and AS HeLa cells. Statistical analysis was performed using Student’s t tests. Differences were considered significant at P < 0.05. (H) Electron microscopy images of the centrioles in TAK-931–treated HeLa cells. HeLa cells were treated with TAK-931 at 300 nM for 0 hour (left), 24 hours (middle), and 48 hours (right). PI, propidium iodide.
FACS analysis with propidium iodide also revealed that the number of cells with DNA content of 1N-2N (M1) or 4N-8N (M2) increased at ≥24 hours in a time-dependent manner; this appeared to represent aneuploid cells generated by chromosomal missegregation (Fig. 3, C and D). Given that centrosome aberrations are closely associated with chromosomal missegregation, the number, localization, and morphology of the centrosomes in TAK-931–treated HeLa cells were determined. HeLa cells stably expressing red fluorescent protein (RFP)–tagged centrin-2, a centriole marker, were used for centriole and/or centrosome assessment by microscopic analysis (Fig. 3E). AS and G2-synchronous HeLa cells were used as controls. Immunofluorescence of γ-tubulin, a centrosome marker, revealed that >3 extra centrosomes were markedly increased in TAK-931–treated cells, compared with G2-synchronous or AS control cells (43, 2, and 2%, respectively; Fig 3F, left). In addition, centriole numbers were also increased in TAK-931–treated cells (Fig. 3F, middle); >4 centrioles were observed in 27% of TAK-931–treated cells and only in 2% of G2-synchronous cells and 1% of AS cells. However, extra centrioles in a centrosome (i.e., centriole/centrosome) were rarely observed, even in TAK-931–treated cells, and the centriole/centrosome distribution was similar between TAK-931–treated and AS cells, but not G2-synchronous cells (Fig. 3F, right). Furthermore, centrosome localization was prominently distinct between the TAK-931–treated and G2-synchronous cells. The centrosomes were close together in the G2-synchronous cells, but farther apart in the TAK-931–treated cells (12.8 ± 5.1, 2.2 ± 3.4, and 1.3 ± 2.2 μm in TAK-931–treated, G2-synchronous, and AS cells, respectively) (Fig. 3G and fig. S3G). Using electron microscopy, no centriole morphological abnormalities were detected in TAK-931–treated cells (Fig. 3H). Given that centrosome separation is initiated at prophase in early mitosis, the centrosome cycle in TAK-931–treated cells appears to progress, although the cell cycle in the nucleus experiences a prolonged S-G2 phase by TAK-931–induced RS. TAK-931 appears to cause cell cycle phase mismatching between the nucleus and the centrosome. This phase mismatching causes mitotic aberrations with overduplicated centrosomes, leading to the antiproliferative effects of TAK-931 observed in cancer cells.
Antiproliferative effects of TAK-931 and RS in a diverse range of cancer cells
To determine the universality of the antiproliferative effects of TAK-931 and its usefulness as an anticancer drug candidate, we conducted large-scale in vitro antiproliferative assays in 246 cell lines, which included 245 solid and hematological cancer cells and 1 normal lung fibroblast line (Fig. 4A). TAK-931 showed antiproliferative activity in a broad range of cancer cell lines, with half-maximal growth inhibition (GI50) values ranging from 30.2 nM to >10 μM (median, 407.4 nM). Thirty-three, 156, and 57 cell lines exhibited GI50 values of <100, 100 to 1000, and > 1000 nM, respectively. Representative growth inhibition curves are shown in Fig. 4B (COLO205, RKO, SW948, and PANC-1 cells). The large-scale cell panel studies also revealed that in multiple cell lines, pHH3-positive cells increased after TAK-931 treatment in a dose-dependent manner (Fig. 4C). Furthermore, among the sensitive cell lines (first quartile, n = 58), pHH3-positive cells were significantly higher than among the resistant cell lines (fourth quartile, n = 59; Fig. 4D).
Fig. 4. TAK-931 causes antiproliferation in cancer cell lines.
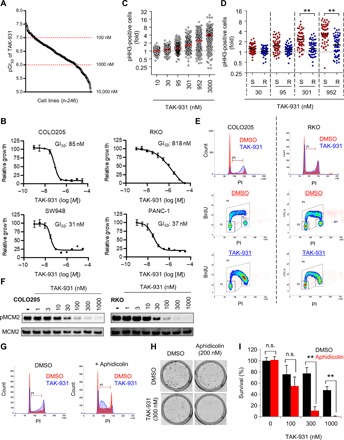
(A) GI50 values of TAK-931 in 246 cancer cell lines. Cell viability was assessed by visualizing dye-stained nuclei 72 hours after TAK-931 treatment. Each dot indicates the pGI50 (−log10[GI50]) value of each cell line. (B) Growth inhibition curves of TAK-931 in the representative cancer cell lines (COLO205, RKO, SW948, and PANC-1). (C) Fold increase in pHH3-positive cells in 246 cancer cell lines. Cells were stained with fluorescent-labeled pHH3 antibody 72 hours after TAK-931 treatment at the indicated concentrations. The fold of pHH3-positive cells was calculated as the percentage of pHH3-positive cells relative to 0 nM TAK-931 treatment. (D) Comparison of fold increase in pHH3-positive cells between TAK-931–sensitive and TAK-931–resistant cell lines. Red and blue indicate sensitive (S; first quartile) and resistant (R; fourth quartile), respectively. Statistical analysis was performed using Student’s t test. Differences were considered significant at *P < 0.05 and **P < 0.01. (E) Effect of TAK-931 on the stalled S phase between sensitive (COLO205) and resistant (RKO) cells. Top: The cells were treated with DMSO (control; red) and TAK-931 (300 nM; blue). The cells were collected 24 hours after TAK-931 treatment and analyzed by flow cytometry. Bottom: COLO205 and RKO cells were treated with DMSO or TAK-931 (300 nM) for 24 hours, and then BrdU was incorporated for 30 min. The cells were stained with PI and anti-BrdU antibody to be analyzed by flow cytometry. (F) Concentration-dependent inhibition of pMCM2 by TAK-931 in TAK-931–sensitive and TAK-931–resistant cells. COLO205 (GI50 = 85 nM) and RKO (GI50 = 818 nM) cells were used as representatives of TAK-931–sensitive and TAK-931–resistant cells, respectively. Both cells were treated with the indicated concentration of TAK-931 for 4 hours. pMCM2 was used as the target engagement marker of CDC7. MCM2 was used as the loading control. (G) Aphidicolin-induced RS enhances TAK-931 effect on the stalled S phase in resistant (RKO) cells. The cells were treated with DMSO (red at left), TAK-931 (300 nM; blue at left), aphidicolin (200 nM; red at right), and combination (blue at right). The cells were collected 24 hours after TAK-931 treatment and analyzed by flow cytometry. (H) Colony formation assays in RKO cells with TAK-931 and aphidicolin combination treatment. Representative images of crystal violet staining are shown. (I) Quantitative analysis of colony formation assay (n = 3). Percent survival was calculated relative to the colonies with DMSO control treatment. Statistical analysis was performed using Student’s t test. Differences were considered significant at *P < 0.05 and **P < 0.01.
The effect of TAK-931 on the cell cycle was compared between the sensitive (COLO205) and resistant (RKO) cell lines. Stalling at the S phase and pHH3 elevation were reduced in RKO cells (Fig. 4E and fig. S4A), although the dose and dynamic ranges of pMCM2 inhibition by TAK-931 were equivalent between the RKO and COLO205 cells (Fig. 4F). RKO cells were then treated with low-dose aphidicolin (200 nM) to induce an imperceptible RS, before evaluating whether this chemically induced imperceptible RS could sensitize resistant cells to TAK-931. As shown in Fig. 4G, single-agent TAK-931 had a lower effect on cell cycle change compared with combined treatment with TAK-931 and aphidicolin, which markedly induced stalled S phase in RKO cells. Furthermore, low-dose aphidicolin treatment drastically enhanced the antiproliferative activity of TAK-931 in RKO cells (Fig. 4, H and I). These results suggest that TAK-931 alone does not induce substantial RS in resistant cells, despite fully inhibiting cellular CDC7 kinase activity.
Oncogenic mutations and TAK-931 sensitivity
The correlation of GI50 values with pathological classification and cell doubling speed was assessed (fig. S4, B and C). However, doubling speed and cancer pathology were not significantly correlated with TAK-931 GI50 values in cancer cells. Given that CDC7/DBF4 are highly expressed in a broad range of tumors (fig. S4D), the correlation of TAK-931 sensitivity with the expression levels of CDC7/DBF4 was also assessed. As shown in fig. S4 (E and F), mRNA expression levels for CDC7/DBF4 were not significantly different between the sensitive and resistant groups. Furthermore, neither CDC7, DBF4, nor pMCM2 protein expression level was correlated with TAK-931 sensitivity (fig. S4G). Thus, TAK-931 sensitivity could not be predicted by these factors.
The effect of specific oncogenic mutations on the antiproliferative activity of TAK-931 was assessed. Comparative analysis revealed that GI50 values in RAS-mutant cells were statistically lower than those in RAS–wild-type cells (P = 0.0004), whereas BRAF (P = 0.323), PTEN (P = 0.775), RB1 (P = 0.702), and TP53 (P = 0.203) mutations were not significantly correlated with GI50 values (Fig. 5A and fig. S4H). Furthermore, pHH3-positive cells were significantly higher in RAS-mutant cell lines than in RAS–wild-type cell lines (Fig. 5B). To confirm the contribution of the RAS family mutation to TAK-931 sensitivity, we compared the GI50 values in isogenic KRAS-mutant and KRAS–wild-type pairs (fig. S5A). SW48-based (Fig. 5C, left) and DLD1-based (Fig. 5C, right) isogenic pairs were used, which are KRAS–wild-type and KRAS-mutant cancer cell lines, respectively. In the SW48 cells, the KRAS-mutant pairs were generated by introducing the KRAS-mutant genes, G12V and G13D, into the parental cells. In the DLD1 cells, the KRAS-mutant allele was knocked out from the parental cells, leaving the KRAS–wild-type allele (i.e., knockout or wild type). In both the SW48- and DLD1-based isogenic cell lines, TAK-931 induced antiproliferative effects and caspase-3/7 activation more potently in KRAS-mutant cells than in their KRAS–wild-type–matched pairs (Fig. 5C and fig. S5, B and C). Immunoblotting also revealed that, in response to TAK-931, the nuclear FANCD2 protein, which is an index of RS, increased more in KRAS-mutant isogenic cells than in KRAS–wild-type isogenic cells in both the SW48 and DLD1 models (Fig. 5D). Furthermore, pCDC6, pChk1, and pCDK1 were also elevated more prominently in KRAS-mutant SW48 isogenic cell lines (Fig. 5E). These results suggest that TAK-931 can cause a more marked elevation of RS in KRAS-mutant cancer cells compared with KRAS–wild-type cells. This mechanism may be involved in the greater sensitivity of KRAS-mutant cells to TAK-931.
Fig. 5. Contribution of oncogenic mutations to TAK-931 sensitivity.
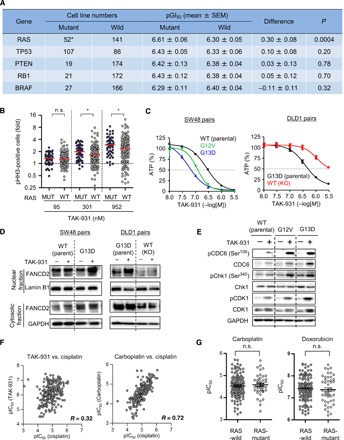
(A) Summary of TAK-931 GI50 values in mutant and wild-type (WT) cell lines with RAS, TP53, PTEN, RB1, and BRAF mutations. Sequence data in the Cancer Cell Line Encyclopedia (CCLE) database were used. Statistical analysis was performed using Student’s t tests. (B) Fold increase in pHH3-positive cells between RAS-mutant and RAS-WT cancer cell lines. Statistical analysis was performed using Wilcoxon-Mann-Whitney test. Differences were considered significant at *P < 0.05. (C) KRAS mutations increase the sensitivity to TAK-931 in both SW48-based (left) and DLD1-based (right) isogenic cell lines. The SW48- or DLD1-based isogenic cell lines were treated with the indicated concentration of TAK-931 for 72 hours. Blue and red bars indicate TAK-931 alone and TAK-931 + VE-821 treatments, respectively (means ± SD [n = 3]). Left: Black, green, and blue lines indicate WT (parental), KRAS G12V mutation, and KRAS G13D mutation, respectively. Right: Black and red lines indicate KRAS G13D mutation (parental) and WT (mutation allele knockout), respectively. (D) TAK-931 induces more DNA RS in the KRAS-mutant isogenic cells. SW48-based (left) and DLD1-based (right) isogenic cell line pairs treated with or without TAK-931 (300 nM) for 24 hours. Nuclear fraction of FANCD2 was used as an index of RS induction. Lamin B1 and GAPDH were used as loading controls of nuclear and cytoplasmic fractions, respectively. (E) TAK-931 induces more phosphorylation of CDC6, Chk1, and CDK1 in the KRAS-mutant isogenic cells. (F) Correlation dot plots of pIC50 values between TAK-931, carboplatin, and cisplatin. (G) Dot plots of pIC50 values of carboplatin and doxorubicin in RAS-mutant and RAS-WT cell lines.
Antiproliferative spectrum of TAK-931 compared with other chemotherapeutic drugs
The spectrum of antiproliferative activity of TAK-931 was evaluated in comparison with currently used chemotherapeutic drugs, including platinum compounds (cisplatin, carboplatin, and oxaliplatin), topoisomerase inhibitors (SN-38 and doxorubicin), antimetabolites (gemcitabine and methotrexate), and tubulin binders (paclitaxel). The IC50 values in in vitro antiproliferative assays for these drugs were obtained from Eurofins Panlabs Inc. The median IC50 values of drugs showing potent antiproliferative activities in a broad range of cancer cell lines were 4.92, 4.51, 5.78, 7.90, 7.45, 8.42, 7.45, and 8.49 (pLog10[M]) for cisplatin, carboplatin, oxaliplatin, gemcitabine, methotrexate, SN-38, doxorubicin, and paclitaxel, respectively (fig. S5D). Correlations between the antiproliferative activity of TAK-931 and other chemotherapeutic drugs were based on comparisons of IC50 values in the cell lines tested (fig. S5E). Antiproliferative activities were highly correlated within the same class of chemotherapeutic drugs, as shown by the R values; for example, carboplatin and cisplatin showed R = 0.72 (Fig. 6F and fig. S5E). Platinum compounds and topoisomerase inhibitors, particularly doxorubicin and oxaliplatin, exhibited a moderate correlation of antiproliferative activities compared with other chemotherapeutic drugs (R = 0.4 to 0.7). Although TAK-931 exhibited a moderate correlation with doxorubicin (R = 0.51) and oxaliplatin (R = 0.47), the correlations between TAK-931 and other chemotherapeutic drugs (i.e., platinum compounds, topoisomerase inhibitors, antimetabolites, and tubulin binders) were relatively low (R = 0.2 to 0.4) (Fig. 6F and fig. S5E). Furthermore, in contrast to TAK-931, RAS-mutant antiproliferative effects were not observed with these other chemotherapeutic drugs (Fig. 6G and fig. S5F). These findings indicate that TAK-931 could be a new anticancer drug candidate, with a unique efficacy spectrum compared with currently used chemotherapeutic drugs.
Fig. 6. PD and antitumor efficacy of TAK-931 in preclinical mouse models.
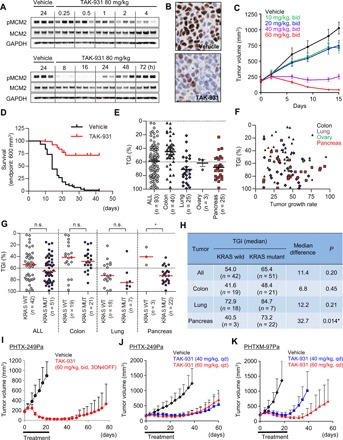
(A) Expression of pMCM2 in COLO205 xenografts at the indicated time points after oral administration of TAK-931 at a dose of 80 mg/kg. MCM2 and GAPDH were used as controls. (B) Immunohistochemistry of pMCM2 in the tumor sections from COLO205. (C) Antitumor efficacy of TAK-931 in the COLO205 xenograft nude mouse model. COLO205 xenografted nude mice were orally administered TAK-931 at the indicated dose regimens. (D) Kaplan-Meier survival curve in 93 PDX models. Black and red lines indicate vehicle- and TAK-931–treated groups, respectively. Xenografted mice were orally administered TAK-931 at 60 mg/kg, bid, 3 days on/4 days off, for the indicated cycles. Three mice were treated with vehicle or TAK-931 for each model. (E) Comparison of antitumor efficacy of TAK-931 between overall (circles), colon (upward triangles), lung (diamonds), ovary (downward triangles), and pancreas (squares) PDX models. The y axis indicates %TGI. (F) No significant correlation was observed between %TGI and tumor growth (mm3/day) in 93 PDX models. Black, purple, green, and red plots indicate colon, lung, ovary, and pancreas models, respectively. (G) Comparison of antitumor efficacy of TAK-931 between KRAS-WT (closed) and KRAS-mutant (open) PDXs in overall, colon, lung, ovary, and pancreas models. Red lines indicate median values of %TGI. Statistical analysis was performed using both parametric Student’s t test and nonparametric Wilcoxon-Mann-Whitney test. Differences were considered significant at P < 0.05. (H) Summary of %TGI between KRAS-WT and KRAS-mutant PDXs. (I) Antitumor efficacy of TAK-931 in the PHTX-249Pa KRAS-mutant pancreatic PDX model at the intermittent regimen. PHTX-249Pa xenografted nude mice were orally administered with TAK-931 at the intermittent regimen (60 mg/kg, bid, 3ON4OFF, three cycles). Black and red indicate vehicle and TAK-931 treatments, respectively. The efficacy data are plotted as mean tumor volumes [mm3 ± SD (n = 8)]. (J) Antitumor efficacy of TAK-931 in the PHTX-249Pa KRAS-mutant pancreatic PDX model at the continuous regimen. PHTX-249Pa xenografted nude mice were orally administered with TAK-931 the continuous regimens [40 or 60 mg/kg, once daily (qd), 21 days]. Black, blue, and red indicate vehicle, TAK-931 at 40 mg/kg, and TAK-931 at 60 mg/kg treatments, respectively. The efficacy data are plotted as mean tumor volumes [mm3 ± SD (n = 7)]. (K) Antitumor efficacy of TAK-931 in the PHTXM-97Pa KRAS-mutant pancreatic PDX model at the continuous regimen. PHTX-97Pa xenografted nude mice were orally administered with TAK-931 the continuous regimens (40 or 60 mg/kg, qd, 21 days). Black, blue, and red indicate vehicle, TAK-931 at 40 mg/kg, and TAK-931 at 60 mg/kg treatments, respectively. The efficacy data are plotted as mean tumor volumes [mm3 ± SD (n = 6)].
Preclinical pharmacokinetics, PD, and efficacy studies of TAK-931
The preclinical pharmacokinetics (PK), PD, and efficacy of TAK-931 were investigated in a xenograft nude mouse model. COLO205 cells were selected for this in vivo study because this cell line was sensitive to TAK-931 in the in vitro study (Fig. 4). COLO205 xenografted mice received a single oral administration of TAK-931 at the indicated dosages. Tumor and plasma samples were collected at the indicated time points for measurement of TAK-931 concentrations. Exposure to TAK-931 was approximately dose proportional in both plasma and tumor (fig. S6, A and B); TAK-931 exposures in plasma and tumor appeared to be equivalent.
Time- and dose-dependent PD studies were performed in the COLO205 and SW948 xenograft nude mouse models. As shown in Fig. 6A and fig. S6C, levels of pMCM2 in tumors were reduced at 8 to 24 hours after administration of TAK-931 (80 mg/kg) but then recovered to the level of the vehicle control at ≥48 hours. pMCM2 in both tumor types was modulated by TAK-931 in a dose- and time-dependent manner (fig. S6, D and E). Immunohistochemistry of tumor sections also demonstrated time-dependent alterations in pMCM2 (Fig. 6B and fig. S6, F and G).
Next, in vivo antitumor efficacy studies of TAK-931 were performed in the COLO205 and SW948 xenograft models. The xenografted mice were orally administered vehicle or indicated doses of TAK-931 twice daily (bid) for 14 days. As shown in Fig. 6C and fig. S7 (A to E), TAK-931 demonstrated marked, dose-dependent antitumor activity, without severe body weight loss. Intermittent dosing schedules also exhibited marked antitumor efficacy (Fig. 6C and fig. S7, A to E), demonstrating flexibility in TAK-931 dosing to achieve antitumor efficacy.
Antitumor efficacy of TAK-931 in PDX models
The antitumor activity of TAK-931 was assessed in 93 PDX models (40 colorectal, 25 lung, 3 ovarian, and 25 pancreatic), termed a preclinical phase 2–like study. The mice xenografted with these tumors were orally administered TAK-931 (60 mg/kg, bid) with a regimen of 3 days on/4 days off for three to five cycles (i.e., 21 to 35 days) (60 mg/kg, bid, 3ON4OFF, three to five cycles; fig. S7F and table S2). The preclinical Kaplan-Meier survival analysis was performed using an endpoint tumor volume of 600 mm3 as a surrogate for mortality. The percentage tumor growth inhibition (%TGI) was determined on the indicated days (table S2). Survival analysis for all 93 cancer models combined demonstrated that TAK-931 treatment provided survival benefit compared with vehicle (hazard ratio, 0.13; 95% confidence interval, 0.09 to 0.20; P < 0.0001; Fig. 6D). Survival benefit with TAK-931 was also observed by cancer type (colon, lung, and pancreas; fig. S7G). In efficacy studies, antitumor efficacy (≤60 %TGI) was seen in 43 of 93 models (46.2%) (Fig. 6E and table S2). Median %TGIs were 56.5% for all cancer models, 43.8% for colorectal, 76.8% for lung, 57.4% for ovarian, and 70.1% for pancreatic cancer models (Fig. 6E). Similar to the in vitro antiproliferative assay results (fig. S4C), %TGIs were not significantly correlated with tumor growth rates in the PDX models (R2 = 0.01831; Fig. 6F). As the PDX models included 42 KRAS–wild-type and 51 KRAS-mutant tumors, the antitumor activities of TAK-931 were compared between KRAS–wild-type and KRAS-mutant PDX models (Fig. 6, G and H). There were no significant differences in %TGI values between KRAS–wild-type and KRAS-mutant tumors in the colorectal and lung PDX models. In contrast, differences in the %TGI values between the KRAS–wild-type and KRAS-mutant tumors were more apparent in the pancreatic PDX models (Fig. 6, G and H). Most of the pancreatic PDX models (22 of 25) were KRAS-mutant types, consistent with the high frequency of KRAS mutations in patients with pancreatic cancer. Statistical analyses by both parametric Student’s t test and nonparametric Wilcoxon-Mann-Whitney test demonstrated that KRAS-mutant pancreatic PDX models were more sensitive to TAK-931 than KRAS–wild-type pancreatic PDX models (P < 0.05; Fig. 6H).
To confirm the sensitivity of KRAS-mutant pancreatic PDX models to TAK-931, we conducted additional antitumor efficacy studies using two KRAS-mutant pancreatic PDX models: PHTX-249Pa and PHTXM-97Pa. In the PHTX-249Pa PDX model, TAK-931 exhibited potent antitumor activity with both intermittent (60 mg/kg, bid, 3ON4OFF, three cycles) and continuous dosing regimens (40 or 60 mg/kg, once daily, 21 days); %TGIs on day 22 were 96.6, 68.4, and 75.1%, respectively (Fig. 6, I and J). Furthermore, a delay in tumor regrowth was observed in the TAK-931–treated groups after the 3-week drug treatment period. In the other PDX model, PHTXM-97Pa, TAK-931 also exhibited potent antitumor activity at both 40 and 60 mg/kg, administered once daily (%TGIs were 86.1% at 40 mg/kg and 89.9% TGI at 60 mg/kg on day 22), with a delay in tumor regrowth observed more prominently at the 60 mg/kg dose (Fig. 6K). Although our studies suggest that KRAS status could be associated with TAK-931 sensitivity in pancreatic PDX models, further assessment in larger studies is required to draw firm conclusions regarding the relevance of KRAS mutations to TAK-931 antitumor efficacy.
DISCUSSION
In this study, the CDC7-selective small-molecule inhibitor, TAK-931, was characterized as a clinical candidate for anticancer therapy. Preclinical pharmacological findings revealed that TAK-931 delayed DNA replication in cancer cells, causing DNA RS and consequent inhibition of proliferation. Furthermore, TAK-931 exhibited significant antiproliferative activity across multiple preclinical animal models, with favorable PK, PD, and efficacy profiles. The mechanism of action underlying the antiproliferative effects of TAK-931 was also found to be unique: TAK-931–induced RS caused mitotic aberrations through centrosome dysregulation and chromosome missegregation, resulting in irreversible antiproliferative effects in cancer cells. Furthermore, in our indication-seeking studies, TAK-931 exhibited high antiproliferative activity in RAS-mutant cancer cell lines and showed a unique efficacy spectrum.
Therapeutic strategies to induce RS in cancer are broadly applied in currently used cancer treatments. The conventional RS-inducing chemotherapeutic drugs, such as nucleoside or nitrogenous base analogs, can also perturb RNA biogenesis because these analogs are incorporated into RNA during transcription. This disturbance of RNA biogenesis may be involved in the toxicity of these drugs in nondividing normal tissues (36). Given that CDC7 kinase controls DNA replication in proliferating cells and that its expression is restricted to proliferating cells (fig. S4D), TAK-931 may selectively target proliferation signaling pathways while avoiding disturbance of transcription pathways. In support of this, our phosphoproteomics analysis revealed that signaling pathways of cell cycle regulation, such as replication and mitosis, were prominently modulated in response to TAK-931, whereas transcription or RNA biogenesis pathways were not. In addition, TAK-931 exhibited reduced antiproliferative activity in untransformed fibroblasts (figs. S1E and S2E). Thus, TAK-931 may be expected to exhibit fewer toxic side effects in normal tissues, especially in nonproliferating normal tissues, compared with conventional RS-inducing chemotherapeutic drugs, thereby enhancing the therapeutic potential of TAK-931. In addition, TAK-931 exhibited a unique efficacy spectrum, suggesting that TAK-931 may represent a new class of cancer therapeutic. Several small-molecule CDC7 inhibitors have been, or are being, evaluated in clinical or preclinical studies, including PHA767491, XL413, LY3177833, MSK-777, RXDX-103, SRA141, and TAK-931 (37). Accumulating clinical and preclinical data from these studies will help to determine the therapeutic potential of CDC7 inhibitors as anticancer drugs.
TAK-931 was shown to exhibit a unique antiproliferative mechanism of action in cancer cells. TAK-931 treatment (≥24 hours) was found to cause premature centrosome separation or overduplication. This led to chromosome missegregation and irreversible inhibition of proliferation, which is a key biological event involved in the irreversible antiproliferative effects of TAK-931. Similar to DNA replication, centrosome duplication should be strictly regulated and occurs only once per cell cycle to avoid chromosomal instability through multipolar spindle formation (38). Although the detailed mechanism is still not fully understood, recent studies have reported that DNA replication components, such as ORC1, MCM5, geminin, and CDC6, are also involved in centrosome duplication, suggesting that there is cross-talk between DNA replication and centrosome duplication through these shared molecules in the regulatory networks (39–44). In addition to these replication components, CDC7 kinase activity could be involved in regulating both centrosome duplication and DNA replication.
Identification of predictive biomarkers for disease indications and/or patient selection strategies is important for molecularly targeted therapies. The large-scale cell panel studies presented herein revealed that, although TAK-931 sensitivity is not correlated with pathological classification, proliferative rate, or CDC7/DBF4 expression levels, RAS-mutant cancer cell lines are more sensitive to TAK-931 than RAS–wild-type cell lines. Given that TAK-931 induced RS in KRAS-mutant cells to a greater degree than in KRAS–wild-type cells (Fig. 5, D and E), the constitutively activated mitogenic signaling of KRAS may produce synthetic lethality with TAK-931–induced RS in cancer cells. In recent studies, large-scale RNA interference screening of 7837 genes in 398 cancer cell lines demonstrated that the network involved in CDC7 knockdown is directly linked to that involved in KRAS knockdown (fig. S8, A and B) (45). These loss-of-function studies also suggest that cancer vulnerability against the KRAS pathway is closely associated with factors against the CDC7 pathway. These findings also support the hypothesis that the CDC7 pathway is a potential target for therapies to treat KRAS-driven cancers. However, as the functional interaction between the KRAS and CDC7 pathways remains unclear, additional studies are needed to better understand the molecular mechanisms of how these pathways may interact.
Although our preclinical findings suggest that mutated RAS is a target for TAK-931, several caveats should be considered. First, although statistically significant sensitivity differences were observed between the RAS-mutant and RAS–wild-type cancer cells in our preclinical models, classification by RAS mutation alone may not provide a clear cutoff value to separate sensitive and resistant cancers. Second, the RAS hypothesis appears to be context dependent in cancer types. Although TAK-931 exhibited more potent antitumor activity in the KRAS-mutant versus KRAS–wild-type pancreatic PDX models, the preclinical findings in colorectal, lung, and ovarian PDXs did not show significant differences in antitumor efficacy between the KRAS–wild-type and KRAS-mutant models. Third, the contribution of other cancer-associated RS inducers to TAK-931 sensitivity is unclear; these include MYC amplification, E2F activation, cyclin E overexpression, RB1 mutation, p53 mutation, and p16 loss (6). Fourth, there is no clinically relevant methodology established to detect and monitor spontaneous RS in primary tumors, including RAS- or any other oncogene-mediated RS. Further mechanistic analyses are needed to define patient and/or indication selection biomarkers that are also involved in TAK-931 sensitivity in cancer.
In conclusion, development of the CDC7-specific inhibitor TAK-931 has been described, and we have demonstrated its potent antitumor activity in multiple preclinical models. Our mechanistic analysis provides further insights into the molecular mechanisms of cancer cell elimination arising from TAK-931–induced RS. These findings indicate the therapeutic potential of TAK-931 as a next-generation anticancer drug. TAK-931 is currently being evaluated in clinical trials (NCT02699749 and NCT03261947).
MATERIALS AND METHODS
Compounds
TAK-931 was synthesized by Takeda Pharmaceutical Company Ltd. PHA767491 (14) was synthesized by KNC Laboratories Co. Ltd. (Kobe, Japan). VE-821 and aphidicolin were purchased from Sigma-Aldrich and Wako Pure Chemical Corporation, respectively.
Cell growth, cell viability, and caspase-3/7 assays
The cell growth and caspase-3/7 assays were performed as described previously (35). Cell growth was evaluated by intracellular ATP concentrations using the CellTiter-Glo luminescent cell viability assay (Promega Corp., Madison, WI). Cell viability was evaluated by nucleic acid stain using the CyQUANT Direct Cell Proliferation Assay kit (Thermo Fisher Scientific Inc., Waltham, MA). Caspase-3/7 activity was evaluated using a Caspase-Glo 3/7 luminescent assay (Promega). Absorbance and luminescence were measured using a microplate reader.
Immunofluorescence assay
The immunofluorescence assay was performed as described previously (35). HeLa cells stably expressing RFP–centrin-2 were fixed for 15 min with 4% paraformaldehyde in phosphate-buffered saline (PBS), followed by permeabilization for 5 min with Triton X-100–containing buffer. The antibody of anti–γ-tubulin (T9026, Sigma-Aldrich) was used at a concentration of 1 to 2 μg/ml for immunofluorescence assays. Images were captured with an Axiovert 200M microscope (Carl Zeiss) fitted with a Plan-Apochromat 100× oil lens.
Immunoblotting
Immunoblotting was performed as described previously (35). The following antibodies were used at a concentration of 0.1 to 0.5 μg/ml: anti-pMCM2 (3378-1; Epitomics Inc.), anti-MCM2 (sc-9839; Santa Cruz Biotechnology), anti–pPOL II (04-1571; Millipore), anti–POL II (05-952; Millipore), anti-Lamin B1 (ab16048; Abcam), anti-FANCD2 (sc-20022; Santa Cruz Biotechnology), anti-pCDC6 (ab76422; Abcam), anti-CDC6 (ab109315; Abcam), pChk1 (#2348; Cell Signaling Technology), anti-Chk1 (#2345; Cell Signaling Technology), anti-pCDK1 (#9111; Cell Signaling Technology), anti-CDK1 (sc-954; Santa Cruz Biotechnology), anti-gH2AX (#2577; Cell Signaling Technology), anti-PARP1 (#9542; Cell Signaling Technology), anti–cyclin B1 (sc-752; Santa Cruz Biotechnology), anti-CDC7 (sc-56274; Santa Cruz Biotechnology), anti-DBF4 (ab124707; Abcam), and anti-GAPDH (MAB374; Chemicon). Immunoblotted proteins were visualized by chemiluminescence.
FACS analysis
Cells were fixed with 70% ethanol and then incubated for 30 min in PBS containing 2% fetal bovine serum, ribonuclease A (100 μg/ml; Sigma-Aldrich), and Alexa Fluor 488–conjugated pHH3 antibodies (1 μg/ml; 1:50 dilution; cat. #3465, Cell Signaling Technology, Danvers, MA). For BrdU incorporation assay, the fixed cells were incubated for 30 min in PBS containing 1.5 N HCl and 0.5% Triton X-100, followed by incubation with fluorescein isothiocyanate–conjugated BrdU antibodies (1:5 dilution; cat. #556028, BD Biosciences, Franklin Lakes, NJ). After washing, the cells were incubated in propidium iodide (50 μg/ml; Sigma-Aldrich). Ten thousand cells were analyzed using the FACSCalibur flow cytometer (Becton Dickinson, Franklin Lakes, NJ).
Cell panel studies
Cell proliferation assays for TAK-931 in 246 cell lines were carried out by Cellular Services at Ricerca Biosciences LLC using a multiplexed cytotoxicity assay. Briefly, cells were seeded into 384-well plates and incubated in RPMI 1640 including 10% fetal bovine serum. TAK-931 was added 24 hours after cell seeding. After a 72-hour incubation, cells were fixed and stained with nuclear dye and fluorescently labeled pHH3 to allow visualization of nuclei and mitotic cells. TAK-931 was serially diluted 3.16-fold and assayed over 10 concentrations. Automated fluorescence microscopy was performed using a GE Healthcare IN Cell Analyzer 1000, and images were collected with a 4× objective. Mutation data in each cancer cell line for BRAF, KRAS, NRAS, PTEN, RB1, and TP53 were obtained from the database of the Cancer Cell Line Encyclopedia (www.broadinstitute.org/ccle/home). Statistical analyses were performed on GI50 values of TAK-931 using Student’s t tests between mutant cell lines and nonmutant cell lines for each indicated gene. Differences were considered significant at P ≤ 0.05.
PK, PD, and efficacy studies in COLO205 xenograft models
COLO205 cells (3 × 10⁶ to 5 × 10⁶ cells per mouse) were subcutaneously xenografted into BALB/c nude mice (7 weeks old, female). TAK-931 suspended in methylcellulose aqueous solution was orally administered to xenografted mice with tumor volumes of 150 to 400 mm3 at the indicated doses. After a single administration, tumors and plasma were collected at the indicated time points for the measurement of drug concentrations by liquid chromatography–tandem MS (LC-MS/MS). The pMCM2 levels in the tumors at the indicated time points were detected by immunoblotting or immunohistochemistry.
For efficacy studies, the mice bearing tumors (100 to 250 mm3) were selected and randomly categorized into vehicle and TAK-931 groups (five mice per group). The xenografted mice were orally administered TAK-931 at the indicated regimens.
T/C (%) (or %T/C) was calculated using the following formula
All in vivo procedures were performed in accordance with the protocols approved by the Takeda Experimental Animal Care and Use Committee (experimental protocol number: 00004407).
Antitumor efficacy studies in PDX models
The antitumor efficacy studies for TAK-931 in 93 PDX models (HuPrime models) were carried out by Hutrial Services at Crown Bioscience Inc. The PDX tumor fragments at 2 to 3 mm in diameter were subcutaneously xenografted into BALB/c nude mice. The PDX-inoculated mice were selected and randomly categorized into vehicle and TAK-931 groups (three mice per group) when the mean tumor size reached approximately 200 to 250 mm3. The PDX-inoculated mice were orally administered TAK-931 at 60 mg/kg, bid, 3 days on/4 days off, for the indicated cycles.
Antitumor efficacy studies for TAK-931 were carried out in two pancreatic PDX models, PHTX-249Pa and PHTXM-97Pa, at Shanghai Medicilon Inc. (Shanghai, China). PDX tumor fragments of 2 to 3 mm in diameter were subcutaneously xenografted into BALB/c nude mice. The PDX-inoculated mice were selected and randomly categorized into vehicle and TAK-931 groups (six to eight mice per group) when the mean tumor size reached approximately 200 to 250 mm3. The PDX-inoculated mice were orally administered TAK-931 at the indicated dosing schedules for 21 days.
TGI (%) (or %TGI) was calculated using the following formula
Tumor growth/day was calculated using the following formula
Kaplan-Meier survival analysis was performed using an endpoint tumor volume of 600 mm3 as a surrogate for mortality. The log-rank test was used for the comparisons of survival between the vehicle- and TAK-931–treated groups.
The protocol and any amendments or procedures involving the care and use of animals in this study were reviewed and approved by the Institutional Animal Care and Use Committee of Crown Bioscience Inc. prior to study initiation. The care and use of animals were conducted in accordance with the regulations of the Association for Assessment and Accreditation of Laboratory Animal Care.
Statistical analysis
Parametric statistical analysis by Student’s t test was used for the comparison of in vitro antiproliferation and in vivo antitumor efficacy data, if both normal distribution and variance equality of the sample data were verified by Shapiro-Wilk normality and Gaussian distribution tests, respectively. If either normal distribution or variance equality was not determined, nonparametric statistical analysis by Wilcoxon-Mann-Whitney test was used. Statistical analysis was performed by GraphPad Prism (GraphPad Software Inc., San Diego, CA) or R version 3.3.0, and differences were considered significant at P < 0.05.
CDC7 enzyme assay
Full-length CDC7 coexpressed with full-length DBF4 was purchased from Carna Biosciences Inc. (Chuo-ku, Kobe, Japan). The enzyme activity of the CDC7/DBF4 complex was detected by the homogeneous time-resolved fluorescence method, Transcreener ADP Assay (Cisbio Inc., Bedford, MA). The enzyme reaction was performed in a kinase buffer [20 mM Hepes (pH 7.5), 10 mM magnesium acetate, and 1 mM dithiothreitol] supplemented with 1.0 μM ATP, MCM2 (10 μg/ml), and CDC7/DBF4 (0.1 μg/ml). Before initiation of the enzymatic reaction, TAK-931 and CDC7/DBF4 were preincubated for 10 min. The enzymatic reaction was started by the addition of ATP and incubated for 90 min at room temperature.
For the time-dependent inhibition assay, an optimized method of enzymatic reaction in its linear range was used. The enzyme reactions were performed with CDC7/DBF4 protein (0.25 μg/ml) in kinase buffer containing 1.0 μM (Km) or 50 μM (×50 Km) ATP. Prior to the addition of ATP, TAK-931 and CDC7/DBF4 were preincubated for 0 or 60 min. The enzymatic reaction was allowed to proceed for 20 min at room temperature.
Free ADP produced by ATP hydrolysis was detected by Eu3+ cryptate–labeled anti-ADP monoclonal antibody competitively with d2-labeled ADP, and the amount was measured. The time-resolved fluorescence resonance energy transfer (TR-FRET) signal was measured using EnVision (PerkinElmer Life Sciences Inc., Waltham, MA) at an excitation wavelength of 320 nm and an emission wavelength of 615 nm for the donor, or 665 nm for the acceptor. The inhibitory rate (%) of the test compound against CDC7 was calculated using the following formula
The count of the CDC7/DBF4 reaction mixture under compound-free conditions was taken as the control, and the count under compound-free and CDC7/DBF4-free conditions was taken as the blank. Curve fitting and calculation of IC50 values were performed with the program XLfit, Version 5 (ID Business Solutions Ltd., Guildford, Surrey, UK).
Cell cycle synchronization
For cell cycle synchronization in the G1-S phase, a dT block was prepared. Cells were treated with 2 mM thymidine (Sigma-Aldrich, St. Louis, MO) for 16 hours (first block), followed by incubation in thymidine-free medium for 8 hours. Then, the cells were treated again with 2 mM thymidine for 16 hours (second block). The cells were collected at the indicated time points after release from the second block.
DNA fiber assay
The DNA fiber assay was carried out by EasyComb Services at Genomic Vision (Bagneux, France). HeLa cells treated with or without TAK-931 were sequentially incubated with 5-chloro-2′-deoxyuridine (CldU) and 5-iodo-2′-deoxyuridine (IdU) and then embedded in agarose plugs using FiberPrep DNA extraction kit (Genomic Vision). The samples, with combed and labeled DNA, were scanned on the high-end FiberVision scanner platform. Visualization analysis was performed with FiberStudio.
PhosphoScout analysis
The phosphoproteomics analysis was performed by the PhosphoScout Service at Evotec AG (Munich, Germany).
1) Cell culture, inhibitor treatment, and cell lysis
All SILAC labeling and compound treatment steps were performed according to the detailed instructions from Evotec Munich. In initial tests, cell propagation and splitting schemes for two SILAC medium formulations (normal proline and high proline) were evaluated to ensure optimal SILAC incorporation and control for arginine-to-proline conversion. Moreover, TAK-931 treatment experiments were carried out in SILAC-labeled cells to verify optimal cellular responses upon compound treatment under SILAC conditions.
2) Mass spectrometric sample preparation
The cell lysates were reduced with dithiothreitol, alkylated with iodoacetamide, and digested in-solution with endoproteinase Lys-C (Wako) and trypsin (Promega) as reported previously (46). Tryptic peptides were then desalted using reverse-phase 500-mg C18 SepPak cartridges (Waters) and fractionated by SCX chromatography [250 × 9.4–mm polySULFOETHYL A column, 200-Å pore size, 5-μm particle size (PolyLC), operated with ÄKTA explorer system; GE Healthcare] as described previously (47). The resulting 12 peptide samples were desalted using reverse-phase 100-mg C18 SepPak cartridges (Waters) before phosphopeptide enrichment with immobilized metal affinity chromatography in two successive enrichment steps, as described previously (47). The resulting 24 samples per experiment were subjected to LC-MS/MS analysis.
3) Mass spectrometric analysis
Phosphopeptide-enriched samples were loaded onto a reverse-phase analytical column (packed in-house with C18 beads), resolved by an acetonitrile gradient using a nanoflow high-performance liquid chromatography system, and directly electrosprayed via a nanoelectrospray ion source into a quadrupole Orbitrap (Q-Exactive) mass spectrometer (Thermo Fisher Scientific) (46). The Q-Exactive mass spectrometer was operated in a data-dependent acquisition mode to automatically switch between full scans at a resolution of R = 70.000 [at mass/charge ration (m/z) = 200] with a target value of 1 × 10⁶ counts (maximum injection time = 30 ms). The higher-energy collisional dissociation (HCD) fragmentation spectra (MS/MS mode) of the 12 most abundant peptide ions were acquired at a resolution of R = 35.000 (at m/z = 200) with a target value of 1 × 10⁵ counts (maximum injection time = 120 ms) (48).
4) Data processing
All raw files acquired in this study were collectively processed with the MaxQuant software suite (version 1.3.5.6) for peptide and protein identification and quantification using a human UniProt database (version 09 2012). Carbamidomethylation of cysteine was set as a fixed modification; oxidation of methionine and N-terminal acetylation and phosphorylation of serine, threonine, and tyrosine were set as variable modifications. The minimum required peptide length was six amino acids, and up to two missed cleavages and three labeled amino acids were allowed. The FDR threshold was set at 0.01 for both protein and peptide identification, and a posterior error probability ≤0.1 for each peptide-to-spectral match was required. The match between runs option was enabled for a time window of 1 min.
5) Statistical and bioinformatics data analysis
The resulting list of phosphosites exported from the MaxQuant software was filtered for class I sites (sites that could be localized with high confidence) and used for all subsequent statistical analyses. Significantly regulated class I phosphosites quantified in at least two of three replicate experiments were identified by the mean rank test using an estimated FDR of 5%. Enrichment analyses of GO CC categories and KEGG (Kyoto Encyclopedia of Genes and Genomes) pathways were performed for phosphoproteins that were regulated by inhibitor treatment (i.e., significantly regulated phosphosites were identified by the mean rank test), and the results were compared with all phosphoproteins harboring quantified phosphosites by nonconditional hypergeometric Fisher’s exact test. To account for multiple hypothesis testing, FDR correction (FDR = 5%) according to Benjamini-Hochberg was performed. For network visualization, a z score was calculated for all phosphoproteins having quantified class I phosphosites in two or more experiments, and interactions were analyzed with SubExtractor as described previously (34). The resulting network was visualized using the Cytoscape software.
Kinase selectivity assays
The inhibitory activity of TAK-931 at 1.0 μM against 317 assays of 308 kinases was measured using the SelectScreen Kinase Profiling Service by Invitrogen (Madison, WI), which includes Z′-LYTE assay, Adapta assay, and LanthaScreen Eu kinase binding assay.
1) Z′-LYTE assay format
The Z′-LYTE biochemical assay is a fluorescence-based, coupled-enzyme format (Invitrogen Corp.), which is based on the differential sensitivity of phosphorylated and nonphosphorylated peptides to proteolytic cleavage. The peptide substrate was labeled with two fluorophores—one at each end—that make up a FRET pair. In the primary reaction, the kinase transfers the γ-phosphate of ATP to a single tyrosine, serine, or threonine residue in a synthetic FRET peptide. In the secondary reaction, a site-specific protease recognizes and cleaves nonphosphorylated FRET peptides. Phosphorylation of FRET peptides suppresses cleavage by the development reagent. The cleavage disrupts the FRET between the donor (i.e., coumarin) and acceptor (i.e., fluorescein) fluorophores on the FRET peptide, whereas uncleaved, phosphorylated FRET peptides maintain FRET.
A ratiometric method, which calculated the ratio (the emission ratio) of donor emission (coumarin at 445 to 460 nm) to acceptor emission (fluorescein at 520 to 535 nm) after excitation of the donor fluorophore at 400 nm, was used to quantitate the reaction progress. The extent of phosphorylation of the FRET peptide can be calculated from the emission ratio. The emission ratio is low if the FRET peptide is phosphorylated (i.e., no kinase inhibition) and is high if the FRET peptide is nonphosphorylated (i.e., kinase inhibition).
Enzymes were of human origin unless indicated otherwise. Kinase activities were measured at the indicated ATP concentration for direct format assays and at an ATP concentration of 100 μM for cascade format assays. Kinase-specific assays listed under the Direct Format section included, for example, ABL1 T315I, AKT3 (PKB gamma), CAMK1D [CaMK I (calcium/calmodulin-dependent protein kinase I) delta], CDK2/cyclin A, epidermal growth factor receptor (ErbB1), glycogen synthase kinase 3B (GSK3B) (GSK3 beta), INSR, Janus kinase 3 (JAK3), mitogen-activated protein kinase 14 (MAPK14) (p38 alpha), MET (cMet), PDGFRB, (PDGFR beta), PDK1, PLK3, PRKCA (PKC alpha), SRC, SYK, and TEK (Tie2). Kinase-specific assays of the Cascade Format included MAP2K1 (MEK1) and RAF1 (cRaf) Y340D Y341D.
2) Adapta assay format
The Adapta universal kinase assay is a homogenous, fluorescence-based immunoassay for the detection of ADP. In contrast to ATP depletion assays, the Adapta assay is extremely sensitive to ADP formation such that majority of the signal change occurs in the first 10 to 20% conversion of ATP to ADP. This makes the Adapta universal kinase assay ideally suited for use with low activity kinases. The assay itself can be divided into two phases: a kinase reaction phase and an ADP detection phase. In the kinase reaction phase, all components required for the kinase reaction were added to the well, and the reaction was incubated for 60 min. After the reaction, a detection solution consisting of an Eu-labeled anti-ADP antibody, an Alexa Fluor 647–labeled ADP tracer, and EDTA (to stop the kinase reaction) was added to the assay well. ADP formed by the kinase reaction (in the absence of an inhibitor) displaces the Alexa Fluor 647–labeled ADP tracer from the antibody, resulting in a decrease in the TR-FRET signal. In the presence of an inhibitor, the amount of ADP formed by the kinase reaction was reduced, and the resulting intact antibody-tracer interaction resulted in a high TR-FRET signal.
ADP formation was determined by calculating the emission ratio from the assay well. The emission ratio was calculated by dividing the intensity of the tracer (acceptor) emission by the intensity of the Eu (donor) emission at 615 nm as shown in the following equation
Emission ratio = Alexa Fluor 647 emission (665 nm)/Europium emission (615 nm).
Enzymes were of human origin unless indicated otherwise. Kinase-specific assays listed under the Adapta assay format include CAMK1 (CaMK1), CDK7/cyclin H/MNAT1, CDK9/cyclin T1, CHUK (IKK alpha), DAPK1, GSG2 (Haspin), IRAK1, LRRK2, LRRK2 G2019S, NUAK1 (ARK5), PI4KA (PI4K alpha), PI4KB (PI4K beta), PIK3C2A (PI3K-C2 alpha), PIK3C2B (PI3K-C2 beta), PIK3C3 (hVPS34), PIK3CA/PIK3R1 (p110 alpha/p85 alpha), PIK3CD/PIK3R1 (p110 delta/p85 alpha), PIK3CG (p110 gamma), and SPHK1.
3) LanthaScreen Eu kinase binding assay format
Binding of an Alexa Fluor conjugate or “tracer” to a kinase was detected by the addition of an Eu-labeled anti-tag antibody. Binding of the tracer and antibody to a kinase resulted in a high degree of FRET, whereas displacement of the tracer with a kinase inhibitor resulted in a loss of FRET. Invitrogen’s kinase tracers are based on ATP-competitive kinase inhibitors, making them suitable for detection of any compounds that bind to the ATP site. Inhibitors that bind the ATP site include both type I kinase inhibitors, which bind solely to the ATP site, and type II inhibitors, which bind to both the ATP site and a second site often referred to as the allosteric site.
Kinases were of human origin unless indicated otherwise. Kinase-specific assays listed under the LanthaScreen Eu kinase binding assay format include ACVR1 (ALK2), ACVR2B, BMPR1A (ALK3), BRAF, BRAF V599E, CAMKK1 (CAMKKA), CAMKK2 (CaMKK beta), CDK8/cyclin C, CDK9/cyclin K, CLK4, DDR1, DDR2, DMPK, EPHA3, EPHA7, KIT V654A, LIMK1, LIMK2, MAP2K1 (MEK1), MAP2K1 (MEK1) S218D S222D, MAP2K2 (MEK2), MAP2K3 (MEK3), MAP2K6 (MKK6), MAP2K6 (MKK6) S207E T211E, MAP3K10 (MLK2), MAP3K11 (MLK3), MAP3K14 (NIK), MAP3K2 (MEKK2), MAP3K3 (MEKK3), MAP3K5 (ASK1), MAP3K7/MAP3K7IP1 (TAK1-TAB1), APK10 (JNK3), MAPK8 (JNK1), MAPK9 (JNK2), MKNK2 (MNK2), MLCK (MLCK2), MYLK (MLCK), NLK, RAF1 (cRAF) Y340D Y341D, RIPK2, SLK, STK16 (PKL12), STK17A (DRAK1), STK33, TAOK3 (JIK), TEC, TGFBR1 (ALK5), TNK2 (ACK), TTK, WEE1, WNK2, and ZAK.
Immunohistochemistry
Endogenous peroxidases were quenched by the addition of 3% H2O2. Antigen retrieval was performed by heating the samples in 10 mM citrate buffer (pH 6.0). The sections were incubated with anti-pMCM2 (3378-1, Epitomics Inc.). The avidin-biotin-peroxidase complex system (Histofine Simple Stain Mouse MAX PO, Nichirei Bioscience) was used for color development with diaminobenzidine tetrahydrochloride.
Electron microscopy
Electron microscopy was performed by Tokai Electron Microscopy Inc. The samples were fixed with 2% paraformaldehyde, 2% glutaraldehyde in 0.1 M phosphate buffer (pH 7.4), followed by postfixation with 2% osmium tetroxide. The fixed samples were dehydrated through a series of ethanol concentrations (50, 70, 90, and 100%) and then transferred to a resin (Quetol-812; Nisshin EM Co., Tokyo, Japan) and polymerized at 60°C.
The blocks were ultrathin sectioned at 70 nm using an ultramicrotome (Ultracut UCT; Leica) and stained with 2% uranyl acetate followed by lead stain solution (Sigma-Aldrich). The samples were observed by a transmission electron microscope (JEM-1400Plus; JEOL Ltd.) at an acceleration voltage of 80 kV. Digital images (2048 × 2048 pixels) were captured with a charge-coupled device camera (VRLRTA; Olympus Soft Imaging Solution GmbH).
Supplementary Material
Acknowledgments
We thank the following colleagues at Takeda Oncology for valuable comments on the manuscript: K. Kannan, I. Garcia Ribas, J. Pierce, K. Galvin, D. Huszar, V. Schmelmer, C. Claiborne, H. Miyake, Y Ishii, E. Lightcap, J. Ahn, M. Kuttab, and A. Nakamura. We also thank S.-i. Kageyama and S. Kobayashi at the National Cancer Center for valuable comments on the manuscript. Funding: This research was supported by Takeda Pharmaceutical Company Ltd. Author contributions: K.I., T.N., H.N., and A.O. conceived and designed the experiments. K.I., T.N., M.O., J.Y., K.B., Y.Y., S.E., S.S., R.H., and A.O. performed the pharmacological experiments. R.D., S.N., and K.Y. performed the bioinformatics analysis. K.I., M.G., and K.Y. performed the proteomics analysis. T.M., M.H., Y.O., T.I., N.C., and O.K. designed and synthesized the chemical compound. N.U. performed the enzymatic assays. A.K. and T.T. performed the PK analysis. K.I., T.N., K.Y., H.N., and A.O. wrote and/or edited the manuscript. All authors critically revised the content and approved the final version for submission. Competing interests: All authors are/were employees of Takeda Pharmaceutical Company Ltd. T.M., O.K., Y.O., and M.H. are inventors on a national phase patent related to this work (no. WO2011/102399, filed 16 February 2011). T.N., K.I., R.D., and A.O. are inventors on another international phase patent related to this work (no. WO2018/158898, filed 1 March 2017). The authors declare that they have no other competing interests. Data and materials availability: All data needed to evaluate the conclusions in the paper are present in the paper and/or the Supplementary Materials. Additional data related to this paper may be requested from the authors. Data and materials will be provided by Takeda pending scientific review and a completed material transfer agreement. Request for the data and materials should be submitted to A.O. as point of contact.
SUPPLEMENTARY MATERIALS
Supplementary material for this article is available at http://advances.sciencemag.org/cgi/content/full/5/5/eaav3660/DC1
Fig. S1. In vitro pharmacological profile of TAK-931.
Fig. S2. Effect of TAK-931 on DNA replication, RS, and DDR.
Fig. S3. Irreversible antiproliferative effects of TAK-931 and mitotic aberrations.
Fig. S4. Large-scale in vitro cell panel studies of TAK-931.
Fig. S5. Effect of KRAS mutation on TAK-931 antiproliferative activity, showing unique antiproliferative spectrum in cancer cells.
Fig. S6. PK/PD/efficacy study of TAK-931 in tumor xenograft mouse model.
Fig. S7. Antitumor efficacy of TAK-931 in tumor xenograft mouse model.
Fig. S8. Pathway network between CDC7 and KRAS knockdown.
Table S1. Phosphorylation sites modulated after 4 and 24 hours of TAK-931 treatment in COLO205 cells.
Table S2. %T/C values of antitumor efficacy studies in colorectal, lung, ovarian, and pancreatic PDXs.
REFERENCES AND NOTES
- 1.Hanahan D., Weinberg R. A., Hallmarks of cancer: the next generation. Cell 144, 646–674 (2011). [DOI] [PubMed] [Google Scholar]
- 2.McGranahan N., Swanton C., Clonal heterogeneity and tumor evolution: Past, present, and the future. Cell 168, 613–628 (2017). [DOI] [PubMed] [Google Scholar]
- 3.Burrell R. A., McGranahan N., Bartek J., Swanton C., The causes and consequences of genetic heterogeneity in cancer evolution. Nature 501, 338–345 (2013). [DOI] [PubMed] [Google Scholar]
- 4.Jackson S. P., Bartek J., The DNA-damage response in human biology and disease. Nature 461, 1071–1078 (2009). [DOI] [PMC free article] [PubMed] [Google Scholar]
- 5.Kotsantis P., Silva L. M., Irmscher S., Jones R. M., Folkes L., Gromak N., Petermann E., Increased global transcription activity as a mechanism of replication stress in cancer. Nat. Commun. 7, 13087 (2016). [DOI] [PMC free article] [PubMed] [Google Scholar]
- 6.Dobbelstein M., Sørensen C. S., Exploiting replicative stress to treat cancer. Nat. Rev. Drug Discov. 14, 405–423 (2015). [DOI] [PubMed] [Google Scholar]
- 7.Zeman M. K., Cimprich K. A., Causes and consequences of replication stress. Nat. Cell Biol. 16, 2–9 (2014). [DOI] [PMC free article] [PubMed] [Google Scholar]
- 8.Gorgoulis V. G., Vassiliou L.-V. F., Karakaidos P., Zacharatos P., Kotsinas A., Liloglou T., Venere M., DiTullio R. A. Jr., Kastrinakis N. G., Levy B., Kletsas D., Yoneta A., Herlyn M., Kittas C., Halazonetis T. D., Activation of the DNA damage checkpoint and genomic instability in human precancerous lesions. Nature 434, 907–913 (2005). [DOI] [PubMed] [Google Scholar]
- 9.Halazonetis T. D., Gorgoulis V. G., Bartek J., An oncogene-induced DNA damage model for cancer development. Science 319, 1352–1355 (2008). [DOI] [PubMed] [Google Scholar]
- 10.Bartkova J., Hořejší Z., Koed K., Krämer A., Tort F., Zieger K., Guldberg P., Sehested M., Nesland J. M., Lukas C., Ørntoft T., Lukas J., Bartek J., DNA damage response as a candidate anti-cancer barrier in early human tumorigenesis. Nature 434, 864–870 (2005). [DOI] [PubMed] [Google Scholar]
- 11.Kopper F., Bierwirth C., Schön M., Kunze M., Elvers I., Kranz D., Saini P., Menon M. B., Walter D., Sørensen C. S., Gaestel M., Helleday T., Schön M. P., Dobbelstein M., Damage-induced DNA replication stalling relies on MAPK-activated protein kinase 2 activity. Proc. Natl. Acad. Sci. U.S.A. 110, 16856–16861 (2013). [DOI] [PMC free article] [PubMed] [Google Scholar]
- 12.Merrick C. J., Jackson D., Diffley J. F. X., Visualization of altered replication dynamics after DNA damage in human cells. J. Biol. Chem. 279, 20067–20075 (2004). [DOI] [PubMed] [Google Scholar]
- 13.Koltun E. S., Tsuhako A. L., Brown D. S., Aay N., Arcalas A., Chan V., Du H., Engst S., Ferguson K., Franzini M., Galan A., Holst C. R., Huang P., Kane B., Kim M. H., Li J., Markby D., Mohan M., Noson K., Plonowski A., Richards S. J., Robertson S., Shaw K., Stott G., Stout T. J., Young J., Yu P., Zaharia C. A., Zhang W., Zhou P., Nuss J. M., Xu W., Kearney P. C., Discovery of XL413, a potent and selective CDC7 inhibitor. Bioorg. Med. Chem. Lett. 22, 3727–3731 (2012). [DOI] [PubMed] [Google Scholar]
- 14.Montagnoli A., Valsasina B., Croci V., Menichincheri M., Rainoldi S., Marchesi V., Tibolla M., Tenca P., Brotherton D., Albanese C., Patton V., Alzani R., Ciavolella A., Sola F., Molinari A., Volpi D., Avanzi N., Fiorentini F., Cattoni M., Healy S., Ballinari D., Pesenti E., Isacchi A., Moll J., Bensimon A., Vanotti E., Santocanale C., A Cdc7 kinase inhibitor restricts initiation of DNA replication and has antitumor activity. Nat. Chem. Biol. 4, 357–365 (2008). [DOI] [PubMed] [Google Scholar]
- 15.Harrington P. E., Bourbeau M. P., Fotsch C., Frohn M., Pickrell A. J., Reichelt A., Sham K., Siegmund A. C., Bailis J. M., Bush T., Escobar S., Hickman D., Heller S., Hsieh F., Orf J. N., Rong M., Miguel T. S., Tan H., Zalameda L., Allen J. G., The optimization of aminooxadiazoles as orally active inhibitors of Cdc7. Bioorg. Med. Chem. Lett. 23, 6396–6400 (2013). [DOI] [PubMed] [Google Scholar]
- 16.Reichelt A., Bailis J. M., Bartberger M. D., Yao G., Shu H., Kaller M. R., Allen J. G., Weidner M. F., Keegan K. S., Dao J. H., Synthesis and structure-activity relationship of trisubstituted thiazoles as Cdc7 kinase inhibitors. Eur. J. Med. Chem. 80, 364–382 (2014). [DOI] [PubMed] [Google Scholar]
- 17.Kurasawa O., Oguro Y., Miyazaki T., Homma M., Mori K., Iwai K., Hara H., Skene R., Hoffman I., Ohashi A., Yoshida S., Ishikawa T., Cho N., Identification of a new class of potent Cdc7 inhibitors designed by putative pharmacophore model: Synthesis and biological evaluation of 2,3-dihydrothieno[3,2-d]pyrimidin-4(1H)-ones. Bioorg. Med. Chem. 25, 2133–2147 (2017). [DOI] [PubMed] [Google Scholar]
- 18.Kurasawa O., Homma M., Oguro Y., Miyazaki T., Mori K., Uchiyama N., Iwai K., Ohashi A., Hara H., Yoshida S., Cho N., 2-Aminomethylthieno[3,2-d]pyrimidin-4(3H)-ones bearing 3-methylpyrazole hinge binding moiety: Highly potent, selective, and time-dependent inhibitors of Cdc7 kinase. Bioorg. Med. Chem. 25, 3658–3670 (2017). [DOI] [PubMed] [Google Scholar]
- 19.Irie T., Asami T., Sawa A., Uno Y., Hanada M., Taniyama C., Funakoshi Y., Masai H., Sawa M., Discovery of novel furanone derivatives as potent Cdc7 kinase inhibitors. Eur. J. Med. Chem. 130, 406–418 (2017). [DOI] [PubMed] [Google Scholar]
- 20.Jiang W., McDonald D., Hope T. J., Hunter T., Mammalian Cdc7-Dbf4 protein kinase complex is essential for initiation of DNA replication. EMBO J. 18, 5703–5713 (1999). [DOI] [PMC free article] [PubMed] [Google Scholar]
- 21.Cho W.-H., Lee Y.-J., Kong S.-I., Hurwitz J., Lee J.-K., CDC7 kinase phosphorylates serine residues adjacent to acidic amino acids in the minichromosome maintenance 2 protein. Proc. Natl. Acad. Sci. U.S.A. 103, 11521–11526 (2006). [DOI] [PMC free article] [PubMed] [Google Scholar]
- 22.Yamada M., Masai H., Bartek J., Regulation and roles of Cdc7 kinase under replication stress. Cell Cycle 13, 1859–1866 (2014). [DOI] [PMC free article] [PubMed] [Google Scholar]
- 23.Kulkarni A. A., Kingsbury S. R., Tudzarova S., Hong H.-K., Loddo M., Rashid M., Rodriguez-Acebes S., Prevost A. T., Ledermann J. A., Stoeber K., Williams G. H., Cdc7 kinase is a predictor of survival and a novel therapeutic target in epithelial ovarian carcinoma. Clin. Cancer Res. 15, 2417–2425 (2009). [DOI] [PubMed] [Google Scholar]
- 24.Montagnoli A., Valsasina B., Brotherton D., Troiani S., Rainoldi S., Tenca P., Molinari A., Santocanale C., Identification of Mcm2 phosphorylation sites by S-phase-regulating kinases. J. Biol. Chem. 281, 10281–10290 (2006). [DOI] [PubMed] [Google Scholar]
- 25.Tsuji T., Ficarro S. B., Jiang W., Essential role of phosphorylation of MCM2 by Cdc7/Dbf4 in the initiation of DNA replication in mammalian cells. Mol. Biol. Cell 17, 4459–4472 (2006). [DOI] [PMC free article] [PubMed] [Google Scholar]
- 26.Yin T., Lallena M. J., Kreklau E. L., Fales K. R., Carballares S., Torrres R., Wishart G. N., Ajamie R. T., Cronier D. M., Iversen P. W., Meier T. I., Foreman R. T., Zeckner D., Sissons S. E., Halstead B. W., Lin A. B., Donoho G. P., Qian Y., Li S., Wu S., Aggarwal A., Ye X. S., Starling J. J., Gaynor R. B., de Dios A., Du J., A novel CDK9 inhibitor shows potent antitumor efficacy in preclinical hematologic tumor models. Mol. Cancer Ther. 13, 1442–1456 (2014). [DOI] [PubMed] [Google Scholar]
- 27.Ohashi A., Ohori M., Iwai K., Nambu T., Miyamoto M., Kawamoto T., Okaniwa M., A Novel Time-Dependent CENP-E Inhibitor with Potent Antitumor Activity. PLOS ONE 10, e0144675 (2015). [DOI] [PMC free article] [PubMed] [Google Scholar]
- 28.Montagnoli A., Tenca P., Sola F., Carpani D., Brotherton D., Albanese C., Santocanale C., Cdc7 inhibition reveals a p53-dependent replication checkpoint that is defective in cancer cells. Cancer Res. 64, 7110–7116 (2004). [DOI] [PubMed] [Google Scholar]
- 29.Petermann E., Woodcock M., Helleday T., Chk1 promotes replication fork progression by controlling replication initiation. Proc. Natl. Acad. Sci. U.S.A. 107, 16090–16095 (2010). [DOI] [PMC free article] [PubMed] [Google Scholar]
- 30.Moiseeva T., Hood B., Schamus S., O’Connor M. J., Conrads T. P., Bakkenist C. J., ATR kinase inhibition induces unscheduled origin firing through a Cdc7-dependent association between GINS and And-1. Nat. Commun. 8, 1392 (2017). [DOI] [PMC free article] [PubMed] [Google Scholar]
- 31.Rainey M. D., Quachthithu H., Gaboriau D., Santocanale C., DNA Replication Dynamics and Cellular Responses to ATP Competitive CDC7 Kinase Inhibitors. ACS Chem. Biol. 12, 1893–1902 (2017). [DOI] [PubMed] [Google Scholar]
- 32.Reaper P. M., Griffiths M. R., Long J. M., Charrier J.-D., MacCormick S., Charlton P. A., Golec J. M. C., Pollard J. R., Selective killing of ATM- or p53-deficient cancer cells through inhibition of ATR. Nat. Chem. Biol. 7, 428–430 (2011). [DOI] [PubMed] [Google Scholar]
- 33.O’Driscoll M., Ruiz-Perez V. L., Woods C. G., Jeggo P. A., Goodship J. A., A splicing mutation affecting expression of ataxia-telangiectasia and Rad3-related protein (ATR) results in Seckel syndrome. Nat. Genet. 33, 497–501 (2003). [DOI] [PubMed] [Google Scholar]
- 34.Klammer M., Godl K., Tebbe A., Schaab C., Identifying differentially regulated subnetworks from phosphoproteomic data. BMC Bioinformatics 11, 351 (2010). [DOI] [PMC free article] [PubMed] [Google Scholar]
- 35.Ohashi A., Ohori M., Iwai K., Nakayama Y., Nambu T., Morishita D., Kawamoto T., Miyamoto M., Hirayama T., Okaniwa M., Banno H., Ishikawa T., Kandori H., Iwata K., Aneuploidy generates proteotoxic stress and DNA damage concurrently with p53-mediated post-mitotic apoptosis in SAC-impaired cells. Nat. Commun. 6, 7668 (2015). [DOI] [PMC free article] [PubMed] [Google Scholar]
- 36.Han R., Yang Y. M., Dietrich J., Luebke A., Mayer-Pröschel M., Noble M., Systemic 5-fluorouracil treatment causes a syndrome of delayed myelin destruction in the central nervous system. J. Biol. 7, 12 (2008). [DOI] [PMC free article] [PubMed] [Google Scholar]
- 37.Montagnoli A., Moll J., Colotta F., Targeting cell division cycle 7 kinase: a new approach for cancer therapy. Clin. Cancer Res. 16, 4503–4508 (2010). [DOI] [PubMed] [Google Scholar]
- 38.Sluder G., Nordberg J. J., The good, the bad and the ugly: the practical consequences of centrosome amplification. Curr. Opin. Cell Biol. 16, 49–54 (2004). [DOI] [PubMed] [Google Scholar]
- 39.Hemerly A. S., Prasanth S. G., Siddiqui K., Stillman B., Orc1 controls centriole and centrosome copy number in human cells. Science 323, 789–793 (2009). [DOI] [PMC free article] [PubMed] [Google Scholar]
- 40.Ferguson R. L., Maller J. L., Cyclin E-dependent localization of MCM5 regulates centrosome duplication. J. Cell Sci. 121, 3224–3232 (2008). [DOI] [PubMed] [Google Scholar]
- 41.Ferguson R. L., Pascreau G., Maller J. L., The cyclin A centrosomal localization sequence recruits MCM5 and Orc1 to regulate centrosome reduplication. J. Cell Sci. 123, 2743–2749 (2010). [DOI] [PMC free article] [PubMed] [Google Scholar]
- 42.Lu F., Lan R., Zhang H., Jiang Q., Zhang C., Geminin is partially localized to the centrosome and plays a role in proper centrosome duplication. Biol. Cell. 101, 273–285 (2009). [DOI] [PMC free article] [PubMed] [Google Scholar]
- 43.Hossain M., Stillman B., Meier-Gorlin syndrome mutations disrupt an Orc1 CDK inhibitory domain and cause centrosome reduplication. Genes Dev. 26, 1797–1810 (2012). [DOI] [PMC free article] [PubMed] [Google Scholar]
- 44.Xu X., Huang S., Zhang B., Huang F., Chi W., Fu J., Wang G., Li S., Jiang Q., Zhang C., DNA replication licensing factor Cdc6 and Plk4 kinase antagonistically regulate centrosome duplication via Sas-6. Nat. Commun. 8, 15164 (2017). [DOI] [PMC free article] [PubMed] [Google Scholar]
- 45.McDonald E. R., III, et al. , Project DRIVE: A compendium of cancer dependencies and synthetic lethal relationships uncovered by large-scale, deep RNAi screening. Cell 170, 577–592.e10 (2017). [DOI] [PubMed] [Google Scholar]
- 46.Daub H., et al. , Kinase-selective enrichment enables quantitative phosphoproteomics of the kinome across the cell cycle. Mol. Cell 31, 438–448 (2008). [DOI] [PubMed] [Google Scholar]
- 47.Villén J., Gygi S. P., The SCX/IMAC enrichment approach for global phosphorylation analysis by mass spectrometry. Nat. Protoc. 3, 1630–1638 (2008). [DOI] [PMC free article] [PubMed] [Google Scholar]
- 48.Kelstrup C. D., Young C., Lavallee R., Nielsen M. L., Olsen J. V., Optimized fast and sensitive acquisition methods for shotgun proteomics on a quadrupole orbitrap mass spectrometer. J. Proteome Res. 11, 3487–3497 (2012). [DOI] [PubMed] [Google Scholar]
Associated Data
This section collects any data citations, data availability statements, or supplementary materials included in this article.
Supplementary Materials
Supplementary material for this article is available at http://advances.sciencemag.org/cgi/content/full/5/5/eaav3660/DC1
Fig. S1. In vitro pharmacological profile of TAK-931.
Fig. S2. Effect of TAK-931 on DNA replication, RS, and DDR.
Fig. S3. Irreversible antiproliferative effects of TAK-931 and mitotic aberrations.
Fig. S4. Large-scale in vitro cell panel studies of TAK-931.
Fig. S5. Effect of KRAS mutation on TAK-931 antiproliferative activity, showing unique antiproliferative spectrum in cancer cells.
Fig. S6. PK/PD/efficacy study of TAK-931 in tumor xenograft mouse model.
Fig. S7. Antitumor efficacy of TAK-931 in tumor xenograft mouse model.
Fig. S8. Pathway network between CDC7 and KRAS knockdown.
Table S1. Phosphorylation sites modulated after 4 and 24 hours of TAK-931 treatment in COLO205 cells.
Table S2. %T/C values of antitumor efficacy studies in colorectal, lung, ovarian, and pancreatic PDXs.