Abstract
Bladder overactivity and incontinence and dysfunction can be mitigated by electrical stimulation of the pudendal nerve applied at the onset of a bladder contraction. Thus, it is important to predict accurately both bladder pressure and the onset of bladder contractions. We propose a novel method for pre- diction of bladder pressure using a time-dependent spectrogram representation of external urethral sphincter electromyographic activity and a least absolute shrinkage and selection operator regression model. There was a statistically significant improvement in prediction of bladder pressure compared to methods based on the firing rate of external urethral sphincter electromyographic activity. This approach enabled prediction of the onset of bladder contractions with 91% specificity and 96% sensitivity and may be suitable for closed-loop control of bladder continence.
Keywords: LASSO, Neural stimulation, Bladder dysfunction, Spectrogram
I. INTRODUCTION
SPINAL cord injury (SCI) or neurological disease can lead to neurogenic detrusor overactivity, urinary incontinence, dysfunctional voiding of the bladder, and bladder-external urethral sphincter dyssynergia. Electrical stimulation can effectively treat various forms of bladder dysfunction [1]–[4]. In particular, applying electrical stimulation at the beginning of a bladder contraction can halt the contraction [5]. The ability to inhibit nascent bladder contractions remains of great interest as an approach to restore bladder continence [5]–[8].
Conditional stimulation, i.e., applying stimulation only at the onset of the bladder contraction, has several potential advantages over continuous stimulation [9]. However, conditional stimulation requires the ability to predict accurately bladder pressure and detect the onset of nascent bladder contractions. Non-invasive inference of bladder pressure [10]–[13] and detection of bladder contraction onset [14]–[17] from recordings of neural or muscular activity are attractive approaches as they do not require interfacing directly with the highly mobile bladder muscle. An in-depth review of algorithms and devices for detecting bladder contractions can be found in [18]. The approach we describe here differs from previous work because we model bladder pressure using a time-dependent spectrogram representation of external urethral sphincter electromyographic activity (EUS EMG) data rather than calculating the firing rate of the EUS EMG. Although previous work has considered a time-frequency representation of bladder pressure recordings [17], [19], time-dependent spectrograms of EUS EMG data have not been used to predict bladder pressure.
Using the spectrogram representation of EMG data, we trained a least absolute shrinkage and selection operator (LASSO) regression model to predict bladder pressure. The LASSO is a sparse regression method that uses a regularized cost function to minimize the sum of the squared errors while simultaneously forcing coefficients in a regression model to zero that are not important for out-of-sample prediction accuracy. Thereby, the LASSO method results in the most parsimonious mapping of the spectrogram frequencies to bladder pressure data. We show that our spectrogram based LASSO regression model is significantly more accurate at predicting bladder pressure from EUS EMG data than a similar model based on firing rate. We use the LASSO model to predict bladder contraction start times with 91% specificity and 96% sensitivity, which is an improvement over methods based on firing rate.
II. MATERIAL AND METHODS
A. Data
The data we used are summarized here and full details are available in [6]. We used a subset of 15 female Wistar rats (235 – 360 g) from a previous study [6] to ensure that all data were collected within one year, and we only used trials in which no electrical stimulation was delivered. All animal care and experimental procedures were reviewed and approved by the Duke University Institutional Animal Care and Use Committee. Rats were anesthetized with urethane (1.2 g/kg sc, supplemented as necessary). Body temperature was maintained at 36–38 C, and heart rate and arterial blood oxygen saturation levels were monitored with a pulse oximeter.
Cystometrogram (CMG) measurements
A catheter was inserted into the bladder lumen and connected to an infusion pump and to a pressure transducer for measuring intravesical pressure (IVP). A custom bipolar paddle electrode was placed between the external urethral sphincter (EUS) and pubic symphysis to record EUS activity [6]. IVP and EUS EMG signals were amplified, filtered, and sampled at 1,000 Hz (IVP) or 20,000 Hz (EUS EMG). The bladder was emptied and CMGs were recorded. A constant fill rate (4–8 ml/hr) was used for each CMG trial until a micturition event was observed (approximately 8–10 minutes), at which time the infusion pump was turned off. The bladder was emptied via the catheter approximately one minute after bladder pressure returned to baseline. Several control CMGs were performed prior to intravesical infusion with a PGE2 solution for 1 hour using a concentration (100 μM) that decreased bladder capacity [20], [21]. The bladder was emptied and CMGs were recorded while filling the bladder with PGE2; we refer to these CMGs as post PGE2 trials. There were between 10–16 total trials per animal and the trial at which PGE2 was administered varied among animals, occurring sometime after trials 4–7.
B. Models for Prediction of Bladder Pressure from EUS EMG
We developed two models for predicting bladder pressure from time-varying covariates extracted from the EUS EMG data, one based on the firing rate and another based on a spectrogram representation.
Firing rate model
As a baseline to compare prediction accuracy, we used the EUS EMG recording to calculate the time-dependent firing rate (spikes/s). A linear regression model was trained to predict bladder pressure from the time-dependent firing rate, a method previously used in [10]. The firing rate was calculated by counting the number of spikes from the EUS EMG data in a 1 second sliding window, updated every 0.25 seconds. Spikes were identified using the PEAKSEEK function in MATLAB, which selects peaks from all local maxima of a time series based on the intrinsic height and location of each peak relative to other peaks. The spike threshold was set at 5 standard deviations from the mean of the EUS EMG signal at baseline, where the baseline was derived from the first 30 seconds of each trial.
Spectrogram model
We calculated a time-dependent spectrogram representation of EUS EMG within each CMG. This spectrogram was calculated in a 0.25 second sliding time window using the SPECTROGRAM function in Matlab, which returns the short-time Fourier transform of a signal. The coefficients of the fast Fourier transform within each window of the EUS EMG signal were used as time-dependent covariates for prediction. We used 375 frequency coefficients between 0 Hz and 1500 Hz. We normalized our spectrogram as:
| (1) |
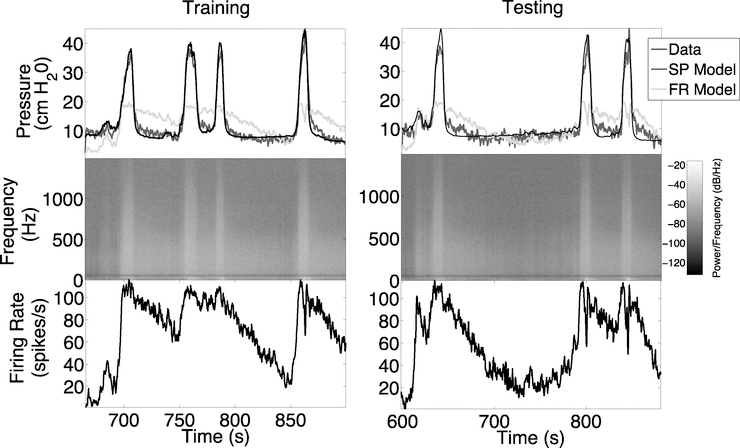
where ps represents the calculated power spectral density, and ε represents machine epsilon added to ensure we do not try to calculate log10(0). An example of the spectrogram representation can be seen in the middle panel of Figure 1.
Fig. 1.
Example of bladder pressure prediction models for rat 1. Top: Training was performed on trial 1 data (left panel) and testing was performed on trial 4 data (right panel). Middle: Spectrogram data used for bladder pressure prediction by the SP model. Spectrogram power is shown on a −log10 scale. Bottom: Firing rate data used for bladder pressure prediction by the FR model.
We trained a LASSO regression model [22], [23] to predict bladder pressure from spectrogram data. Since the spectrogram has many more dimensions (375 frequency coefficients) than the one-dimensional bladder pressure measurement, there is the strong potential for over-fitting. The LASSO method was used to minimize overfitting and maximize generalizability, i.e., out-of-sample prediction accuracy. A LASSO model incorporates regularization to push small coefficients to zero and variable selection to detect important features for prediction. Here, we employ L-1 regularization. Thus, the LASSO model increases prediction accuracy and interpretability over other statistical models. The non-zero coefficients selected by the LASSO represent frequency ranges in the EUS EMG signal that are important for bladder pressure prediction.
Performance metrics
We compared the accuracy of predicting bladder pressure from the LASSO model trained on the 135 spectrogram (SP model) with bladder pressure predictions using the regression model trained with firing rates (FR model). Accuracy was quantified by the root mean squared error (RMSE) and linear regression correlation coefficient (ρ) between predicted bladder pressure and measured bladder pressure. Statistical comparisons between the two methods were performed using a Mann-Whitney U-test with a Bonferroni correction for repeated comparisons to detect whether there were significant differences in RMSE and ρ. For comparison to other recent studies, we also calculated the normalized root mean squared error (NRMSE), which is the RMSE divided by the difference between the maximum and minimum measured bladder pressure [13].
C. Prediction of Bladder Contraction Onset from EUS EMG
The onset of a bladder contraction from bladder pressure data was determined by first searching for bladder pressures levels larger than 20 cmH2O, since the peak of every contraction was above this threshold for all contractions in this data set. Once bladder pressure rose above the 20 cmH2O threshold, the bladder pressure was traced back until the rate of change in bladder pressure decreased by 50% for at least 10 consecutive time points on the time scale of the trained LASSO model, i.e., 2.5 seconds. The consecutive time point criterion was used to avoid instances where the bladder pressure suddenly decreased after the start of a contraction, but then continued to increase 1–2 seconds later. The contraction onset times calculated from bladder pressure data were used as the ground truth comparators for evaluating the accuracy of predictions of contraction onset from the SP model, i.e., from the EUS EMG data alone.
We developed a detection algorithm similar to previous algorithms using only EUS EMG data [15]. First, the LASSO model was used to predict bladder pressure at time t from a time-dependent spectrogram, i.e., PLASSO(t). The LASSO model used for prediction was rat specific and trained on the first post-PGE2 trial. We then used predicted bladder pressure to detect bladder contractions. The detection algorithm had three parameters: a bladder pressure threshold (Pthresh), the number of consecutive points (NP) at which the predicted bladder pressure was above Pthresh, and a threshold for the slope (SL) of the best fit line going through the PLASSO(t) at the most recent 30 time points (7.5 seconds). These parameters were used to evaluate two criteria, whether PLASSO(t) was 1) above a detection threshold and 2) increasing for a significant amount of time. More precisely, a bladder contraction was predicted at time point t if the following conditions held:
1) PLASSO(s)>Pthresh for s=t−1,t−2,…,t−NP
2) The slope of the best-fit line through the points PLASSO(t),…,PLASSO(t−30) was greater than SL.
The three parameters Pthresh, NP, and SL were optimized for each rat using data from the first three post-PGE2 trials and using a cost function based on three factors weighted with the performance objective of accurately predicting bladder contraction onset. The relative magnitude of the coefficients in the cost function were 100:20:1 for the number of false negatives (FN), the number of false positives (FP), and the delay from the start of a bladder contraction (Ttrue) to the time of detection (Tpred), where Ttrue and Tpred have units in seconds:
| (2) |
We used a grid search over the three coefficients for the three variables in the cost function and found that the highest training accuracies were obtained when the coefficients where chosen to be different orders of magnitude, i.e., 100:20:1, with the number of false negatives chosen as the most important variable. The grid search was performed using coefficients equal to 1, 10, 20, 50, and 100. The total number of trials used for training the algorithm was 45, i.e., 3 trials for each of the 15 rats, including a total of 77 contractions. The remaining trials for each rat were used as a testing set, including 93 contractions across 68 trials.
III. RESULTS
A. Intra-individual Bladder Pressure Predictions
We tested whether the model based on the firing rate (FR model) or the spectrogram (SP model) of the EUS EMG data was a better out-of-sample predictor of bladder pressure. We trained the FR and SP models on data from the first trial in each rat and then used the trained model to predict bladder pressure for the remaining trials. Similarly, we then trained the FR and SP models on the first post-PGE2 trial and predicted bladder pressure for the remaining trials. We compared the bladder pressure prediction accuracy of the FR and SP models and the accuracy of models trained on the first trial to the models trained on the first post-PGE2 trial within each rat.
1). Training with Trial 1 Data
The FR and SP models were trained on the first trial in each rat and tested on all remaining trials within the same rat. Unlike prediction of contractions, which was done on the entire trial, data for bladder estimation (training and testing) were truncated to the time interval 30 seconds before a bladder contraction until 30 seconds after the last bladder contraction. This was done to prevent overfitting to time periods in which the EUS EMG signal was inactive and to focus the evaluation of model accuracy on time periods with bladder contraction activity. Bladder contraction start and end times were determined by an algorithm based on the rate of change in bladder pressure as described in [15] and Section II-C.
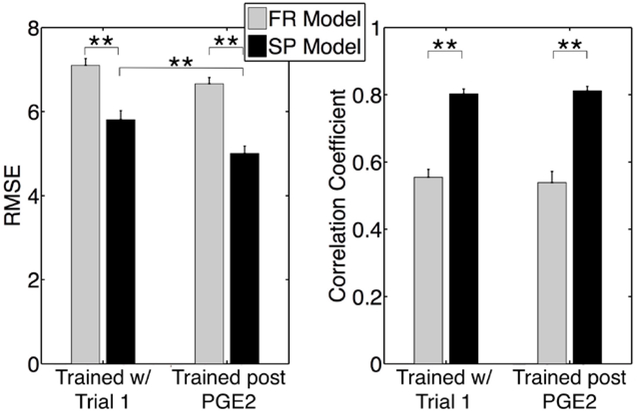
A representative example of the FR and SP models fit to trial 1 data (training) and out-of-sample prediction of trial 4 data (testing) for rat 1 is shown Figure 1. This example illustrates how the SP model is able to capture correctly both the timing and amplitude of the peaks in bladder pressure in the training and testing data when both of these data sets come from trials before PGE2 administration. Predictions from the SP model were significantly more accurate than the FR model and had higher correlation with measured bladder pressure (Figure 2).
Fig. 2.
RMSE and correlation coefficients for out-of-sample test predictions for all rats on models trained on either first trial in each rat (Trained w/ Trial 1) or the trial just after PGE2 treatment (Trained post PGE2). ** indicates P < 0.005, Mann-Whitney U-test. Error bars denote standard error.
2). Training with Post-PGE2 Data
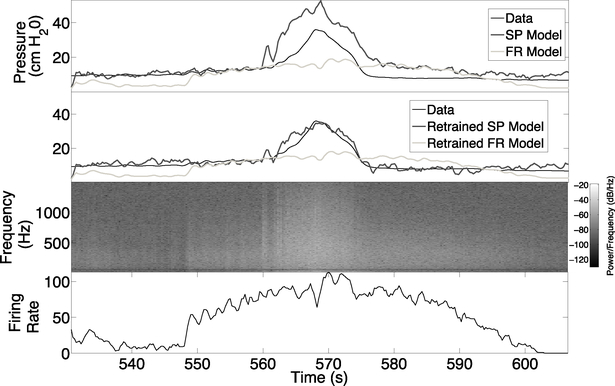
The amount of time since training a model on trial 1 data affected the prediction accuracy among all rats. For example, Figure 3 (top panel) shows the bladder pressure predictions for trial 18 from models trained on trial 1 data. We hypothesized that time-dependent changes in the relationship between EUS EMG and bladder pressure may occur for several reasons in the experiments, including the administration of PGE2, neural stimulation threshold testing, and the amount of time that the rats are anesthetized. To determine if PGE2 administration was a primary factor in changing the relationship between EUS EMG and bladder pressure, we tested whether improvements in prediction accuracy were achieved by retraining our models after the administration of PGE2. We retrained both the FR and SP models using data from the first trial after PGE2 administration and evaluated prediction accuracy on all remaining trials among all rats. The out-of-sample RMSE was significantly lower for the retrained SP model, but not for the retrained FR model, while the out-of-sample correlation between predicted bladder pressure and actual bladder pressure was not significantly different (Figure 2). This shows that the FR model was less able to model the effects of PGE2 in producing bladder overactivity, since training on pre-PGE2 and post-PGE2 data produced almost the same results. Conversely, the retrained SP model accurately predicted bladder pressure for trial 18 in rat 1 (Figure 3). The SP models trained on pre-PGE2 trial data over-predicted bladder pressure during contractions (results not shown), but re-training after PGE2 administration enabled prediction of bladder pressure peaks in other post-PGE2 trials. These findings suggest that one of the effects of PGE2 is to change in the relationship between EUS EMG activity and bladder pressure during contraction. This finding is consistent with previous results showing that PGE2 resulted in reduced bladder capacity [6],[24]. The average NRMSE for all out-of-sample trials obtained was 16.12 ± 6.11 (mean ± standard deviation). For comparison, recent results that used multi-unit dorsal root ganglia recordings to predict bladder pressure obtained an NRMSE of 17 ± 7 [13].
Fig. 3.
Example of bladder pressure predictions for rat 1 tested on trial 18 data. Top and second panels: Predictions are shown for models that were trained on either trial 1 data (top panel) or retrained on trial 5 data (second panel), which is the trial just after PGE2 administration. Third panel: Spectrogram data used by the SP model, power is shown on a −log10 scale. Bottom panel: The firing rate data used by the FR model.
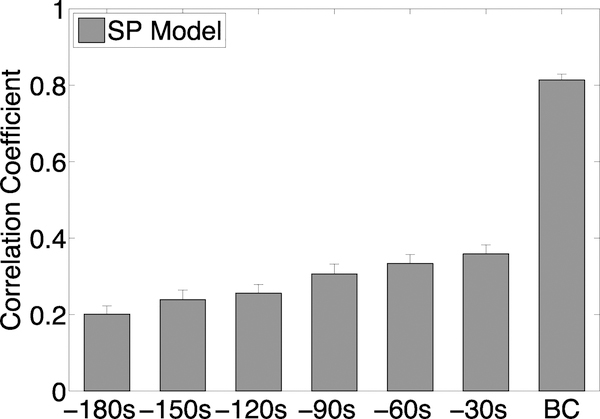
The ability of the SP model to predict bladder pressure more than 30 seconds in advance of a bladder contraction degraded. To quantify the degradation, we calculated the correlation coefficient between out-of sample SP model predictions and bladder pressure data, where the SP model was trained on the first trial after PGE2 administration. Specifically, we trained the SP model for various time frames: the standard BC (representing 30 seconds pre-contraction to 30 seconds post-contraction), and then retrained the model for the standard BC including 30 seconds prior (60 seconds pre-contraction to 30 seconds post-contraction), which we called −30s. We continued re-training the SP model in 30 second intervals until we reached −180s (210 seconds pre-contraction to 30 seconds post-contraction). Figure 4 shows that the correlation coefficient, i.e., predictive ability of the SP model, decreased for time intervals more than 30 seconds in advance of the bladder contraction.
Fig. 4.
Correlation coefficients for out-of-sample test predictions for all rats on models trained on the first trial after PGE2 treatment. The x-axis labels indicate the time interval when predictions are made: “BC” = 60 second time window around the bladder contraction, “−30s” = the 30 second time interval just before the BC time interval, “−60s” = the 30 second time interval just before the “−30s” interval, etc...
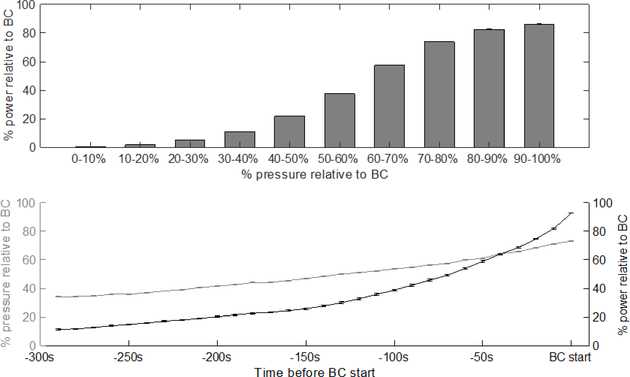
We investigated whether the lack of correlation between predicted and measured pressure using the SP model could be due to a lack of power in the signal of the spectrogram of EUS EMG data at low bladder pressures. We found that, on average, the power of the spectrogram at low bladder pressures was less than 30% of the power at the onset of the bladder contraction (Appendix, Figure 11, top). In our analysis, we define low bladder pressure within each trial as less than 50% of the pressure at the onset of the bladder contraction. We also found that, on average, both the relative percentage of spectrogram power and bladder pressure monotonically decreased prior to the onset of the bladder contraction (Appendix, Figure 11, bottom). The correlation between spectral power and bladder pressure, together with the high accuracy of the SP model at high bladder pressure predictions, suggests that a spectral power that is too low may be insufficient to build an accurate model of bladder pressure. However, this weaker correlation during times of low spectral power did not interfere with our ability to predict accurately bladder contraction onset times (see Section III-C).
B. Spectrogram Frequencies Used by SP model
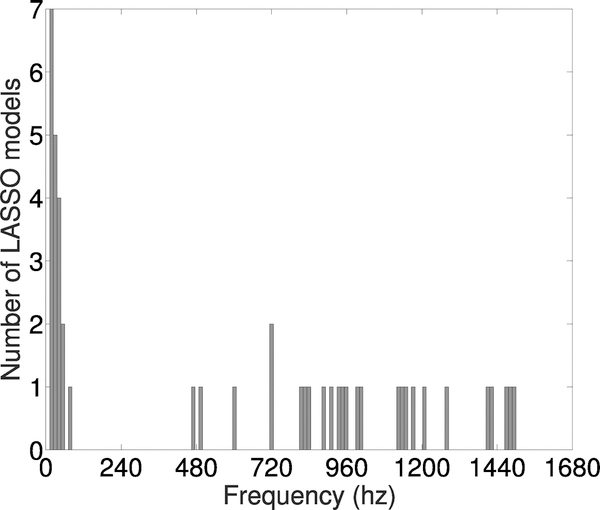
One advantage of using the LASSO method is that we could assess which frequencies in the spectrogram data were most important for predicting bladder pressure. Each SP model consisted of 375 regression coefficients corresponding to 4 Hz ranges in the spectrogram between 0 Hz and 1500 Hz. We determined the most important frequency ranges used by the SP model to make predictions by summing the absolute value of the regression coefficients in 12 Hz intervals, i.e., three adjacent 4 Hz ranges at a time, then ranking this list of values in each rat. We then took the top three 12 Hz intervals in each rat and visualized them in a histogram (Figure 5). Frequencies < 60 Hz were the most commonly occurring frequency range with the largest regression coefficients. This suggests that the information contained in lower frequencies were more important for predictions of bladder pressure.
Fig. 5.
Histogram of frequency ranges with the largest LASSO model coefficients across all 15 rats. The top three 12hz intervals for each rat were used to make the histogram.
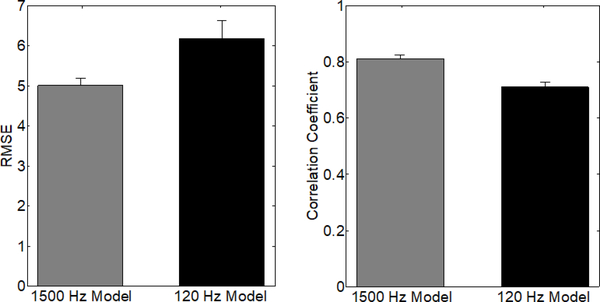
Based on these findings, we tested whether we could obtain accurate predictions using only the frequencies less than 120 Hz. We retrained each SP model on post-PGE2 data using frequencies less than 120 Hz, i.e., each model had 30 regression coefficients corresponding to 4 Hz ranges in the spectrogram between 0 Hz and 120 Hz. We then calculated the RMSE and correlation coefficient on the testing data from the same rat. Restricting the spectrogram data to less than 120 Hz resulted in a significantly less accurate model, i.e., higher RMSE and lower correlation coefficient (Appendix, Figure 12). The RMSEs (mean ± standard deviation) for the 120 Hz and 1500 Hz models were 6.1 ± 4.42 and 5.01 ± 2.35, respectively. The correlation coefficients for the 120 Hz and 1500 Hz models were 0.71 ± 0.17 and 0.81 ± 0.18, respectively. These results suggest that while the lower frequency ranges appear to be the most important for predictions, including the higher frequency range data in the SP model improved accuracy.
1). Inter-individual Bladder Pressure Predictions
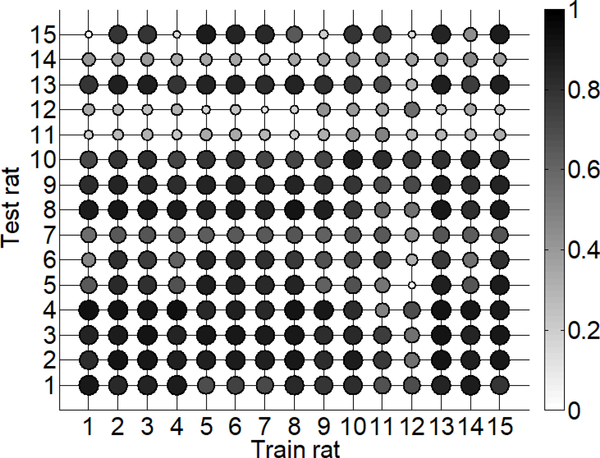
We examined the similarity between the trained SP models across rats by quantifying the accuracy of a model trained on one rat to predict bladder pressure in other rats. Previous work indicates that firing-rate based models do not transfer well for predicting out-of-sample trials [10]. We used the post-PGE2 SP model for each rat to predict bladder pressure in all post-PGE2 trials contained in the testing set for every other rat. Specifically, the mean correlation coefficient (ρ) was calculated over all post-PGE2 testing trials, resulting in 15 mean ρ values for each rat. A matrix representing the accuracy of bladder pressure predictions of each SP model is shown in Figure 6. In the majority of cases (60%) high correlations (ρ> 0.7) between the SP model predictions and measured bladder pressure were maintained across rats. The few exceptions to this finding included rats 11, 12, and 14 for which no trained SP model performed well, suggesting that a relationship between EUS EMG and bladder pressure on the test data sets for these rats was especially difficult to capture with the SP model.
Fig. 6.
Matrix of mean correlation coefficients representing the accuracy of using SP models to predict bladder pressure across rats. Shaded dots represent the mean correlation on the test set for a specific rat (rows) under the trained model (columns). Dots with darker shade and larger size represent higher accuracy, i.e., higher correlation coefficient.
C. Predictions of Bladder Contraction Onset using Model of EUS EMG
1). Intra-individual Bladder Contraction Predictions
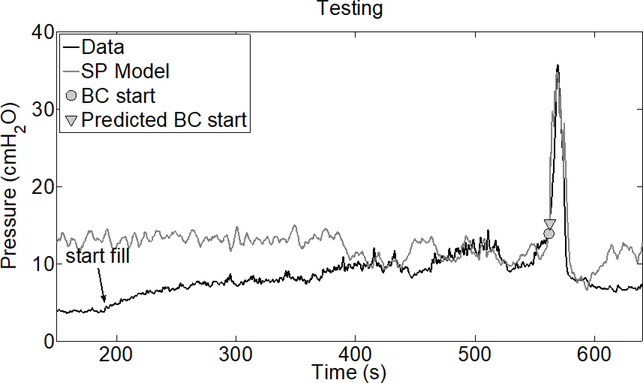
We tested the accuracy of our bladder contraction detection algorithm by training it on the first 3 trials after PGE2 administration and testing on all remaining trials for each rat. We did not train or test the detection algorithm on pre-PGE2 data since there were an insufficient number of trials for testing, i.e., to evaluate sensitivity and specificity. We note that only the first post-PGE2 trial was used to train the SP model for bladder pressure prediction. A representative example for predicting the bladder contraction start time is shown in Figure 8. Note that this is the same test trial shown in Figure 3. The correlation between predicted and measured bladder pressure in this example degrades outside of a one minute interval around the bladder contraction, consistent with the findings in Figure 4.
Fig. 8.
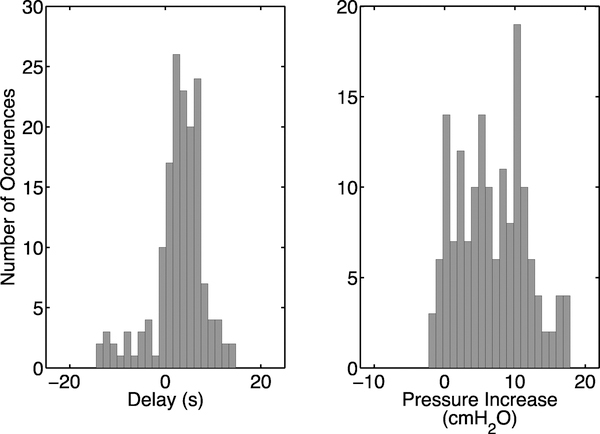
Performance of the bladder contraction detection algorithm using EUS EMG data. Histograms of the delay between the onset of bladder contractions and the time of detection (left panel) and the increase in bladder pressure between onset and when the contraction was detected (right panel).
Accuracy of bladder contraction detection was quantified with sensitivity, defined as the number of detected contractions divided by the total number of contractions, and specificity, defined as the number of detected contractions divided by the number of detected contractions plus the number of false positives. Additionally, we quantified the delay between the onset of contractions determined from the bladder pressure and detection by our algorithm, as well as the increase in bladder pressure between the onset of the contraction determined from the bladder pressure and its detection by our algorithm. Results are summarized in Table I.
Table 1:
Performance of detecting bladder contractions from EUS EMG. The median (standard deviation) of the delay between onset of contraction and its detection, the increase in bladder pressure between onset of contraction and its detection, sensitivity, and specificity are shown. After removing two outlier rats for which had the bladder contraction detection algorithm had poor performance (specificity < 50%), the testing sensitivity and specificity both increased to 91.5%.
| Training set | Testing set | |
|---|---|---|
| Delay (s) | 2.8 (4.1) | 4.5 (6.0) |
| Pressure Increase (cmH2O) | 5.8 (5.0) | 7.2 (4.8) |
| Sensitivity | 96.1% | 91.3% |
| Specificity | 91.4% | 80.2% |
The majority of rats in the training set had sensitivity and specificity both equal to 1. In the testing set, 10 out of 15 rats had specificity equal to 1 and 9 out of 15 rats had sensitivity equal to 1. We note that there were 2 outliers (out of 15 rats) for which the bladder contraction detection algorithm predictions were poor, e.g., specificity < 50%. After removing these outliers, the testing sensitivity and specificity both increased to 91.5%. Histograms of the delays (2.87 ± 5.51 seconds) and increases in pressure (6.72 ± 4.82 cmH2O) above baseline are shown in Figure 8.
2). Bladder Contraction Algorithm Detection Parameters
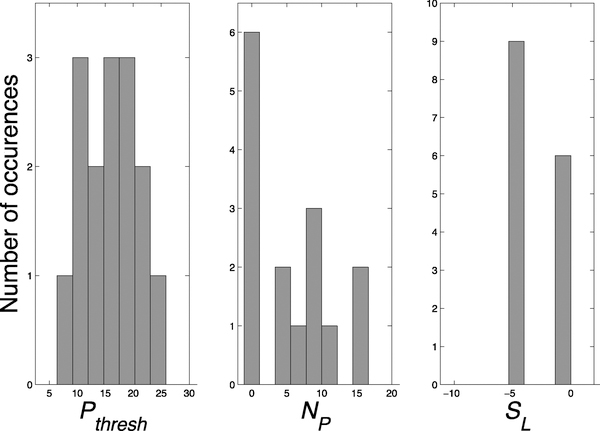
Histograms of the three detection parameters (Pthresh, NP, and SL) across all rats are shown in Figure 9. Pthresh was normally distributed around a mean of 15.6 cmH2O while NP was more exponentially distributed with most rats having a value of zero for this parameter. The parameter SL was bimodally distributed at a value of approximately 0 or −4. This indicates that the criteria for the algorithm to detect bladder contractions did not require that the slope of the recent predicted bladder pressure be positive, but rather that it was just not extremely negative. There was little correlation between the three parameters, and they were mutually independent (ρ < 0.13 for each comparison).
Fig. 9.
The values of the three rat specific parameters used for BC prediction. Pthresh = bladder pressure threshold. NP = number of consecutive points at which the predicted bladder pressure was above Pthresh. SL = slope threshold for the most recent 7.5 seconds of predicted bladder pressure. The x-axis range is the range of parameter values used in the rat specific parameter optimization.
3). Inter-individual Bladder Contraction Predictions:
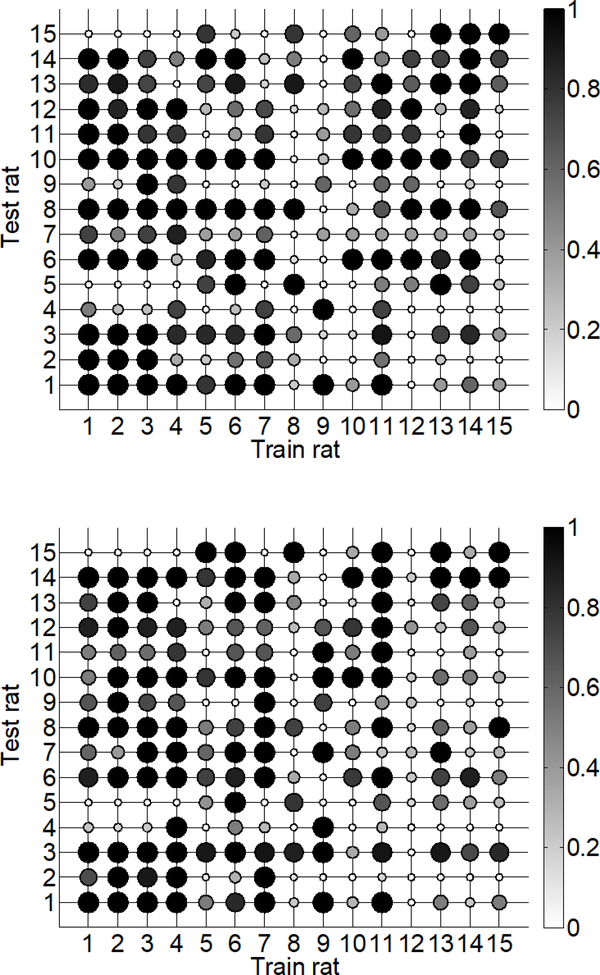
We investigated the transferability of using a trained SP model for bladder contraction detection across rats. We calculated the sensitivity and specificity of each SP model trained on one rat and used the same testing sets from all other rats that were used for evaluating intra-individual bladder contraction predictions. None of the SP model coefficients or three prediction parameters were changed from the intra-individually evaluated models. The predictive value of models transferred across rats for some cases (Figure 10). For example, the sensitivity and specificity were both > 0.7 in 31.9% (67/210) of the cases where a model was trained on one rat and tested on a different rat. The sensitivity and specificity were both > 0.7 in 11 out of 15 cases where the model was trained and tested on the same rat, i.e., the diagonal of the matrices in Figure 10. However, in 14 of out 15 test sets, at least one of the 15 trained models had sensitivity and specificity both > 0.7. These findings indicate that models trained on out-of-rat data had better prediction accuracy on some testing sets than models trained on within-rat data. For example, the model for rat 6 had higher sensitivity and specificity on the testing set for rat 5 than the model trained on rat 5 data. One possible explanation for this finding is that the relationship between EUS EMG and bladder pressure in the training data for rat 6 was more similar to the true relationship in the testing data for rat 5 than it was in the training data for rat 5 itself. In this scenario, the rat 5 model may be over-fitted to the rat 5 training data and thus did not generalize well to the testing set for rat 5. These results suggest that including data across rats in the training set for a model could improve bladder contraction prediction accuracy if those additional training data are similar to the testing data.
Fig. 10.
Matrices of sensitivity (top) and specificity (bottom) values showing the accuracy of using LASSO models to predict bladder pressure across rats. Shaded dots represent the sensitivity or specificity on the test set for a specific rat (rows) under the trained model (columns). Dots with darker shade and larger size represent higher sensitivity or specificity.
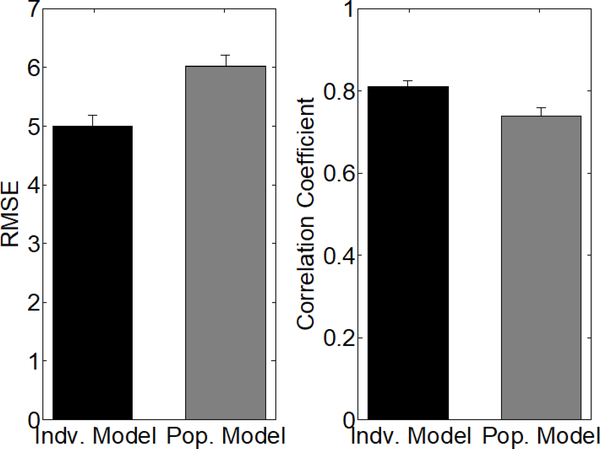
We tested whether training our SP model on data from multiple rats could increase the accuracy of interindividual bladder pressure predictions, and hence lead to more accurate bladder contraction predictions. We retrained SP models by concatenating the data from multiple rats into a single training set. However, models trained on data from multiple rats resulted in higher RMSEs and lower correlations between predicted and measured pressure (Appendix, Figure 13).
IV. DISCUSSION
Urinary incontinence resulting from SCI or neurological disease can be treated by applying electrical stimulation at the onset of bladder contractions, and such a closed-loop approach to restoration of continence could be applied in cases of overactive bladder, as well. Therefore, it is imperative to predict the onset of nascent bladder contractions. We presented a novel method for predicting bladder pressure and the onset of bladder contraction from a time-dependent spectrogram representation of EUS EMG data and a LASSO model.
When comparing the ability of our SP model, trained on time-dependent spectrogram data, with previous methods that rely on the firing rate to infer bladder pressure, we found a significant improvement in bladder pressure prediction accuracy. This shows that a multivariate feature representation of EUS EMG data, such as the spectrogram, may contain more information to infer bladder pressure than univariate features, such as the firing rate. Our method obtained an NRMSE of 16.12 ± 6.11 and a correlation coefficient of 0.80. Models using multi-unit dorsal root ganglia recordings to predict bladder pressure obtained correlation coefficients of 0.69 and an NRMSE of 17 ± 7 [13]. Importantly, this approach made use of multiple simultaneously recorded channels, while our approach used only a single channel of EUS EMG activity. When using post-PGE2 trial data for training and other post-PGE2 trials for testing, we obtained a significantly more accurate model, in terms of RMSE, than using pre-PGE2 trials for training. This finding suggests that PGE2 administration alters the relationship between EUS EMG activity and bladder pressure, a conjecture supported by previous experimental work [6],[24]. This finding also highlights the importance of preserving the temporal order of the trials to evaluate prediction accuracy. A leave-one-out cross validation analysis across all trials would be insufficient to capture the effect of PGE2 on model predictions. Additionally, evaluating model accuracy in temporal order more closely reflects a scenario in which our model would be deployed in future experiments, i.e., by training on an early trial and then being applied on the remaining trials. Our analysis of the coefficients of the trained SP models suggests that lower-frequency data were the most informative for predicting bladder pressure.
Using the trained SP models, we implemented an algorithm to detect the onset of nascent bladder contractions. The algorithm was individual-specific, trained on three post-PGE2 trials and tested on the remaining trials. We obtained a sensitivity (true positive rate) of 96.1% and specificity (true negative rate) of 91.4% in the training set and sensitivity of 91.3% and specificity of 80.2% in the testing set. The specificity is markedly higher as compared to previous bladder contraction onset detection algorithms. Several previous studies used a weighted cumulative sum (CUSUM) algorithm. In general, whether using data from pudendal nerve electroneurogram (ENG) [15], external anal sphincter EMG [16], or sacral nerve root ENG [25], using a weighted CUSUM algorithm tended to result in high sensitivity but very low specificity (i.e., many false detections of bladder contractions) [15],[16] or delayed detection of the contraction onset [25]. Another algorithm proposed to detect the onset of bladder contractions using the kurtosis of the amplitude of the EUS EMG resulted in low specificity [26]. Moreover, some of these algorithms require the signals to be processed or filtered before being fed into the detection algorithm, precluding the ability to detect contractions in real-time.
Although we were able to predict accurately bladder pressure and bladder contraction onset with reasonable success, we note there are limitations of this present study. For example, it is not clear that there exists a similar relationship between the EUS EMG signal and bladder pressure in other species, including humans. All recordings were made under anesthesia and movement artifacts under awake behaving conditions may lead to additional false positive detections, highlighting the importance of detection algorithms that consider more than simple thresholding of firing rate. Additionally, the relationship between EUS EMG signal and bladder pressure may be altered in cases of disease or injury, and further work is required to address these issues. One advantage of using our approach is speed; real-time contraction detection is enabled by the use of the fast Fourier transform for calculating a spectral representation, which is then directly used by a linear model for pressure prediction.
The median delay in detecting the onset of a bladder contraction was ~5 s, which is comparable to the average 3 s delay to detect contractions from the pudendal electroneurogram [9] but somewhat longer than the < 1 s delay to detection nascent contractions from the EMG in humans with SCI [14]. The performance of closed-loop sensory stimulation in inhibiting nascent bladder contractions depends on the detection delay, but stimulation at 5 s after contraction onset still resulted in significant inhibition [9]. It is not clear how changes in EUS EMG activity between species and following SCI may influence the delay to detection, but prior results suggest that detection performance is equivocal between synergic and dyssynergic contractions [14].
Despite this initial success, there are still several questions that need to be investigated. For example, including EUS EMG data from trials in which electrical stimulation was delivered will result in richer training data for our models and might enable lead to more accurate predictions of bladder pressure and contraction onset. Including more training data for our models by concatenating data from multiple rats did not improve bladder pressure predictions. One explanation for this finding is that the relationship between EUS EMG and bladder pressure reflected in the data are only similar among certain subpopulations of the rats used in this study. Thereby, the generalizability of models trained on population data may require a statistical model that can account for population heterogeneity. We note that there exist statistical methods for estimating LASSO model parameters from population level data, e.g., with mixed effects modeling [27], [28]. The focus of this work was to test whether sparse regression and spectrogram representation of the EUS EMG signal could lead to improvements in bladder contraction prediction over previous methods. We leave testing the accuracy of other estimation methods, such as mixed effects modeling, to future work.
Fig. 7.
Example of bladder contraction prediction for rat 1 tested on trial 18 data. The SP model was trained on trial 5 data, which is the trial just after PGE2 administration. The “Start fill” time indicates when the bladder starts to be filled during the trial.
APPENDIX
Fig. 11.
Top: Relationship between the bladder pressure and spectral power of the EUS EMG signal at times before the bladder contraction. Bottom: The pressure and spectral power as a function of time before the bladder contraction. Both the bladder pressure and spectral power are calculated as a percentage relative to their values at the bladder contraction (BC) start time. Values shown are the mean over all rats and post-PGE2 trials. Error bars denote standard error. The top panel shows that there is less than 30% spectral power present at bladder pressures less than 50% relative to BC. The bottom panel shows that bladder pressure and spectral power both increase monotonically before the BC start time.
Fig. 12.
Comparison of accuracy metrics for predicting bladder pressure with the SP model trained only on 120hz and lower frequency data (black) versus the frequency domain up to 1500hz (gray). Error bars denote standard error. RMSE and correlation coefficients are significantly worse for the 120hz model (P < 0.005, Mann-Whitney U-test).
Fig. 13.
Accuracy metrics for predicting bladder pressure with an SP model trained on population level data. Error bars denote standard error. We trained 15 separate population SP models for predicting bladder pressure. In each of the SP models, we concatenated all of the post-PGE2 trial data from 14 rats and tested the model on the post-PGE2 trials from the remaining held-out rat. This essentially performs a leave-one-out cross validation analysis of our methodology, representing the best case scenario in which each SP model is trained on the maximum amount of data. The RMSE and correlation coefficient were used to compare the prediction accuracy of the individual level model (black) against the population level model (gray). RMSE and correlation coefficients are significantly worse for the population model (P < 0.005, Mann-Whitney U-test).
Contributor Information
Erica M. Rutter, Department of Mathematics, North Carolina State University, Raleigh, NC, USA
Christopher L. Langdale, Department of Biomedical Engineering, Duke University, Durham, NC, USA
James A. Hokanson, Department of Biomedical Engineering, Duke University, Durham, NC, USA
Franz Hamilton, Department of Mathematics, North Carolina State University, Raleigh, NC, USA.
Hien Tran, Department of Mathematics, North Carolina State University, Raleigh, NC, USA.
Warren M. Grill, Department of Biomedical Engineering, the Department of Electrical and Computer Engineering, the Department of Neurobiology, and the Department of Neurosurgery, Duke University, Durham, NC, USA
Kevin B. Flores, Department of Mathematics, North Carolina State University, Raleigh, NC, USA
REFERENCES
- [1].Kennelly MJ, Bennett ME, Grill WM, Grill JH, and Boggs JW, “Electrical stimulation of the urethra evokes bladder contractions and emptying in spinal cord injury men: case studies,” J. Spinal Cord Med, vol. 34, no. 3, pp. 315–321, 2011. [DOI] [PMC free article] [PubMed] [Google Scholar]
- [2].Boggs JW, Wenzel BJ, Gustafson KJ, and Grill WM, “Bladder emptying by intermittent electrical stimulation of the pudendal nerve,” J. Neural Eng, vol. 3, no. 1, pp. 43–51, 2006. [DOI] [PubMed] [Google Scholar]
- [3].Bruns TM, Bhadra N, and Gustafson KJ, “Bursting stimulation of proximal urethral afferents improves bladder pressures and voiding,” J. Neural Eng, vol. 6, no. 6, p. 066006, 2009. [DOI] [PMC free article] [PubMed] [Google Scholar]
- [4].Langdale CL and Grill WM, “Phasic activation of the external urethral sphincter increases voiding efficiency in the rat and the cat,” Exp. Neurol, vol. 285, pp. 173–181, 2016. [DOI] [PMC free article] [PubMed] [Google Scholar]
- [5].Shah N, Edhem I, Knight S, Shah J, and Craggs M, “Acute suppression of provoked detrusor hyperreflexia by electrical stimulation of the dorsal penile nerve.” Eur. Urol, 33Suppl 1 (1998): 60. [Google Scholar]
- [6].Langdale CL, Hokanson JA, Sridhar A, and Grill WM, “Stimulation of the pelvic nerve increases bladder capacity in the prostaglandin e2 rat model of overactive bladder,” Am. J. Physiol. Renal Physiol, vol. 313, no. 3, pp. F657–F665, 2017. [DOI] [PMC free article] [PubMed] [Google Scholar]
- [7].Kirkham APS, Shah NC, Knight SL, Shah PJR, and Craggs MD, “The acute effects of continuous and conditional neuromodulation on the bladder in spinal cord injury.” Spinal Cord, vol. 39, pp. 420–428, (2001). [DOI] [PubMed] [Google Scholar]
- [8].Rijkhoff NJM, Wijkstra H, Van Kerrebroeck PEV, and Debruyne FMJ, “Urinary bladder control by electrical stimulation: review of electrical stimulation techniques in spinal cord injury.” Neurouro. Urodyn, vol. 16, no. 1, pp. 39–53, (1997). [DOI] [PubMed] [Google Scholar]
- [9].Wenzel BJ, Boggs JW, Gustafson KJ, and Grill WM, “Closed loop electrical control of urinary continence,” J. Urol, vol. 175, pp. 559–1563, 2006. [DOI] [PubMed] [Google Scholar]
- [10].Bruns TM, Gaunt RA, and Weber DJ, “Estimating bladder pressure from sacral dorsal root ganglia recordings,” in 33rd Ann. Int. Con of the IEEE Eng. Med. Biol. Soc., 2011, pp. 4239–4242. [DOI] [PMC free article] [PubMed] [Google Scholar]
- [11].Geramipour A, Makki S, and Erfanian A, “Neural network based forward prediction of bladder pressure using pudendal nerve electrical activity,” in 37th Ann. Int. Con of the IEEE Eng. Med. Biol. Soc., 2015, pp. 4745–4748. [DOI] [PubMed] [Google Scholar]
- [12].Mendez A, Sawan M, Minagawa T, and Wyndaele J-J, “Estimation of bladder volume from afferent neural activity,” IEEE Trans. Neural Syst. Rehabil. Eng, vol. 21, no. 5, pp. 704–715, 2013. [DOI] [PubMed] [Google Scholar]
- [13].Ross SE, Ouyang Z, Rajagopalan S, and Bruns TM, “Evaluation of decoding algorithms for estimating bladder pressure from dorsal root ganglia neural recordings,” Ann. Biomed. Eng, vol. 46, no. 2, pp. 233–246, 2017. [DOI] [PMC free article] [PubMed] [Google Scholar]
- [14].Wenzel BJ, Boggs JW, Gustafson KJ, Creasey GH, and Grill WM, “Detection of neurogenic detrusor contractions from the activity of the external anal sphincter in cat and human,” Neurouro. Urodyn, vol. 25, no. 2, pp. 140–147, 2006. [DOI] [PubMed] [Google Scholar]
- [15].Wenzel BJ, Boggs JW, Gustafson KJ, and Grill WM, “Detecting the onset of hyper-reflexive bladder contractions from the electrical activity of the pudendal nerve,” IEEE Trans. Neural Syst. Rehabil. Eng, vol. 13, no. 3, pp. 428–435, 2005. [DOI] [PubMed] [Google Scholar]
- [16].Clavica F, Choudhary M, van Asselt E, and van Mastrigt R, “Can an algorithm predict a voiding contraction in unconscious rats?” in 35th Ann. Int. Con of the IEEE Eng. Med. Biol. Soc., 2013, pp. 1334–1337. [DOI] [PubMed] [Google Scholar]
- [17].Niederhauser T, Gafner ES, Cantieni T, Grämiger M, Haeberlin A, Obrist D, Burkhard F et al. , “Detection and quantification of overactive bladder activity in patients: Can we make it better and automatic?” Neurouro. Urodyn, pp. 1–9, 2017. [DOI] [PubMed] [Google Scholar]
- [18].Melgaard J and Rijkhoff NJ, “Detecting urinary bladder contractions: methods and devices,” J. Sens. Technol, vol. 4, no. 04, pp. 165–176, 2014. [Google Scholar]
- [19].Zolliker D, Niederhauser T, Gramiger M, van Mastrigt R, Burkhard FC, Obrist D, and Clavica F, “Frequency analysis of urinary bladder pre-voiding activity in normal and overactive human detrusor: A pilot study”, 37th Ann. Int. Conf. of the IEEE Eng. Med. Biol. Soc, 2015. [Google Scholar]
- [20].de Groat WC, Griffiths D, and Yoshimura N, “Neural control of the lower urinary tract,” Compr. Physiol, vol. 5, pp. 327–396, 2015. [DOI] [PMC free article] [PubMed] [Google Scholar]
- [21].Andersson K-E and Arner A, “Urinary bladder contraction and relaxation: physiology and pathophysiology,” Physiol. Rev, vol. 84, no. 3, pp. 935–986, 2004. [DOI] [PubMed] [Google Scholar]
- [22].Rish I and Grabarnik G, Sparse modeling: theory, algorithms, and applications. CRC press, 2014. [Google Scholar]
- [23].Tibshirani R, “Regression shrinkage and selection via the lasso,” J. R. Stat. Soc. Series B Stat. Methodol, vol. 58, no. 1, pp. 267–288, 1996. [Google Scholar]
- [24].Hokanson JA, Langdale CL, Sridhar A, and Grill WM, “OAB without an overactive bladder in the acute prostaglandin E2 rat model,” Am. J. Physiol. Renal Physiol, vol. 313, no. 5, pp. F1169–1177, 2017. [DOI] [PMC free article] [PubMed] [Google Scholar]
- [25].Jezernik Sašo, Grill Warren M., and Sinkjaer Thomas. “Detection and inhibition of hyperreflexia-like bladder contractions in the cat by sacral nerve root recording and electrical stimulation.” Neurouro. Urodyn, vol 20, no. 2, pp. 215–230, 2001. [DOI] [PubMed] [Google Scholar]
- [26].Hansen JB, Rodriguez A, Vidal J, Sinkjaer T, and Rijkhoff NJM, “Urethral sphincter EMG as event detector for Neurogenic detrusor overactivity.” IEEE Trans. Biomed. Eng, vol. 54, no. 7, pp. 1212–129, 2007. [DOI] [PubMed] [Google Scholar]
- [27].Schelldorfer J, Meier L, and Bhlmann P, “Glmmlasso: An algorithm for high-dimensional generalized linear mixed models using 1-penalization,” J. Comput. Graph. Stat, vol. 23, no. 2, pp. 460–477, 2014. [Google Scholar]
- [28].Groll A and Tutz G, “Variable selection for generalized linear mixed models by l1-penalized estimation,” Stat. Comput, vol. 24, no. 2, pp. 137–154, March 2014. [Google Scholar]


