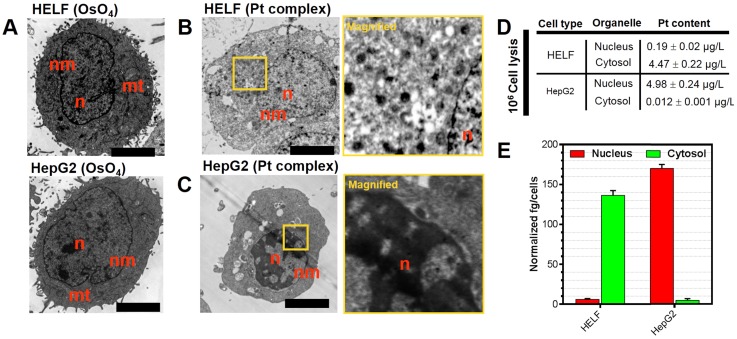
Figure 3.
(A) Untreated HELF or HepG2 cells stained with OsO4. (B,C) HELF or HepG2 cells treated with Pt complex (10 μM) for 30 min before processing for TEM. No other contrast stain was employed. (D) and (E) ICP-MS quantification of internalized Pt complex in nucleus and cytosol by HELF and HepG2 cells. Scale bars = 5 μm.

