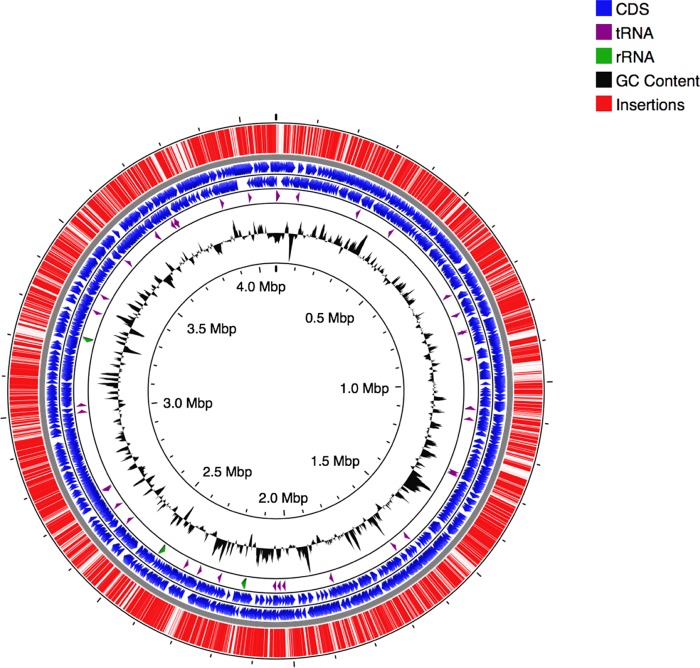
FIG 1.
B. pertussis transposon library. A map of insertions (red) and their distribution across the genome was generated by CGView (16). Coding regions of genes (coding sequences [CDS]) are shown in blue and separated by strand. Locations of tRNA and rRNA are shown in purple and green, respectively. GC content is represented in black.

