

Abstract
SUMMARY – The objective of this study was to determine differential expression of TFF1, TFF2 and TFF3 genes and proteins in breast tumor subtypes. In addition, we investigated the correlation between TFF genes within tumor subgroups, and TFF genes with clinical and pathologic characteristics of the tumor. Study group included 122 patients with surgically removed breast tumors. Samples were investigated using qRT-PCR and immunohistochemistry. TFF1 and TFF3 genes and proteins were expressed in breast tumors, while the levels of TFF2 gene and protein expression were very low or undetectable. TFF1 was significantly more expressed in benign tumors, while TFF3 was more expressed in malignant tumors. Gene and protein expression of both TFF1 and TFF3 was greater in lymph node-negative tumors, hormone positive tumors, tumors with moderate levels of Ki67 expression, and in grade II tumors. A strong positive correlation was found between TFF1 and TFF3 genes, and the expression of both negatively correlated with Ki67 and the level of tumor histologic differentiation. Our results suggest that TFF1 and TFF3, but not TFF2, may have a role in breast tumor pathogenesis and could be used in the assessment of tumor differentiation and malignancy.
Key words: Neoplasm Proteins, Breast Neoplasms, Immunohistochemistry, Polymerase Chain Reaction, Lymph Nodes, Ki-67 Antigen, Biomarkers
Introduction
Breast cancer is the most common form of cancer affecting women worldwide, and is a global health, economic and social problem (1). Malignant breast tumors are a highly heterogeneous tumor group and are therefore difficult to classify into uniform subgroups that could be used to assess malignancy of the tumor, choose appropriate treatment, and thus ensure long-term survival of patients (2). According to St. Gallen consensus, which is based on estrogen receptor (ER), progesterone receptor (PR) and human epidermal growth factor receptor (HER2) expression, tumors are divided into four subgroups: Luminal A (Lum A), Luminal B (Lum B), HER2 positive (HER2 pos) and triple negative (triple neg) (3). This consensus can apply to all types of breast tumors regardless of their histologic type and is of substantial clinical significance because it helps assess tumor malignancy and select appropriate treatment (4). However, breast tumors still exhibit substantial histologic and clinical heterogeneousness. Therefore, new biomarkers are needed to improve diagnosis, assess progression of the disease and choose appropriate tumor therapy to ease treatment and prolong patient survival (5).
Trefoil factor family (TFF) proteins are small secretory proteins expressed mainly in the gastrointestinal tract, but are also found in many other human tissues. The trefoil factor family consists of three members (TFF1, TFF2 and TFF3) expressed in different human tissues (6, 7). TFF proteins participate in numerous physiologic and pathologic processes through different mechanisms. Their versatile functions are important in mucosal restitution and repair processes, cell adhesion, motility, apoptosis, and angiogenesis (8-10). They are also found in different tissues during embryonic development (11). Apart from healthy tissues, TFF proteins are expressed in various pathologically changed tissues, such as inflamed gut in the inflammatory bowel disease and malignant tumors, including breast cancer (12). There is a controversy regarding the impact of TFF1 protein on the malignant properties of breast cancer. Some studies indicate that it enhances breast cancer development (13-16), whereas others propose a tumor-suppressive role (17-20). At first, TFF2 protein was not found in the epithelium of either normal or pathologically changed breasts (21). Later experiments have revealed that TFF2 protein is expressed in breast cancer cell line, both in normal breast cells and in breast tumor cells, and has a motogenic effect on breast cancer cells in cell culture; however, it is secreted in very small amounts compared to TFF1 and TFF3 proteins (22). According to experiments on breast cancer cell lines, TFF2 protein is considered a negative prognostic biomarker (23-25). Past studies of TFF3 protein have indicated that it promotes invasiveness, prevents apoptosis of tumor cells, and stimulates neoangiogenesis in tumor tissue, allowing tumor progression and promoting its malignancy. TFF3 protein has been therefore categorized as a biomarker indicating poor prognosis, even though it is expressed more strongly in hormone receptor-positive tumors, which have better prognosis (9, 26-29).
The objective of this study was to determine differential expression of TFF genes and TFF proteins in various breast tumor subtypes. Additionally, we assessed correlation between TFF genes within the tumor subgroups and their correlation with the clinical and pathologic characteristics of the tumor in order to determine their value as potential biomarkers.
Our results suggested that TFF1 and TFF3, unlike TFF2, may have a role in breast tumor pathogenesis and could be used in the assessment of tumor malignancy only in particular breast tumor subgroups. Increased expression of TFF1 could be used as a potential biomarker indicating good prognosis, whereas TFF3 could be helpful in tumor status assessment.
Patients and Methods
Study population
The study included 122 female patients that underwent surgery at the Department of Surgery, Osijek University Hospital Centre for obvious breast tumor. The study lasted for 30 months (2014-2016). The test group comprised of 91 surgical patients with malignant breast tumors and 31 patients with fibroadenomas (benign breast tumors) surgically removed (30). On analyzing the data obtained, we subdivided the malignant group depending on hormone receptor status (2011 St. Gallen consensus) (4), histologic grade (Nottingham Grading System) (31), affection of lymph nodes by metastases, and levels of expression of the Ki67 proliferation marker.
Gene analysis
Tumor samples for gene expression analysis were obtained during surgical procedures and were immediately stored in the RNAlater® total RNA integrity preservation solution (Applied Biosystems, USA). The collected samples were kept at room temperature for one hour and afterwards stored at -80 °C until total RNA isolation process.
Tissue samples were homogenized with liquid nitrogen. Total RNA isolation was performed using the TRI Reagent (Life Technologies, USA) according to the manufacturer’s protocol. Total RNA was diluted with 30 µL of DEPC-treated water (Santa Cruz, USA) and stored at -80 °C. Amplification Grade DNase I (Sigma-Aldrich, USA) commercial kit was used to remove DNA molecules from RNA samples, following the manufacturer’s protocol. NanoPhotometer® P-Class P330-30 micro volume spectrophotometer (Implen, Germany) was used to determine RNA concentration and sample purity. Isolated RNA was transcribed into cDNA using reverse transcriptase from the PrimeScriptTM RT reagent Kit (Perfect Real Time, Takara, USA) commercial kit. The reaction was performed in a CFX96 device (Bio Rad, USA) for 120 minutes at 37 °C, followed by 5 seconds at 85 °C. The reaction mixture was then cooled to 4 °C.
Nucleotide sequences for the primers were chosen using the primer designing program available on the website http://eu.idtdna.com/site and literature (32). Optimal reaction conditions in which an efficiency ranging from 95% to 100% was achieved were determined for each individual gene primer pair. Each sample was processed in duplicate. qRT-PCR reactions were performed in the following conditions: enzyme activation at 95 °C for 30 seconds followed by 40 cycles of denaturation at 95 °C for 5 seconds, primer annealing at 55-60 °C for 5 seconds (40 cycles) and 10 seconds at 55-63 °C, with the final disassociation step. qRT-PCR was performed on a Real Time PCR System Bio Rad CFX96 device. Actin beta (ACTB) gene expression was used to normalize gene expression (33). Primer sequences and annealing temperature used for qRT-PCR analysis are presented in Table 1.
Table 1. Primer sequences and primer annealing temperature used on qRT-PCR analysis.
| Gene | Sequence | Annealing temperature (°C) |
|---|---|---|
| TFF1 | FOR: TTTGGAGCAGAGAGGAGGCAATG REV: ACCACAATTCTGTCTTTCACGGGG |
63.3 °C |
| TFF2 | FOR: CCCATAACAGGACGAACTGC REV: GCACTGATCCGACTCTTGCT |
55.7 °C |
| TFF3 | FOR: CTTGCTGTCCTCCAGCTCT REV: CCGGTTGTTGCACTCCTT |
64.5 °C |
| ACTB | FOR: AAGCACCAGGGCGTGAT REV: TCGTCCCAGTTGGTGACGA |
63.3 °C |
TFF1 = trefoil factor family 1 gene; TFF2 = trefoil factor family 2 gene; TFF3 = trefoil factor family 3 gene; ACTB = actin beta gene
Protein analysis
Protein expression was accompanied by immunohistochemical sample analysis. The patient cohort comprised of 75 surgical patients with breast tumors removed, 15 (20%) of which were fibroadenoma samples (benign tumors) and 60 (80%) malignant tumor samples. All samples were collected at the Department of Pathology and Forensic Medicine, Osijek University Hospital Centre. All samples were subjected to an initial histopathologic analysis and were histopathologically reconfirmed by an independent pathologist. Formalin-fixed and paraffin-embedded sections of breast tumor tissue were deparaffinized and rehydrated. Endogenous peroxidase blocking using 0.3% hydrogen peroxide (15 minutes) was performed on the sections, followed by antigen retrieval in citrate buffer (pH=6.0) by heating in a microwave oven for 5 minutes. The primary antibody was applied to the slides, and incubated at 4 °C overnight. Primary antibodies used in this study were anti-TFF1 (Anti-Estrogen Inducible Protein pS2 antibody ab92377, Abcam, USA), anti-TFF2 (Anti-Spasmolytic Polypeptide antibody ab131147, Abcam, USA) and anti-TFF3 (purified polyclonal rabbit anti-TFF3 antibody, proprietary, self-made) (34). Negative controls were incubated with phosphate-buffered saline (PBS, pH=7.4) instead of primary antibody. Human stomach tissue was used as positive control for TFF1 and TFF2 proteins, and human colon tissue was used as positive control for TFF3 protein. Following primary antibody incubation, the sections were washed in PBS with Tween (0.05%) (Sigma Aldrich, USA) four times. This was followed by application of secondary antibody (affinity purified, biotinylated goat anti-rabbit IgG, Vector Laboratories, USA), left at room temperature for 120 minutes. This procedure was followed by four more washes in PBS with 0.05% Tween, after which the slides were incubated with streptavidin conjugated to horseradish peroxidase (Streptavidin-HRP, Vector Laboratories, USA) at room temperature for 45 minutes. After four more washes in PBS with Tween, 3.3’-diaminobenzidine solution was applied (DAB Peroxidase (HRP) Substrate Kit, Vector Laboratories, USA). After four washes in PBS with Tween, the slides were counterstained with hematoxylin and dehydrated in appropriate solutions. Slides were mounted using Canada balsam and covered with coverslips. The analysis was performed at the Histology Laboratory, Faculty of Medicine in Osijek.
The slides thus obtained were analyzed by two independent histologists. They were photographed using an Olympus® C-5050 digital camera connected to an Olympus® BX-50 microscope and QuickPHOTO Pro software. The histomorphological analysis determined the existence, proportion and signal strength of TFF protein expression in individual samples using the Modified Quick Score (Q) method of immunohistochemical staining (35, 36). Modified Quick Score method is presented in Table 2.
Table 2. Modified Quick Score (Q) method for immunohistochemistry protein expression analysis.
| Proportion score (A) | Intensity score (B) |
|---|---|
| No signal <1% - 0 | No signal - 0 |
| Proportion of positive cells 1%-10% - 1 | Weak signal - 1 |
| Proportion of positive cells 11%-33% - 2 | Moderately strong signal - 2 |
| Proportion of positive cells 34%-66% - 3 | Strong signal - 3 |
| Proportion of positive cells 67%-100% - 4 |
Q = A + B, where Q marks the Quick Score total result; A = proportion score; B = intensity score; minimum Q score was 0 and maximum was 7.
Statistical methods
Sample size was defined based on preliminary research results. A minimum sample size of 22 subjects per group or 44 subjects in 2 groups was required to detect a 0.4 effect with α=0.05 and test strength of 0.8. Category data was presented in absolute and relative frequencies. Numerical data were described by median and interquartile range limits. The χ2-test and, where necessary, Fisher exact test were used to test category variable differences. The Shapiro-Wilk test was used to test the normality of numeric variable distribution. The Mann-Whitney U test was used to test numeric variable differences due to deviations from normal distribution. Spearman’s rank correlation coefficient was used for correlation assessment. All p-values were two-sided. Materiality level was set to α=0.05. MedCalc statistical software (version 16.2.0, MedCalc Software bvba, Ostend, Belgium) was used on statistical analysis. GraphPad Prism software (version 6, GraphPad Software, Inc., USA) was used to make the figures.
Compliance with ethical standards
An informed consent was obtained from all patients included in the study. The study obtained approval from local ethics committees, the Ethics Committee of the Osijek University Hospital Centre (25-1:15401-3/2013) and Ethics Committee of the Faculty of Medicine, Josip Juraj Strossmayer University in Osijek (2158-61-07-15-125), and was performed in accordance with the ethical standards laid down in the 1964 Declaration of Helsinki.
Results
Patient population and clinicopathologic characteristics
The study included 122 patients, age median 62 years (interquartile range 45-74 years), ranging from 18 to 88 years of age. Thirty-one (25%) patients had benign tumor (fibroadenomas) and 91 (75%) had malignant tumor. The subjects with malignant tumors were considerably older, age median 68 years (interquartile range 57-76 years; p<0.001). Body mass index (BMI) was considerably higher in the group of subjects with malignant tumors as compared to subjects with benign tumors (fibroadenoma). Within the malignant group, 78 (85.7%) tumors were hormone receptor-positive and 13 (14.3%) tumors were hormone receptor-negative. According to the St. Gallen consensus, there were 20 (22%) Lum A, 58 (63.7%) Lum B, 4 (4.4%) Her 2 positive and 9 (9.9%) triple negative tumors (Table 3). Within the malignant group, 50 (54.9%) subjects had metastases in lymph nodes, whereas 41 (45.1%) subjects did not have metastases in lymph nodes. Histologic differentiation grade, Ki67 level of expression and other pathologic characteristics of the samples are presented in Table 3.
Table 3. Patient and clinicopathologic characteristics.
| Patient characteristics | ||||
|---|---|---|---|---|
| Benign group | Malignant group | Total | p value | |
| n | 31 | 91 | 122 | |
| Age (yrs) | 32 (26-43) |
68 (57-76) |
62 (45-74) |
<0.001* |
| BMI | 21.8 (20.4-26.2) |
26.9 (24.2-30.5) |
25.9 (22-29.08) |
0.002* |
| Menopause | 5/31 (16.1%) | 80/91 (87.9%) | 85/122(69.7%) | <0.0011** |
| Pathologic characteristics | ||||
| Tumor type (St. Gallen consensus) | ||||
| Malignant tumors | Luminal A | 20/91 (22%) | ||
| Luminal B | 58/91 (63.7%) | |||
| Her 2 positive | 4/91 (4.40%) | |||
| Triple negative | 9/91 (9.90%) | |||
| Metastasis | ||||
| Malignant tumors | Lymph node negative | 50/91 (54.9%) | ||
| Lymph node positive | 41/91 (45.1%) | |||
| Tumor differentiation | ||||
| Malignant tumors | Well-differentiated tumors (grade I) |
22 (24.2%) | ||
| Moderately differentiated tumors (grade II) | 42 (46.2%) | |||
| Poorly differentiated tumors (grade III) |
27 (29.7%) | |||
| Ki67 (%) | ||||
| Malignant tumors | Low (0-15%) |
10 (11%) | ||
| Moderate (16%-30%) |
28 (30.8%) | |||
| High (31%-100%) |
53 (58.2%) | |||
n = number of patients; BMI = body mass index; *Mann Whitney U test, data are presented as median and interquartile range limits, p<0.05 was considered significant; **Fisher exact test, p<0.05 was considered significant
TFF gene expression
The expression of TFF1 mRNA was substantially higher in the benign tumor group consisting of subjects with fibroadenomas compared to subjects from the malignant group (p=0.048) (Fig. 1, panel A). Our study revealed a very low level of TFF2 mRNA expression in benign breast tumors and extremely low TFF2 expression in malignant breast tumors, thus TFF2 was not expressed (Fig. 7, panel A). TFF3 mRNA expression was higher in the malignant tumor group, but statistically significant difference was not noted (p=0.44) (Fig. 1, panel A). Within the malignant group, both TFF1 and TFF3 were expressed more strongly in the hormone receptor-positive tumor group (Fig. 1, panel B), but only TFF3 exhibited a statistically significant mRNA expression difference (p=0.004) (Fig. 1, panel B). Comparing the results between the groups defined according to St. Gallen consensus, we found that TFF1 was expressed most strongly in Lum A subgroup and TFF3 was most strongly expressed in Lum B subgroup (p=0.17 and p=0.005, respectively) (Fig. 1, panel C). TFF1 and TFF3 expression was higher in subjects with tumors that did not have metastases in lymph nodes (Fig. 1, panel D).
Fig. 1.

Distribution of TFF1 and TFF3 mRNA expression in benign (B) and malignant (M) breast tumors (panel A); hormone receptor-positive (HR+) and hormone receptor-negative (HR-) malignant breast tumors (panel B); malignant tumor subgroups according to St. Gallen consensus (panel C); and breast tumors with metastases in lymph nodes (Pos) and without lymph node metastases (Neg) (panel D). The test group comprised of 91 malignant and 31 benign (fibroadenomas) surgically removed human breast tumors. Relative mRNA expression was measured by qRT- PCR; all measured genes were normalized to expression of Actin beta (ACTB) gene. Data are presented as median and interquartile range limits, horizontal bars represent the median, boxes indicate the range of the third and second quartiles, and whiskers represent extreme values of all data. Expression of TFF1 was significantly higher in benign tumors (Mann Whitney U test, p=0.048) and lymph node negative tumors (Mann Whitney U test, p=0.043), while the levels of TFF3 mRNA were significantly higher in HR+ tumors (Mann Whitney U test, p=0.004) and Lum B tumors (Kruskal Walis test, p=0.005); *p<0.05 was considered significant.
Fig. 7.

Distribution of TFF2 mRNA expression in benign (B) (fibroadenomas) and malignant (M) breast tumors. The test group comprised of 91 malignant and 31 benign (fibroadenomas) surgically removed human breast tumors. Relative mRNA expression was measured by qRT- PCR; all measured genes were normalized to expression of Actin beta (ACTB) gene. Data are presented as median and interquartile range limits, horizontal bars represent the median, boxes indicate the range of the third and second quartiles, and whiskers represent extreme values of all data. The level of TFF2 mRNA expression in benign breast tumors (B) was very low while in malignant tumors (M) TFF2 mRNA was not expressed (panel A). Expression of TFF2 protein in breast tumors: the test group comprised of 60 malignant human breast tumors and 15 benign (fibroadenomas) human breast tumors, surgically removed. Tumor tissues were collected intraoperatively, formalin-fixed, paraffin-embedded, and analyzed by immunohistochemistry. Representative examples of immunoreaction with gastric mucosa as positive control for TFF2 (PC), fibroadenoma (F), Luminal A (LA), Luminal B (LB), Her2 positive (H) and triple negative (TN) malignant subgroups are shown. None of the tumor tissue subgroups, irrespective of malignancy, exhibited TFF2 protein expression. Scale bar, 300 µm (panel B).
Strong positive correlation between TFF1 and TFF3 was recorded within the malignant tumor group (p<0.001; ρ=0.731) (Fig. 2, panel A) and it was even more prominent in the hormone receptor-positive malignant tumor subgroup (p<0.001; ρ=0.747) (Fig. 2, panel B).
Fig. 2.

Correlation between TFF1 and TFF3 mRNA expression within the malignant group (panel A); hormone receptor-positive (HR+) and hormone receptor-negative (HR-) malignant tumor subgroups (panel B); and malignant tumor subgroups defined by histologic differentiation grade: I (good), II (moderate) and III (poor) (panel C). Strong positive correlation was observed between TFF1 and TFF3 in malignant tumor group (Spearman rank correlation; p<0.001, ρ=0.731), in HR+ tumor subgroup (Spearman rank correlation; p<0.001, ρ=0.747) and in tumor subgroups with good histologic differentiation (Spearman rank correlation; p<0.001, ρ=770); *p<0.05 was considered significant.
Comparing the results between the malignant subgroups defined according to tumor histologic differentiation grade, a significant difference in the expression of TFF1 and TFF3 mRNA was observed. The moderately differentiated tumor subgroup (grade II) had the highest TFF1 and TFF3 expression, while the poorly differentiated tumor group (grade III) had the lowest expression (p=0.008 and p=0.001, respectively) (Fig. 3, panel A). Strong positive correlation between TFF1 and TFF3 was found in all three subgroups defined by tumor histologic differentiation grade, but was strongest in well-differentiated tumors (grade I) (p<0.001; ρ=0.770) (Fig. 2, panel C).
Fig. 3.

Distribution of TFF1 and TFF3 mRNA expression depending on histologic tumor grade differentiation: good (I), moderate (II) and poor (III) (panel A) and depending on the expression of proliferation marker Ki67 (%): low, moderate and high (panel B) within the malignant group of breast tumors. The test group comprised of 91 surgically removed malignant human breast tumors. Relative mRNA expression was measured by qRT-PCR; all measured genes were normalized to expression of Actin beta (ACTB) gene. Data are presented as median and interquartile range limits, horizontal bars represent the median, boxes indicate the range of the third and second quartiles, and whiskers represent extreme values of all data. Expression of both TFF1 and TFF3 mRNA was highest in the moderately differentiated (II) tumor subgroup (Kruskal Wallis test, p=0.008 and p=0.001, respectively) and in tumor subgroup with moderately high expression of Ki-67 (Kruskal Wallis test, p=0.19 and p=0.35, respectively); *p<0.05 was considered significant.
When classifying malignant tumors according to the level of Ki67 expression, the highest expression of TFF1 and TFF3 was measured in the group of tumors with moderately high expression of Ki-67 (Fig. 3, panel B). Even though the results did not yield a statistically significant difference in mRNA expression between the subgroups, a mild negative correlation was observed for Ki67 with TFF1 and TFF3 in the malignant group. As Ki67 expression increased, the expression of TFF1 (p=0.028; ρ=-0.248) (Fig. 4, panel A) and TFF3 (p=0.011; ρ=-0.285) (Fig. 4, panel B) decreased significantly. The most prominent correlation was recorded between Ki67 and TFF3 in the hormone receptor-negative tumor subgroup (p=0.03; ρ=-0.629) (Fig. 4, panel C).
Fig. 4.

Correlation between TFF1 mRNA expression and expression of proliferation marker Ki67 (%) within the malignant tumor group (panel A), TFF3 mRNA expression and expression of Ki67 (%) within the malignant tumor group (panel B) and correlation between TFF3 mRNA expression and expression of Ki67 (%) in the hormone receptor-positive (HR+) and in the hormone receptor-negative (HR-) malignant tumor subgroup (panel C). Mild negative correlation was observed between TFF1 and Ki67 and between TFF3 and Ki67 within the malignant tumor group (Spearman rank correlation; p=0.028; ρ=-0.248 and p=0.011; ρ=-0.285, respectively) and strong negative correlation between TFF3 and Ki67 within HR-tumor subgroup (Spearman rank correlation; p=0.03; ρ=-0.629); *p<0.05 was considered significant.
TFF protein expression
The immunohistochemical signal of TFF1 and TFF3 proteins was visible in the cytoplasm of tumor cells and there was no evidence of nuclear immunoreaction (Fig. 5). TFF1 protein expression was higher in the benign tumor group (p<0.001) (Fig. 6, panel A), whereas TFF3 protein expression was higher in the malignant tumor group (p<0.001) (Fig. 6, panel A). None of the tumor tissue subgroups, irrespective of malignancy, exhibited TFF2 protein expression (Fig. 7, panel B). Comparing the results between the subgroups defined according to the St. Gallen consensus, Lum A and Lum B tumor subgroups had the highest TFF1 protein expression (p<0.001) (Fig. 5, TFF1; Fig. 6, panel B). TFF3 protein expression was highest in Lum B tumor subgroup (p<0.001) (Fig. 5, TFF3; Fig. 6, panel B). The Her2 positive and triple negative tumor subgroups had the lowest expression of both TFF1 and TFF3 proteins.
Fig. 5.
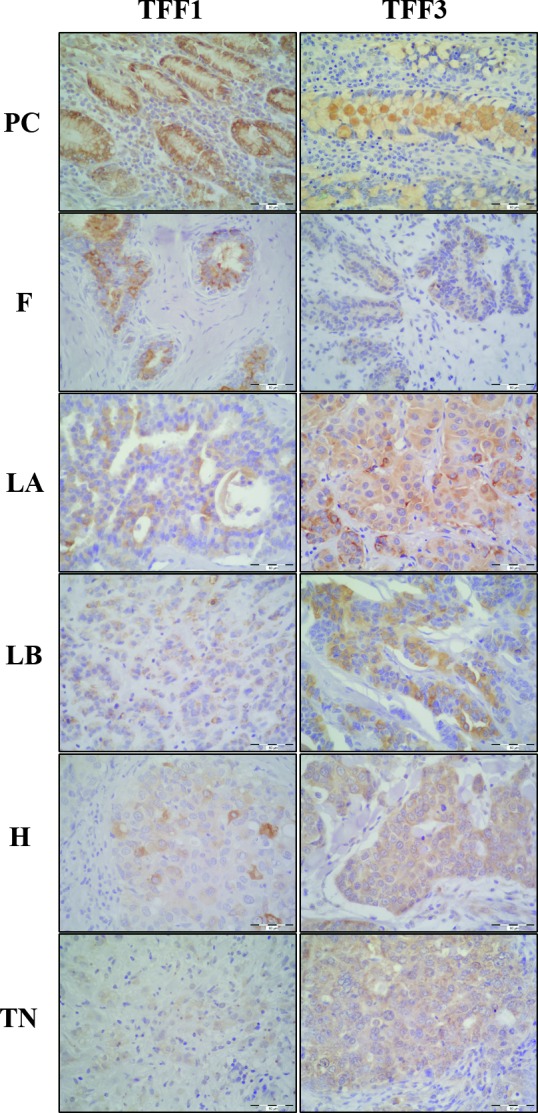
Expression of TFF1 and TFF3 proteins in breast tumors. The test group comprised of 60 malignant human breast tumors and 15 benign (fibroadenomas) human breast tumors, surgically removed. Tumor tissues were collected intraoperatively, formalin-fixed, paraffin-embedded, and analyzed by immunohistochemistry. The immunohistochemical signal is visible in the cytoplasm of tumor cells. Representative examples of immunoreaction with gastric mucosa as positive control for TFF1 and colon mucosa for TFF3 (PC), fibroadenoma (F), Luminal A (LA), Luminal B (LB), Her2 positive (H) and triple negative tumors (TN) are shown. Scale bar, 60 µm.
Fig. 6.

Distribution of TFF1 and TFF3 protein expression in benign (B) and malignant (M) breast tumors (panel A) and malignant tumor subgroups according to St. Gallen consensus (panel B). The test group comprised of 60 malignant human breast tumors and 15 benign (fibroadenomas) human breast tumors, surgically removed. Protein expression was assessed by immunohistochemistry and histomorphological analysis was performed using the modified Quick Score method. Data are presented as median and interquartile range limits, horizontal bars represent the median, boxes indicate the range of the third and second quartiles, and whiskers represent extreme values of all data. Expression of TFF1 was significantly higher in benign tumors (Mann Whitney U test, p<0.001), while the expression of TFF3 was significantly higher in malignant tumors (Mann Whitney U test, p=0.001). According to the St. Gallen consensus subgroups, significantly highest TFF1 expression was in Luminal A and Luminal B tumor subgroups (Kruskal Wallis test, p<0.001) and significantly highest TFF3 expression was in Luminal B tumor subgroup (Kruskal Wallis test, p=0.001); *p<0.05 was considered significant.
Discussion
In the present study, we examined the expression of all three TFF genes and TFF proteins in breast tumor tissue and compared them according to tumor malignancy, differentiation grade, marker of cell proliferation (Ki67), and tendency to produce metastases in axillary lymph nodes. Expression of TFF genes was measured by qRT-PCR from total RNA isolated from tissue samples which had heterogeneous cell population; to make sure that the vast amount of measured mRNA was from tumor tissue, protein products of those genes were located by immunohistochemistry. Correlations between TFF within the tumor subgroups, and correlations of TFF with Ki67 and tumor differentiation grade were also examined.
TFF1
Many in vitro and in vivo studies of TFF1 gene and TFF1 protein have been performed in the past, however, scientists have not yet agreed about the role of TFF1 protein in tumor tissue, and whether its action is pro-oncogenic or protective.
This study showed that TFF1 levels were higher in the benign group (fibroadenomas) compared to malignant tumors. When TFF1 levels were compared between malignant tumor subgroups defined by the St. Gallen consensus, we found the highest TFF1 expression in Lum A and Lum B groups, both hormone receptor-positive tumors, which have a higher survival rate than hormone receptor-negative tumors (37). In the subgroups according to the lymph node status, TFF1 levels were higher in tumors without metastases in lymph nodes, also characterized by higher survival rate (38). Our findings are in line with the results from several previous studies indicating a high level of TFF1 gene expression in breast tumors as a biomarker of good prognosis, in spite of the fact that different molecular methods and different tumor classifications and models were used (18, 19). The study by Buache et al. demonstrated that TFF1 knock-out mice had a higher incidence and larger mammary cancers than wild-type mice, and in vitro experiment, performed in the same study, on estrogen receptor-positive and estrogen receptor-negative cell lines showed that TFF1 protein did not have oncogenic qualities (18). Similarly, the study by Corte et al. showed that high cytosolic levels of TFF1 were associated with better clinical outcome and prolonged overall survival (19). Even though the expression of TFF1 mRNA in our study was highest in tumors with moderately high Ki67 expression, the lowest values were measured in the tumor subgroup with high expression of Ki67. Results of TFF1 protein expression reflected our findings on the TFF1 gene expression analysis. Additionally, analysis of the correlation between TFF1 gene and Ki67 showed that the expression of TFF1 decreased as Ki67 increased. Such findings support the thesis that the higher expression of TFF1 means better prognosis for breast tumor patients, as it is known that the malignancy of a tumor increases as Ki67 increases (39).
TFF2
Our results showed a very low level of TFF2 mRNA expression in benign breast tumor samples and almost no expression in malignant breast tumors. Consistently, immunohistochemical analysis did not reveal TFF2 protein expression in a single sample. Our results are in accordance with the results of several previous studies that detected TFF2 gene expression in breast tumor cell lines, but not in human tissue (22, 23, 40). The observed difference between in vivo and in vitro experiments could be due to the greater number of parameters influencing regulation, expression and role of TFF2 gene and protein in in vivo conditions. Based on our findings, TFF2 gene and TFF2 protein have very poor potential as biomarkers for breast tumor assessment.
TFF3
In this study, TFF3 was expressed in all tumor samples, but the highest expression was found in malignant tumors, unlike TFF1, which was highly expressed in benign tumors (fibroadenomas). The highest level of TFF3 expression among the malignant tumor subgroups (defined according to St. Gallen consensus) was in Lum B group, which is a hormone receptor-positive tumor subgroup. Additionally, the highest level of TFF3 expression was detected in grade I and grade II tumors, which conforms to the studies by Ahmed et al. and May and Westley, who found that TFF3 expression was higher in grade I tumors and in tumors with estrogen and progesterone receptor expression (26, 43). When the expression was compared among the subgroups with different levels of Ki67 expression, the highest TFF3 expression was observed in the tumor subgroup with moderately high Ki67 expression. The TFF3 mRNA levels were higher in tumors without metastases in lymph nodes than in tumors that had spread into local or distant lymph nodes. These results are in contrast to the findings of the studies by Ahmed et al. and Pandey et al. (26, 29). The study by Ahmed et al., based on multivariate binary logistic regression analysis of several clinicopathologic features and molecular biomarkers, concluded that the higher expression of TFF3 protein could be a metastatic tumor dissemination predictor (26). Similarly, Pandey et al. conclude, based on TFF protein analysis in breast tumors, that the TFF3 protein expression is significantly associated with lymph node metastasis and stimulates cellular invasion, and is therefore a metastatic tumor dissemination predictor (29). Strong positive correlation between TFF1 and TFF3, especially in tumors with a lower degree of malignancy, are consistent with the findings that TFF1 and TFF3 have the same controlling mechanisms, such as estrogen responsiveness (41, 42). Our findings of negative correlation between TFF3 and Ki67 and positive correlation between TFF3 and TFF1 in hormone receptor-negative tumors suggested that the patients diagnosed with hormone receptor-negative tumors with high levels of TFF3 expression could also benefit from endocrine therapy because it is known that both TFF1 and TFF3 genes are regulated by estrogen (41, 42). This is further supported in the study by May and Westley, showing that TFF3 expression is an independent predictive biomarker of both estrogen response and degree of response (43). Consistently to previous findings, we demonstrated that the expression of TFF3 protein corresponded to the TFF3 mRNA expression.
In this study, we demonstrated the presence of TFF1 and TFF3 mRNA and their corresponding protein products in the investigated breast tumors with variable expression levels among different tumor subgroups, while the TFF2 mRNA and TFF2 protein levels were low or undetectable. Our results suggest that TFF1 and TFF3, unlike TFF2, may have a role in breast tumor pathogenesis and could be used in the assessment of tumor malignancy only in particular breast tumor subgroups. Increased expression of TFF1 could be used as a potential biomarker indicating a good prognosis, while TFF3 could be helpful in tumor status assessment; however, additional in vivo studies are needed to reach an agreement on the exact clinical impact of TFF molecules and their activity in breast tumor tissues.
References
- 1.Ferlay J, Soerjomataram I, Dikshit R, Eser S, Mathers C, Rebelo M, et al. Cancer incidence and mortality worldwide: sources, methods and major patterns in GLOBOCAN 2012. Int J Cancer. 2015;136(5):E359–86. 10.1002/ijc.29210 [DOI] [PubMed] [Google Scholar]
- 2.Rosen PP, Hoda SA, Brogi E, Koerner FC. Rosen’s Breast Pathology, 4th edn. Lippincott Williams & Wilkins, Philadelphia; 2014. [Google Scholar]
- 3.Gnant M, Harbeck N, St. Thomssen C. Gallen 2011: Summary of the Consensus Discussion. Breast Care (Basel). 2011;6(2):136–41. 10.1159/000328054 [DOI] [PMC free article] [PubMed] [Google Scholar]
- 4.Falck AK, Fernö M, Bendahl PO, Rydén L. St Gallen molecular subtypes in primary breast cancer and matched lymph node metastases – aspects on distribution and prognosis for patients with luminal A tumours: results from a prospective randomised trial. BMC Cancer. 2013;13:558. 10.1186/1471-2407-13-558 [DOI] [PMC free article] [PubMed] [Google Scholar]
- 5.Stopeck AT, Brown-Glaberman U, Wong HY, Park BH, Barnato SE, Gradishar WJ, et al. The role of targeted therapy and biomarkers in breast cancer treatment. Clin Exp Metastasis. 2012;29(7):807–19. 10.1007/s10585-012-9496-y [DOI] [PubMed] [Google Scholar]
- 6.Hoffmann W, Jagla W, Wiede A. Molecular medicine of TFF-peptides: from gut to brain. Histol Histopathol. 2001;16(1):319–34. 10.14670/HH-16.319 [DOI] [PubMed] [Google Scholar]
- 7.Madsen J, Nielsen O, Tornøe I, Thim L, Holmskov U. Tissue localization of human trefoil factors 1, 2, and 3. J Histochem Cytochem. 2007;55(5):505–13. 10.1369/jhc.6A7100.2007 [DOI] [PubMed] [Google Scholar]
- 8.Williams GR, Wright NA. Trefoil factor family domain peptides. Virchows Arch. 1997;431(5):299–304. 10.1007/s004280050102 [DOI] [PubMed] [Google Scholar]
- 9.Regalo G, Wright NA, Machado JC. Trefoil factors: from ulceration to neoplasia. Cell Mol Life Sci CMLS. 2005;62(24):2910–5. 10.1007/s00018-005-5478-4 [DOI] [PMC free article] [PubMed] [Google Scholar]
- 10.Perry JK, Kannan N, Grandison PM, Mitchell MD, Lobie PE. Are trefoil factors oncogenic? Trends Endocrinol Metab TEM. 2008;19(2):74–81. 10.1016/j.tem.2007.10.003 [DOI] [PubMed] [Google Scholar]
- 11.Belovari T, Bijelić N, Levak MT, Lončar MB. Trefoil factor family peptides TFF1 and TFF3 in the nervous tissues of developing mouse embryo. Bosn J Basic Med Sci. 2015;15(1):33–7. 10.17305/bjbms.2015.251 [DOI] [PMC free article] [PubMed] [Google Scholar]
- 12.Busch M, Dünker N. Trefoil factor family peptides – friends or foes? Biomol Concepts. 2015;6(5-6):343–59. 10.1515/bmc-2015-0020 [DOI] [PubMed] [Google Scholar]
- 13.Prest SJ, May FEB, Westley BR. The estrogen-regulated protein, TFF1, stimulates migration of human breast cancer cells. FASEB J. 2002;16(6):592–4. 10.1096/fj.01-0498fje [DOI] [PubMed] [Google Scholar]
- 14.Amiry N, Kong X, Muniraj N, Kannan N, Grandison PM, Lin J, et al. Trefoil factor-1 (TFF1) enhances oncogenicity of mammary carcinoma cells. Endocrinology. 2009;150(10):4473–83. 10.1210/en.2009-0066 [DOI] [PubMed] [Google Scholar]
- 15.Smid M, Wang Y, Klijn JGM, Sieuwerts AM, Zhang Y, Atkins D, et al. Genes associated with breast cancer metastatic to bone. J Clin Oncol. 2006;24(15):2261–7. 10.1200/JCO.2005.03.8802 [DOI] [PubMed] [Google Scholar]
- 16.Crosier M, Scott D, Wilson RG, Griffiths CD, May FE, Westley BR. High expression of the trefoil protein TFF1 in interval breast cancers. Am J Pathol. 2001;159(1):215–21. 10.1016/S0002-9440(10)61687-2 [DOI] [PMC free article] [PubMed] [Google Scholar]
- 17.Foekens JA, van Putten WL, Portengen H, de Koning HY, Thirion B, Alexieva-Figusch J, et al. Prognostic value of PS2 and cathepsin D in 710 human primary breast tumours: multivariate analysis. J Clin Oncol. 1993;11(5):899–908. 10.1200/JCO.1993.11.5.899 [DOI] [PubMed] [Google Scholar]
- 18.Buache E, Etique N, Alpy F, Stoll I, Muckensturm M, Reina-San-Martin B, et al. Deficiency in trefoil factor 1 (TFF1) increases tumorigenicity of human breast cancer cells and mammary tumour development in TFF1-knockout mice. Oncogene. 2011;30(29):3261–73. 10.1038/onc.2011.41 [DOI] [PMC free article] [PubMed] [Google Scholar]
- 19.Corte MD, Tamargo F, Alvarez A, Rodríguez JC, Vázquez J, Sánchez R, et al. Cytosolic levels of TFF1/pS2 in breast cancer: their relationship with clinical-pathological parameters and their prognostic significance. Breast Cancer Res Treat. 2006;96(1):63–72. 10.1007/s10549-005-9041-7 [DOI] [PubMed] [Google Scholar]
- 20.Surowiak P, Materna V, Györffy B, Matkowski R, Wojnar A, Maciejczyk A, et al. Multivariate analysis of oestrogen receptor alpha, pS2, metallothionein and CD24 expression in invasive breast cancers. Br J Cancer. 2006;95(3):339–46. 10.1038/sj.bjc.6603254 [DOI] [PMC free article] [PubMed] [Google Scholar]
- 21.Poulsom R, Hanby AM, Lalani EN, Hauser F, Hoffmann W, Stamp GW. Intestinal trefoil factor (TFF 3) and pS2 (TFF 1), but not spasmolytic polypeptide (TFF 2) mRNAs are co-expressed in normal, hyperplastic, and neoplastic human breast epithelium. J Pathol. 1997;183(1):30–8. 10.1002/(SICI)1096-9896(199709)183:1<30::AID-PATH1085>3.0.CO;2-K [DOI] [PubMed] [Google Scholar]
- 22.May FEB, Semple JI, Prest SJ, Westley BR. Expression and motogenic activity of TFF2 in human breast cancer cells. Peptides. 2004;25(5):865–72. 10.1016/j.peptides.2003.12.024 [DOI] [PubMed] [Google Scholar]
- 23.Lalani EN, Williams R, Jayaram Y, Gilbert C, Chaudhary KS, Siu LS, et al. Trefoil factor-2, human spasmolytic polypeptide, promotes branching morphogenesis in MCF-7 cells. Lab Invest. 1999;79(5):537–46. [PubMed] [Google Scholar]
- 24.Siu LS, Romanska H, Abel PD, Baus-Loncar M, Kayademir T, Stamp GWH, et al. TFF2 (trefoil family factor 2) inhibits apoptosis in breast and colorectal cancer cell lines. Peptides. 2004;25(5):855–63. 10.1016/j.peptides.2003.11.023 [DOI] [PubMed] [Google Scholar]
- 25.Chi AL, Lim S, Wang TC. Characterization of a CCAAT-enhancer element of trefoil factor family 2 (TFF2) promoter in MCF-7 cells. Peptides. 2004;25(5):839–47. 10.1016/j.peptides.2003.11.022 [DOI] [PubMed] [Google Scholar]
- 26.Ahmed ARH, Griffiths AB, Tilby MT, Westley BR, May FEB. TFF3 is a normal breast epithelial protein and is associated with differentiated phenotype in early breast cancer but predisposes to invasion and metastasis in advanced disease. Am J Pathol. 2012;180(3):904–16. 10.1016/j.ajpath.2011.11.022 [DOI] [PubMed] [Google Scholar]
- 27.Emami S, Rodrigues S, Rodrigues CM, Le Floch N, Rivat C, Attoub S, et al. Trefoil factor family (TFF) peptides and cancer progression. Peptides. 2004;25(5):885–98. 10.1016/j.peptides.2003.10.019 [DOI] [PubMed] [Google Scholar]
- 28.Lau WH, Pandey V, Kong X, Wang XN, Wu Z, Zhu T, et al. Trefoil factor-3 (TFF3) stimulates de novo angiogenesis in mammary carcinoma both directly and indirectly via IL-8/CXCR2. PLoS One. 2015;10(11):e0141947. 10.1371/journal.pone.0141947 [DOI] [PMC free article] [PubMed] [Google Scholar]
- 29.Pandey V, Wu ZS, Zhang M, Li R, Zhang J, Zhu T, et al. Trefoil factor 3 promotes metastatic seeding and predicts poor survival outcome of patients with mammary carcinoma. Breast Cancer Res. 2014;16(5):429. 10.1186/s13058-014-0429-3 [DOI] [PMC free article] [PubMed] [Google Scholar]
- 30.Utrera-Barillas D, Valdez-Salazar HA, Gómez-Rangel D, Alvarado-Cabrero I, Aguilera P, Gómez-Delgado A, et al. Is human cytomegalovirus associated with breast cancer progression? Infect Agent Cancer. 2013;8(1):12. 10.1186/1750-9378-8-12 [DOI] [PMC free article] [PubMed] [Google Scholar]
- 31.Rakha EA, Reis-Filho JS, Baehner F, Dabbs DJ, Decker T, Eusebi V, et al. Breast cancer prognostic classification in the molecular era: the role of histological grade. Breast Cancer Res. 2010;12(4):207. 10.1186/bcr2607 [DOI] [PMC free article] [PubMed] [Google Scholar]
- 32.Loncar MB, Al-azzeh E, Sommer PSM, Marinovic M, Schmehl K, Kruschewski M, et al. Tumour necrosis factor alpha and nuclear factor kappa B inhibit transcription of human TFF3 encoding a gastrointestinal healing peptide. Gut. 2003;52(9):1297–303. 10.1136/gut.52.9.1297 [DOI] [PMC free article] [PubMed] [Google Scholar]
- 33.Wang H, Yanga B, Gengb T, Li B, Dai P, Chen C. Tissue-specific selection of optimal reference genes for expression analysis of anti-cancer drug-related genes in tumor samples using quantitative real-time RT-PCR. Exp Mol Pathol. 2015;98(3):375–81. 10.1016/j.yexmp.2014.10.014 [DOI] [PubMed] [Google Scholar]
- 34.Bijelić N, Belovari T, Tolušić Levak M, Lončar MB. Localization of trefoil factor family peptide 3 (TFF3) in epithelial tissues originating from the three germ layers of developing mouse embryo. Bosn J Basic Med Sci. 2017;17(3):241–7. 10.17305/bjbms.2017.1838 [DOI] [PMC free article] [PubMed] [Google Scholar]
- 35.Mudduwa L, Liyanage T. Immunohistochemical assessment of hormone receptor status of breast carcinoma: interobserver variation of the quick score. Indian J Med Sci. 2009;63(1):21–7. 10.4103/0019-5359.49078 [DOI] [PubMed] [Google Scholar]
- 36.Detre S, Saclani Jotti G, Dowsett MA. “quickscore” method for immunohistochemical semiquantitation: validation for oestrogen receptor in breast carcinomas. J Clin Pathol. 1995;48(9):876–8. 10.1136/jcp.48.9.876 [DOI] [PMC free article] [PubMed] [Google Scholar]
- 37.Goldhirsch A, Winer EP, Coates AS, Gelber RD, Piccart-Gebhart M, Thürlimann B, et al. Personalizing the treatment of women with early breast cancer: highlights of the St Gallen International Expert Consensus on the Primary Therapy of Early Breast Cancer 2013. Ann Oncol. 2013;24(9):2206–23. 10.1093/annonc/mdt303 [DOI] [PMC free article] [PubMed] [Google Scholar]
- 38.Chagpar A, Middleton LP, Sahin AA, Meric-Bernstam F, Kuerer HM, Feig BW, et al. Clinical outcome of patients with lymph node-negative breast carcinoma who have sentinel lymph node micrometastases detected by immunohistochemistry. Cancer. 2005;103(8):1581–6. 10.1002/cncr.20934 [DOI] [PubMed] [Google Scholar]
- 39.Abubakar M, Orr N, Daley F, Coulson P, Ali HR, Blows F, et al. Prognostic value of automated KI67 scoring in breast cancer: a centralised evaluation of 8088 patients from 10 study groups. Breast Cancer Res. 2016. Oct 18;18(1):104. 10.1186/s13058-016-0765-6 [DOI] [PMC free article] [PubMed] [Google Scholar]
- 40.Ishibashi Y, Hiroshi O, Ikemura M, Kikuchi Y, Niwa T, Nishioka K, et al. Serum TFF1 and TFF3 but not TFF2 are higher in women with breast cancer than in women without breast cancer. Sci Rep. 2017;7(1):4846. 10.1038/s41598-017-05129-y [DOI] [PMC free article] [PubMed] [Google Scholar]
- 41.Berry M, Nunez AM, Chambon P. Estrogen-responsive element of the human pS2 gene is an imperfectly palindromic sequence. Proc Natl Acad Sci USA. 1989;86(4):1218–22. 10.1073/pnas.86.4.1218 [DOI] [PMC free article] [PubMed] [Google Scholar]
- 42.May FE, Westley BR. Expression of human intestinal trefoil factor in malignant cells and its regulation by oestrogen in breast cancer cells. J Pathol. 1997;182(4):404–13. 10.1002/(SICI)1096-9896(199708)182:4<404::AID-PATH875>3.0.CO;2-0 [DOI] [PubMed] [Google Scholar]
- 43.May FEB, Westley BR. TFF3 is a valuable predictive biomarker of endocrine response in metastatic breast cancer. Endocr Relat Cancer. 2015;22(3):465–79. 10.1530/ERC-15-0129 [DOI] [PMC free article] [PubMed] [Google Scholar]