

Abstract
Pancreatic cancer is a highly lethal malignancy. Lack of early diagnostic markers makes timely detection of pancreatic cancer a highly challenging endeavor. Exosomes have emerged as information-rich cancer specific biomarkers. However, characterization of tumor-specific exosomes has been challenging. This study investigated the proof of principle that exosomes could be used for the detection of pancreatic cancer. Label-free analysis of exosomes purified from normal and pancreatic cancer cell lines was performed using surface enhanced Raman Spectroscopy (SERS) and principal component differential function analysis (PC-DFA), to identify tumor-specific spectral signatures. This method differentiated exosomes originating from pancreatic cancer or normal pancreatic epithelial cell lines with 90% accuracy. The cell line trained PC-DFA algorithm was next applied to SERS spectra of serum-purified exosomes. This method exhibited up to 87% and 90% predictive accuracy for HC and EPC individual samples, respectively. Overall, our study identified utility of SERS spectral signature for deciphering exosomal surface signature.
Keywords: Pancreatic cancer, Liquid biopsy, Exosome, Surface enhanced Raman spectroscopy, Label-free
Pancreatic cancer is characterized by insidious onset and relentless progression. According to the American Cancer Society (ACS), this disease is the third-leading cause of cancer death in both men and women, with an estimated 44,330 deaths in 2018.1 As per ACS statistics, for all pancreatic cancer diagnoses, the five-year survival rate is 8% and falls to 3% when the diagnosis is made after metastasis has occurred.1
The only curative option for this lethal malignancy is surgical resection. Surgical resection of the primary tumor, before it has given off metastases, confers the largest increase in overall patient survival.2 Unfortunately, surgery is often not possible. At the time of initial discovery, primary tumors have often locally invaded to the point of being nonresectable and/or have produced metastases. The primary reason for this is the predominantly asymptomatic nature of the early disease. Congruently, symptoms, when present, are mild and ambiguous such as nausea, malaise and right upper quadrant pain.3 Only in later stages do patients experience more dramatic clinical symptoms such as jaundice, cachexia, and migratory phlebitis. Thus, it is important to develop non-invasive and label-free tools for the early detection of pancreatic cancer. A liquid biopsy based tumor biomarker for the screening and early diagnosis of pancreatic cancer is a promising area of research that could change the outcome of this lethal malignancy and improve patient survival.
Among a variety of serum-based cancer markers put forth as possible means of pancreatic cancer detection,4 exosomes are highly sought after and valuable targets. Exosomal genesis begins as vesiculation of late endosomes. They are a product of the inward pinching of the endosomal membrane and subsequently released to the extracellular space via direct fusion with the external cellular membrane.5 Inherent in this mechanism of creation is that the intravesicular contents of exosomes mirror the cell of origin. A variety of functions have been attributed to exosomes including intercellular communication,6 pathogen transmission,7 and immune response induction.8 Recently, the functional capabilities of exosomes have been extended to include a role in the progression and metastasis of various cancers.9–11 Because of this, many investigators have begun to examine the potential of exosomes as cancer markers.12–15
A portion of circulating RNA and DNA (extracellular nucleic acids found in serum) is located within these membrane-bound vesicles, and studies have focused on their genomic profiles.16,17 Further, these vesicles are easily accessible via non-invasive liquid biopsies involving saliva, blood, urine, breast milk, and ascitic fluid.18,19 The available exosome characterization technologies including ELISA, immunoblotting, and electron microscopy require intensely concentrated samples and exceedingly high yield to be accurate. In conjunction, the characterization of the entire exosomal pool from plasma that contains exosomes from both normal and malignant cells introduces another layer of complexity for the molecular profiling of cancer specific exosomes. Consequently, the present approaches limit the diagnostic potential of exosomes for assessment of tumor diagnosis and prognosis. New techniques are being investigated for better characterization and analysis of cancer-derived exosomes to distinguish them from those of normal physiologic origin.
One technique with unique attributes that makes it a promising candidate for exosome analysis is Raman spectroscopy.20 This is a vibrational technique that measures inelastically scattered photons after a sample interacts with incoming monochromatic laser light. These photons change their energy by exciting vibrational modes of molecules. The result is a Raman spectrum that corresponds with known vibrations of specific chemical groups. Such a spectrum can accurately identify the molecular composition of a sample. Of great importance is that Raman spectroscopy is a label-free and a non-destructive technique. This holds a translational advantage in that immediate analysis of exosomes is possible without undue risk for the patient or long waiting periods. Raman scattering can also provide a unique signature based on the molecular composition of a sample. Hence, this method can differentiate exosomes as a function of the membrane lipid/protein content along with other various surface modifications. Finally, the Raman signal can be enhanced by several orders of magnitude by employing noble metal nanoparticles (Au/Ag) or rough nano-structures. As a result, only a small concentration of exosomes in a sample is needed for the detection and analysis.
The primary limitation of this method is weak Raman scattering efficiency (lower than 1 in 107 photons). In the presence of surface plasmon on metallic (usually Au or Ag) nanoparticles or nanostructured surfaces, Raman signals can be significantly enhanced. This phenomenon is called surface enhanced Raman scattering and the technique is called surface enhanced Raman spectroscopy (SERS).21,22 This technology has been widely studied and applied for many years; however, it has only recently been employed to analyze exosomes. 23,24 When combined with multivariate analytical techniques that can condense the large amount of spectral information gathered, SERS can serve as a valuable tool to separate exosome subpopulations and can potentially be utilized for the characterization of exosomes for cancer diagnoses.
One method for the mathematical processing of SERS data is principal component discriminant function analysis (PC-DFA).25,26 With this technique, principal component analysis (PCA) is performed initially on SERS spectra. This reduces total variables considered and accentuates the amount of variation within a data set. In so doing, it allows for the identification of the combination of variables contributing the greatest to the overall variance measured between samples. PCA conducts a linear (orthogonal) transformation on the SERS data, compressing a multitude of correlated variables (i.e. Raman shift peaks) into linearly uncorrelated variables known as principal components (PCs). PCs can then be used as input independent variables for discriminant function analysis (DFA). This method provides classification efficacy via a cross-validation or external-validation method.
In our experiment, we utilized SERS and PC-DFA to characterize subpopulations of exosomes from various cellular origins as well as patient sera. The SERS spectra of exosomes, derived from one healthy and two pancreatic cancer cell lines, were successfully characterized and classified by a PC-DFA algorithm. Further, the PC-DFA algorithm trained from the three cell lines was applied to the SERS spectra of exosomes isolated from pancreatic cancer patient serum samples to investigate the diagnostic efficacy of exosome spectral signatures.
Methods
Exosome isolation from cell medium and serum
Three hundred ml of cell medium was centrifuged in 50 ml aliquots at 11,200 G for ten minutes at 4 °C to remove dead cells and cellular debris. The supernatant was then filtered and concentrated. The exosomes were isolated using a sucrose density gradient as detailed earlier.27 The purified particles were washed using 10 mM Borate Buffer, resuspended in 50 μl of buffer and stored at –20 °C.
Exosomes were isolated from benign control patients and pancreatic cancer patients with early stage (IA-IIB) disease (IRB # 517–15-EP). For the isolation of exosomes from serum, one ml of patient serum was added to 1.5 ml PBS and centrifuged at 500 G for 10 min at 4 °C. The supernatant was collected and then centrifuged at 12,000 G for 20 min at 4 °C. Again, the supernatant was collected and centrifuged at 100,000 G for six hours at 4 °C. The pellet that formed was suspended with 3 ml PBS and centrifuged for the final time at 100,000 G for two hours at 4 °C. From here the exosome pellet was treated with the same density gradient steps as described for isolation from cell medium. The particles from each fraction were resuspended in 50 μl of PBS and stored at –20 °C.
Transmission electron microscopy (TEM)
For TEM analyses, 6 μL of purified exosome preparation was loaded onto the TEM copper grid and allowed to dry for three minutes followed by removal of excess sample. Nanovan vanadium negative stain (6 μL) was then added to the grid and allowed to rest for one minute when excess was removed and the grids were then incubated for five minutes. Samples were then analyzed by a Tecnai G2 Spirit transmission electron microscope (FEI Inc., Hillsboro, Oregon, USA).
Atomic force microscopy (AFM)
The overall negative charge of exosomes was exploited for depositing them on positively charged mica substrate modified with aminopropylsilatrane (APS) and prepared as described in previous publications.28 Exosome samples (5 μL) were left to incubate for a total of 2 min. Excess samples were washed with DI water and dried under argon flow. AFM images were acquired using a MultiMode AFM NanoScope IV system (Bruker Instruments, Santa Barbara, CA, USA) operating in tapping mode with a 1.5 Hz scanning rate using a TESPA-300 probe from Bruker with a resonance frequency of 320 kHz and a spring constant of about 40 N/m. Images were processed using the FemtoScan Online software package (Advanced Technologies Center, Moscow, Russia).
Nano particle tracking analysis (NTA)
The number and size of the purified exosome samples were measured with a NanoSight LM10 Nanoparticle Analysis System and processed with NTA 2.3 Analytical Software (Amesbury, Wiltshire, UK). The purified samples were diluted at 1:200 in PBS. A 1 mL syringe was used to inject the particle chamber with the diluted sample for NanoSight LM10 readings.
SERS measurement
Ti/Au 40 nm/100 nm coated 25 mm × 75 mm × 1.1 mm microscope slides were purchased from Deposition Research Lab Inc. (St. Charles, MO, USA). 10 nm AuNPs coated with Branched Polyethyleneimine (BPEI) were purchased from nanoComposix, Inc. (San Diego, CA USA). A 250 μL amount of 10-nm-diameter Au nanoparticles was centrifuged at 5500 RPM for 10 min and the supernatant was subsequently removed. The pellet was suspended with 250 μL of 2 mM Borate Buffer and this mixture was spun at 5500 RPM for 10 min. The supernatant was again removed and the pellet was suspended in 250 μL of 2 mM Borate Buffer. Exosomes from each cell line were then added to the mixture in a 1:1 ratio. These samples (5 μL each) were dropped onto the gold slides and allowed to incubate overnight at room temperature. They were allowed to dry completely and then stored at 4 °C prior to SERS measurement.
The SERS measurements were conducted using a commercial microscope (Renishaw InVia Reflection, Wotton-under-Edge, United Kingdom) with 785-nm diode laser excitation. The laser power was set to be 10 mW. The laser beam was focused by a 50× microscope objective with a numerical aperture of 0.75 (Leica n PLAN EPI 50×/0.75. Buffalo Grove, IL, USA) to a spot size of around 1 μm in diameter. They were recorded with an acquisition time of 1 s and accumulated 10 times.
SERS spectra processing and PC-DFA
The raw spectra were baseline corrected via the Vancouver Raman algorithm with 5-point boxcar smoothing along with fifth order polynomial fit. Normalization of spectra was conducted via the standard normal variant method thus removing multiplicative error while maintaining the same level of contribution to the measurement for each spectrum.25
The preprocessed spectra were then analyzed by the PC-DFA method utilizing the “mixOmics” package in R software. The PCA reduced the dimensionality of the SERS spectrum from 1004 variables (from 719 cm–1 to 1800 cm–1) to 20 PCs. These 20 PCs were further analyzed by DFA for development of a classification model. Classification efficacy was evaluated by cross-validation and external validation for the cell lines and patient serum samples, respectively.
Standard cell culture and immunoblot techniques are described in supplementary materials.
Results
Exosome characterization
Exosomes were isolated from cell culture supematants of representative pancreatic cancer cell lines CD18/HPAF and MiaPaCa, as well as from the untransformed pancreatic epithelial cell line HPDE by diffusion gradient ultracentrifugation as described in the experimental section. Size and concentration of the exosomal isolates were discerned through the use of nanoparticle tracking analysis (NTA) that revealed the CD18/HPAF cell line derived exosomes modal hydrodynamic size to be 132 nm (Figure 1, A) (MiaPaca and HPDE exosomes modal hydrodynamic size was 221 nmand261 nm respectively, Supplementary Figure 1). Morphology and size of the extracellular vesicles were visualized with transmission electron microscopy (TEM) (Figure 1, B). The particles from all three cell lines were circular with a central concavity giving a characteristic exosomal “cup shape” appearance. The larger exosome sizes measured via NTA can be attributed to vesicular agglomeration in NTA making them appear larger and the preparation of the samples required for TEM, causing exosomal dehydration resulting in vesicular shrinkage as well as the cup shape appearance.
Figure 1.
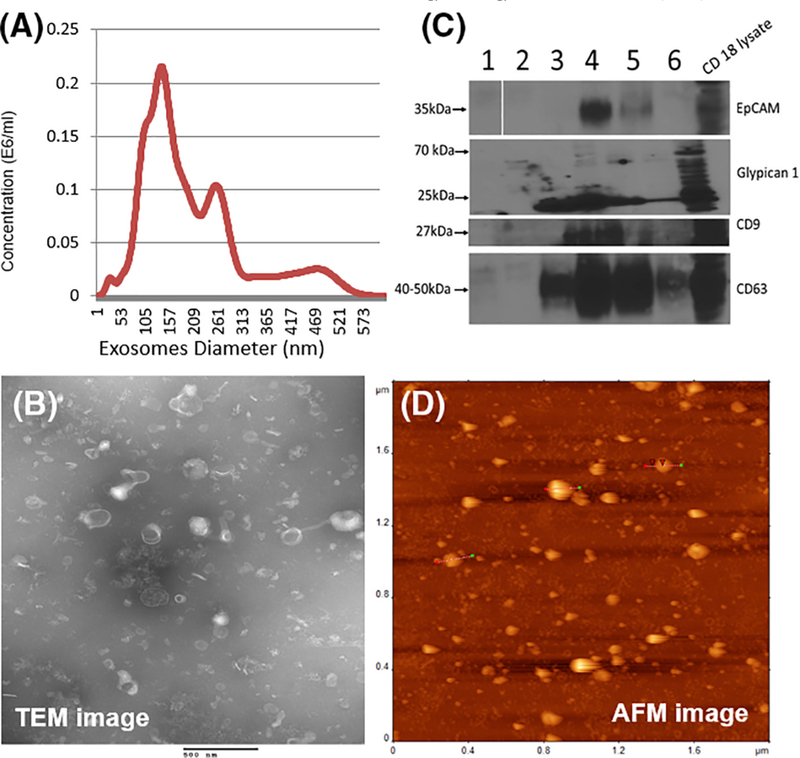
Physical and biochemical characterization of exosomes from pancreatic cancer cell line CD18/HPAF. Exosomes were purified via density gradient ultracentrifugation from cell line supernatant. (A) Nano particle tracking analysis (NTA) showing size distribution of purified exosomes. (B) TEM showing spherical consistency and size homogeneity along with individual vesicle morphology of purified particles. (C) Immunoblotting of density gradient purified fractions for exosomal markers (CD63 and CD9), adhesion molecule (EpCAM) and pancreatic cancer associated marker (Glypican 1). CD18/HPAF exosomes were positive for CD9, CD63, EpCAM and Glypican 1. CD18/HPAF cell line lysate was taken as control for immunoblotting studies. (D) AFM images of exosome deposited onto gold slides displaying presence and adequate coverage of exosomes for SERS.
Further characterization of the exosomes was conducted by immunoblotting 10 μg of each sample fraction from the density gradient ultracentrifugation (Figure 1, C). Accepted tetraspanin protein markers, CD9 and CD63, along with the adhesion molecule EpCAM29 were used as proof of the presence of exosomes within the sample fractions. As seen in the figure, all three of these markers were prominent in fractions three and four denoting high exosome concentration within these fractions. Of these, fraction three was chosen to be utilized in the subsequent SERS experiments. Interestingly, exosomes from both CD18/HPAF as well as MiaPACa were positive for Glypican 1, a marker shown to be 100% specific to pancreatic cancer.13 The immunoblot did confirm the presence of this antigen on the exosomes thus increasing their diagnostic significance and possible utilization as pancreatic cancer biomarkers.
Finally, characterization of purified exosomes was conducted via atomic force microscopy (Figure 1, D). AFM confirmed that the exosomes bind to the gold surface which is required for the SERS process and further that the concentration of particles was adequate for SERS address coverage.
Surface enhanced Raman spectroscopy of exosomes
For characterizing SERS signatures of exosomes, Raman shifts in the range of 719–1800 cm–1 were measured from 33 samples of exosomes derived from CD18/HPAF, 31 samples from MiaPaCa, 35 samples from HPDE, and 22 from the control (AuNPs only) within the Raman shift range of719–1800 cm–1. These individual SERS spectra were averaged for each exosome population, as well as for the control (Figure 2, Standard deviation associated with the means for each of the samples and control are shown in Supplementary Figure 2). Interestingly, variations in peaks (amplitude and Raman shift value) were noted both between the control and exosome populations and also between the exosome population samples themselves, thus providing the foundation for differential characterization of the particles.
Figure 2.
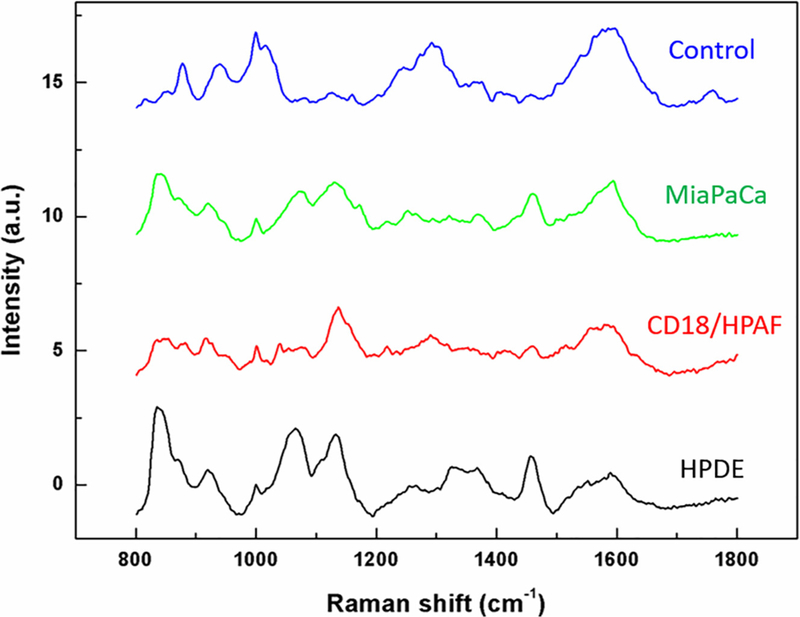
Characteristic surface enhanced Raman spectra (SERS) of exosomes from normal and pancreatic cancer cell line. Averaged SERS spectra for the four exosome populations: Gold nanoparticles only were used as a control, and all SERS of exosomes was conducted on sucrose density gradient purifed particles. For the experiment, 33 sample spectra of CD18/HPAF, 31 from MiaPaCa, 35 from HPDE, and 22 from the control were obtained and pre-processed. The variations in spectral pattern (amplitude and shift value) are noted between the control and exosome populations and also between the individual exosome populations within samples, thus providing the foundation for differential characterization of the particles.
In the 719–1800 cm–1 region, spectra exhibited peaks characteristic of vibrations corresponding to lipids and proteins which are the major contributors of exosome surface composition. For example, vibrations due to the C-C skeletal stretching appear as peaks at 1051 cm–1 and 1124 cm–1. Another peak that can be clearly distinguished lies at 1450 cm–1, which is due to CH2 bending vibration and is very typical of lipids.30 The peaks in the 1300–1400 cm–1 region can be attributed to CH2 twisting vibrations. An intense peak at 830 cm–1 is also observed corresponding to C-O-O vibration typical of phospholipids.31
High reproducibility and consistency for SERS measurements were observed (Supplementary Figure 3) providing validity to each individual SERS peak as specific to that sample exosome population and not merely arising from background noise. Although most repeated peaks of each group were identified, not every spectrum exhibited all of these specific peaks and not every specific peak was surface enhanced. The possible reason for this variable peak enhancement could be the randomness in the interaction and subsequent bonding between gold nanoparticles and exosomes. To address this issue, adequate spectral number and whole fingerprint spectral data were acquired for multivariate analysis. Of note, in addition to common spectral features across exosome populations, distinct differences in peaks’ profiles and intensities were observed in SERS. This observation highlights the ability of Raman spectroscopy to distinguish exosomes by their lipid composition. To increase the SERS output, we have used gold nanoparticles as well as gold substrate as an improvement over the previous design. 23 To identify differential peaks associated with pancreatic cancer, principal component and differential function analyses were conducted on the collected SERS data.
Principal component and differential function analyses (PCA-DFAs)
After pre-processing of the raw SERS spectra, PCA was used to reduce the number of variables considered from 1004 variables to 20 PCs, which counted for 88.2% of the total variance. Principal Component #1(PC #1) contained the most important data with 35.4% of the total variance. The next two PC #2 and PC #3 represented 14.4% and 6.6% of the total variance, respectively. A three dimensional (3D) PCA plot for the first three PCs (PC #1, PC #2, and PC #3) is shown in Supplementary Figure 4. Although these three PCs contributed 56.4% of the total variance, it is still not enough for high-efficiency classification. Twenty PCs were chosen for the trade-off between low data dimensionality and high variance observed in samples.
The PC-DFA plots for the three discriminant function classifiers (DA1, DA2, and DA3) of the total 121 spectra from four groups (HPDE, CD18/HPAF, MiaPaCa, and Control) are shown in Figure 3. The exosome groups and control group are clearly separated by DA1 and DA2 (Figure 3, A and B) due to the absence of exosome peaks within the control group, leading to a distinct spectral pattern. The exosome subpopulations formed discrete clusters and separated from each other by all the classifiers, as shown in the 3-dimensional PC-DFA plot (Figure 3, D). Corresponding loading spectra are shown in Supplementary Figure 5. The classification accuracy was calculated via cross-validation method and is shown in Table 1. As shown, only one spectrum of healthy cell-derived exosomes was misclassified as having a cancer cell origin. Congruently, six spectra of cancer cell-derived exosomes were misclassified as having a healthy cellular origin, with none of these being CD18/HPAF spectra (MiaPaCa spectra were classified as healthy six times, and as CD18/HPAF spectra 3 times). The overall accuracy of PC-DFA classification was 90.0% for the three cell line and the control. Since CD18/HPAF and MiaPaCa are cancer cell lines and HDPE is a healthy cell line, the sensitivity and specificity are calculated to be 90.6% and 97.1% respectively, regardless of the control.
Figure 3.
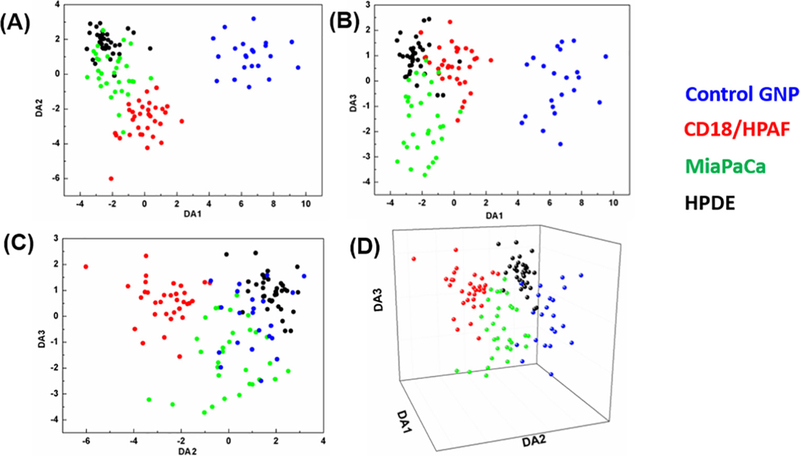
Discriminant Function Analysis (DFA) plots for each exosomal population and control (AuNPs only). Principle Component Analysis (PCA) was first conducted on raw SERS spectra from both normal human pacreatic ductal epithelial cell line (HPDE) and pancreatic cancer cell lines (CD18/HPAF, MiaPaCA) to reduce the dimensionality of the data from 1004 individual wavenumber variables (from 719 cm–1 to 1800 cm–1) to 20 PCs. The PCs were used as the input independent variables for DFA. (A) 2D DFA plot of DA1 vs. DA2. (B) 2D DFA plot of DA1 vs. DA3. (C) 2D PC-DFA plot of DA2 vs. DA3. (D) 3D DFA plot of DA1 vs. DA2 vs. DA3. These graphical representations visually display the capability of the PC-DFA algorithm to efficiently separate differing exosomal subpopulations based on SERS spectra.
Table 1.
The number of exosome sample spectra taken from each cell populations as well as the population with which each cell was clustered via PC-DFA. Number of spectra out of the total classified as HPDE, CD18, MiaPaCa or Control along with the overall percent correct.
| Source of Spectra | No. of spectra | Classified as HPDE | Classified as CD18 | Classified as MiaPaCa | Classified as Control |
|---|---|---|---|---|---|
| HPDE | 35 | 34 (97%) | 1 | 0 | 0 |
| CD18/HPAF | 33 | 0 | 31 (94%) | 2 | 0 |
| MiaPaCa | 31 | 6 | 3 | 22 (71%) | 0 |
| Control (AuNPs only) | 22 | 0 | 0 | 0 | 22 (100%) |
To investigate the potential diagnostic efficacy, exosomes were isolated as described in the experimental section from the sera of ten healthy subjects and ten early-stage pancreatic cancer patients. The presence, size, and number of exosomes in these samples were verified with NTA (Figure 4, A). Though the size and concentration were less than what was measured for cell line derived exosomes, their presence was confirmed by direct visualization by TEM, where the vesicles exhibited the characteristic “cup shape” morphology (Figure 4, B). Adhesion to the gold substrate surface and adequate SERS address distribution were verified by AFM (Figure 4, C).
Figure 4.

Morphology and characterization of serum derived exosomes purified by differential ultracentrifugation. (A) NTA showing size distribution of exosomes purified from patient sera; (B) TEM showing spherical individual vesicle morphology purified from patient sera; and (C) AFM of substrate surface (gold) displaying presence and adequate coverage of exosomes for SERS.
For each of the twenty exosome samples purified from sera, 10–20 SERS measurements were collected for external validation. The PC-DFA algorithm, trained from the previous SERS of cell line exosomes, was applied to the SERS measurements of the patient sera exosome samples. With the application of this algorithm, the SERS spectra measured from exosomes derived from serum exhibited a range of predictive accuracies. HC samples ranged from 20% to 87% characterization efficiency while EPC sample characterization efficiency was from 30% to 90% (see Table 2).
Table 2.
Predictive capability of applying the PC-DFA database, trained from SERS of cell line purified exosomes, to SERS of patient serum purified exosomes.
| HC | Predicted as healthy | Predicted as cancer | EPC | Predicted as healthy | Predicted as cancer |
|---|---|---|---|---|---|
| HC 1 (15) | 87% (13) | 13% (2) | EPC 1 (12) | 33% (4) | 67% (8) |
| HC 2 (15) | 80% (12) | 20% (3) | EPC 2 (13) | 62% (8) | 38% (5) |
| HC 3 (15) | 87% (13) | 13% (2) | EPC 3 (15) | 53% (8) | 47% (7) |
| HC 4 (15) | 20% (3) | 80% (12) | EPC 4 (15) | 47% (7) | 53% (8) |
| HC 5 (20) | 75% (15) | 25% (5) | EPC 5 (20) | 70% (14) | 30% (6) |
| HC 6 (10) | 20% (2) | 80% (8) | EPC 6 (20) | 35% (7) | 65% (13) |
| HC 7 (20) | 55% (11) | 45% (9) | EPC 7 (20) | 55% (11) | 45% (9) |
| HC 8 (20) | 35% (7) | 65% (13) | EPC 8 (20) | 10% (2) | 90% (18) |
| HC 9 (20) | 55% (11) | 45% (9) | EPC 9 (20) | 10% (2) | 90%(18) |
| HC 10 (20) | 55% (11) | 45% (9) | EPC 10 (20) | 55% (11) | 45% (9) |
The left part of the table shows the PC-DFA predicted cancer status of exosomes isolated from the SERS of ten different healthy individual serum controls (HC) while the right part of the table shows the PC-DFA predicted cancer status from the SERS of exosomes isolated from the serum of ten different early pancreatic cancer patients (EPC). Note: The number in parentheses in the population type column is the total number of SERS measurements taken from serum samples of each healthy individual or pancreatic cancer patient. The number in parentheses in the predicted columns is the number of SERS measurments with that predicted characterization. Individual assay efficiency ranged from 20% to 87% and 30% to 90% for HC and EPC samples, respectively.
Discussion
Label-free technologies offer many advantages that are amenable to the characterization and utilization of liquid biopsies as diagnostic markers. Conventional methods such as immunohistochemistry, flow cytometry, PCR, and immunoblotting use known targets of interest which require predetermined markers or probes. Unfortunately, the quantity of cancer originating exosomes purified from patient serum is minimal compared to those arising from normal tissue. Because of this, the ability to collect adequate material for assessment via the aforementioned technologies is greatly diminished. Further, the narrow focus of these technologies inherently limits the possible information gathered from a given sample and precludes the possibility of discovery. Conversely, label-free modalities circumvent the requirement of predetermination, thereby offering a relative and universal metric by which all species are measured and compared.
Many investigators have recognized the value in label-free techniques and as such, a variety of methods have recently been evaluated. Surface plasmon resonance is used in the quantification and detection of multiple serum-based biomarkers by refractive index changes predicated on binding interactions.32 Surface proteomics is a technique that involves “shaving” proteins off the surface of exosomes.33 Mass Spectrometry is then utilized to discern the identity of the shaved proteins that may subsequently be used as cancer specific biomarkers. Also, species-specific impedance biosensors have been utilized in the pursuit of biomarkers.34 This study utilizes the label-free technique of SERS which is uniquely suited for exosomal characterization due to its high sensitivity, molecular signature specificity, and ability to be amplified. This method can take advantage of the differing, yet unknown, characteristics of exosomes and separate exosomes predicated on spectral differences. Our SERS substrate is comprised of two components: gold slide surface and 10 nm AuNP’s. The minimal SERS activity inherent to 10 nm AuNPs is amplified by the presence of the gold slide surface in a “mirror” geometry. Plasmonic coupling of nanoparticle modes with the Au substrate provides a red shift in plasmonic resonance matching our excitation at 647 nm. A much larger SERS signal is observed when this tandem method is used. We have utilized 10 nm AuNPs to benefit from positive charges of BPEI modified NP’s, the only size commercially available at the time. We did this because positively charged nanoparticles bind to the surface of negatively charged exosomes. Additionally, small nanoparticles bound to exosomes provide a large number of “hot spots”.
Though the specific molecules that contribute to the variance in SERS spectra are unknown at this time, the Raman spectral shifts offer an insight into possible species. Lipids and proteins are the primary molecules that comprise the exosomal surface. This surface composition is highly variable between cancer and normal exosomes and is the reason behind SERS spectral variance. For example, peaks associated with C-C skeletal stretching and CH2 bending are characteristic for the presence of lipids and a peak associated with C-O-O vibrations alluded to the presence of phospholipids. Changes in the relative amounts of these molecular species, or even species ratios, can confer a measurable and useful amount of overall spectral variance.
Previously, Park et al. conducted an elegant study that investigated PCA of SERS and the ability to differentiate exosomes originating from healthy cells vs. those originating from lung cancer cells. 23 Their work proved the utility of PCA of SERS to accurately characterize exosomes originating from healthy or lung cancer cells. However, the study was unable to translate the findings from pure cell line exosome populations to those purified from patient sera. Another study conducted by Stremersch et al. combined partial least squares discriminant analysis to SERS of exosomes.35 They showed that pure populations of exosomes purified from melanoma or red blood cells could be accurately separated; their method was also not applied to exosomes from patient sera. The study put forth in this paper is a proof-of-concept experiment, proving the power and potential for PC-DFA of exosomal SERS to serve as a means to diagnose pancreatic cancer at an early stage, when curative resection is still possible, that heretofore had not been successful. To corroborate these findings, previous studies have shown that cancer-specific exosomes are present in patient serum23,33 and that pancreatic cancer specific profiling of serum-purified exosomes for oncogenic mutations is feasible. 15
Lower prediction efficacies were observed when the PC-DFA was applied to SERS of patient sera. This is a direct result of the diverse origin of exosomes in patient serum. In addition, the sera from cancer patients, especially from those with early-stage disease, inherently have a larger portion of exosomes arising from normal epithelium rather than tumor cells. This increases the complexity of the SERS spectra and therefore the difficulty of algorithmic determination increases significantly. Even so, this study opens the door to a novel cancer detection method. Congruently, the trend of multiple testing outcomes (i.e. characterization as HC or EPC) from a single patient could serve as a means of allying or increasing suspicion of cancer. Use of this technique in high-risk patients and/or those with high-risk features could give insight into the disease gestalt.
The practical use of this technology and lack of specificity can be ameliorated via multiple means and are possible future directions for this research. The first will be to conduct an intragroup comparison between well characterized and poorly characterized samples, as determined by the current PC-DFA algorithm. This will elucidate peaks or areas within the spectra that may be diminishing assay efficacy. Second, we will establish an exosomal SERS spectral library collected from a large sample set of healthy individuals and pancreatic cancer patients of various stage and use those for the basis of the PC-DFA predictive algorithm. Additionally, larger serum sample volumes may be used to increase the total amount of pancreatic cancer originating exosomes. Further investigation is planned to discover if different metrics such as proteomics, metabolomics and RNA sequencing of exosomal contents, would improve on the aforementioned sensitivity and specificity of SERS PC-DFA. Alternative methods of purification include exosome specific ELISA and magnetic bead isolation, to purify directly from serum. Implementing these methods would allow for more facile isolation. Finally, we plan to investigate other various biological sources of exosomes, such as urine and ascites, and apply PC-DFA.
In conclusion, surface enhanced Raman spectroscopy, in conjunction with PC-DFA methodology, was applied for the classification of exosomes derived from a healthy cell line and two pancreatic cancer cell lines via a cross-validation method. The sensitivity and specificity were 90.6% and 97.1%, respectively. Moreover, a proof-of-concept experiment was conducted to investigate the diagnostic efficacy of the SERS spectra of exosomes collected from pancreatic cancer patient serum samples when the PC-DFA algorithm was applied. The present work demonstrates that exosomes can be analyzed by SERS and combined with PC-DFA as a liquid biopsy based detection of pancreatic cancer.
Supplementary Material
Acknowledgement
The support of the Nano-imaging core facility and the utilization of their expertise and equipment for nanoparticle tracking analysis are gratefully acknowledged. We further acknowledge the University of Nebraska Medical Center Microscopy Core facility for access to transmission electron microscopy.
Funding Sources: 5P20GM103480, R44CA224619, R41CA213718, UO1 CA200466 and UO1 210240.
Footnotes
There is no disclosure.
SKB is one of the co-founders of Sanguine Diagnostic and Therapeutics.
Appendix A. Supplementary data
Supplementary data to this article can be found online at https://doi.org/10.1016/j.nano.2018.11.008.
The other authors have no potential conflict of interests.
References
- 1.American Cancer Society. Cancer facts & figures 2017. Atlanta: American Cancer Society; 201722–3. [Google Scholar]
- 2.Khorana AA, Mangu PB, Katz MHG. Potentially curable pancreatic cancer: American Society of Clinical Oncology clinical practice guideline. J Clin Oncol 2016;34(21):2541–56. [DOI] [PubMed] [Google Scholar]
- 3.Sohal DP, Mangu PB, Khorana AA, Shah MA, Philip PA, O’Reilly EM, et al. Metastatic pancreatic cancer: American Society of Clinical Oncology clinical practice guideline. J Clin Oncol 2016;34 (23):2784–96. [DOI] [PMC free article] [PubMed] [Google Scholar]
- 4.Chang JC, Kundranda M. Novel diagnostic and predictive biomarkers in pancreatic adenocarcinoma. Mol Sci 2017;18(3):667, 10.3390/ijms18030667. [DOI] [PMC free article] [PubMed] [Google Scholar]
- 5.Kowal J, Tkach M, Thery C. Biogenesis and secretion of exosomes. Curr Opin Cell Biol 2014;29:116–25. [DOI] [PubMed] [Google Scholar]
- 6.Chen Y, Pfeifer A. Brown fat-derived exosomes: small vesicles with big impact. Cell Metab 2017;25(4):759–60. [DOI] [PubMed] [Google Scholar]
- 7.Shrivastava S, Devhare P, Sujijantarat N, Steele R, Kwon YC, Ray R, et al. Knockdown of autophagy inhibits infectious hepatitis C virus release by the Exosomal pathway. J Virol 2015;90(3):1387–96. [DOI] [PMC free article] [PubMed] [Google Scholar]
- 8.Maybruck BT, Pfannenstiel LW, Diaz-Montero M, Gastman BR. Tumor-derived exosomes induce CD8+ T cell suppressors. J Immun-other Cancer 2017;5(1):65, 10.1186/s40425-017-0269-7. [DOI] [PMC free article] [PubMed] [Google Scholar]
- 9.Hoshino A, Costa-Silva B, Shen TL, Rodrigues G, Hashimoto A, Tesic Mark M, et al. Tumour exosome integrins determine organotropic metastasis. Nature 2015;527(7578):329–35. [DOI] [PMC free article] [PubMed] [Google Scholar]
- 10.Soung YH, Nguyen T, Cao H, Lee J, Chung J. Emerging roles of exosomes in cancer invasion and metastasis. BMB Rep 2016;49 (1):18–25. [DOI] [PMC free article] [PubMed] [Google Scholar]
- 11.Weidle UH, Birzele F, Kollmorgen G, Rüger R. The multiple roles of exosomes in metastasis. Cancer Genomics Proteomics 2017;14(1):1–15. [DOI] [PMC free article] [PubMed] [Google Scholar]
- 12.Moravec R, Divi R, Verma M. Detecting circulating tumor material and digital pathology imaging during pancreatic cancer progression. Gastrointest Oncol 2017;9(6):235–50. [DOI] [PMC free article] [PubMed] [Google Scholar]
- 13.Melo SA, Luecke LB, Kahlert C, Fernandez AF, Gammon ST, Kaye J, et al. Glypican-1 identifies cancer exosomes and detects early pancreatic cancer. Nature 2015;523(7559):177–82. [DOI] [PMC free article] [PubMed] [Google Scholar]
- 14.Jin H, Wu Y, Tan X. The role of pancreatic cancer-derived exosomes in cancer progress and their potential application as biomarkers. Clin Transl Oncol 2017;19(8):921–30. [DOI] [PubMed] [Google Scholar]
- 15.Madhavan B, Yue S, Galli U, Rana S, Gross W, Müller M, et al. Combined evaluation of a panel of protein and miRNA serum-exosome biomarkers for pancreatic cancer diagnosis increases sensitivity and specificity. Cancer 2015;136(11):2616–27. [DOI] [PubMed] [Google Scholar]
- 16.Zhao K, Liang G, Sun X, Guan le L. Comparative miRNAome analysis revealed different miRNA expression profiles in bovine sera and exosomes. BMC Genomics 2016;17(1):630, 10.1186/s12864-016-2962-1. [DOI] [PMC free article] [PubMed] [Google Scholar]
- 17.Huang X, Yuan T, Tschannen M, Sun Z, Jacob H, Du M, et al. Characterization of human plasma-derived exosomal RNAs by deep sequencing. BMC Genomics 2013;14:319, 10.1186/1471-2164-14-319. [DOI] [PMC free article] [PubMed] [Google Scholar]
- 18.Sun Y, Liu S, Qiao Z, Shang Z, Xia Z, Niu X, et al. Systematic comparison of exosomal proteomes from human saliva and serum for the detection of lung cancer. Anal Chim Acta 2017;982:84–95. [DOI] [PubMed] [Google Scholar]
- 19.Butz H, Nofech-Mozes R, Ding Q, Khella HWZ, Szabó PM, Jewett M, et al. Exosomal MicroRNAs are diagnostic biomarkers and can mediate cell-cell communication in renal cell carcinoma. Eur Urol Focus 2016;2(2):210–8. [DOI] [PubMed] [Google Scholar]
- 20.Dustin W, Shipp FS, Notingher Loan. Raman spectroscopy: techniques and application in the life sciences. Adv Opt Photonics 2017;9(2):315–428. [Google Scholar]
- 21.Etchegoin PG, Le Ru EC. A perspective on single molecule SERS: current status and future challenges. Phys Chem Chem Phys 2008; 10 (40):6079–89. [DOI] [PubMed] [Google Scholar]
- 22.Li L, Hutter T, Steiner U, Mahajan S. Single molecule SERS and detection of biomolecules with a single gold nanoparticle on a mirror junction. Analyst 2013;138(16):4574–8. [DOI] [PubMed] [Google Scholar]
- 23.Park J, Hwang M, Choi B, Jeong H, Jung JH, Kim HK, et al. Exosome classification by pattern analysis of surface-enhanced Raman spectroscopy data for lung cancer diagnosis. Anal Chem 2017;89(12):6695–701. [DOI] [PubMed] [Google Scholar]
- 24.Lee C, Carney RP, Hazari S, Smith ZJ, Knudson A, Robertson CS, et al. 3D plasmonic nanobowl platform for the study of exosomes in solution. Nanoscale 2015;7(20):9290–7. [DOI] [PMC free article] [PubMed] [Google Scholar]
- 25.Huang X, Irmak S, Lu YF, Pipinos I, Casale G, Subbiah J. Spontaneous and coherent anti-Stokes Raman spectroscopy of human gastrocnemius muscle biopsies in CH-stretching region for discrimination of peripheral artery disease. Biomed Opt Express 2015;6(8):2766–77. [DOI] [PMC free article] [PubMed] [Google Scholar]
- 26.Huang X, Yuan Y, Bielecki T, Mohapatra BC, Luan H, Silva-Lopez E, et al. Discrimination of tumor from normal tissues in a mouse model of a breast cancer using CARS spectroscopy combined with PC-DFA methodology. J Raman Spectrosc 2017;48(9):1166–70. [Google Scholar]
- 27.Greening DW, Xu R, Ji H, Tauro BJ, Simpson RJ. A protocol for exosome isolation and characterization: evaluation of ultracentrifugation, density-gradient separation, and immunoaffinity capture methods. Methods MolBiol 2015;1295:179–209. [DOI] [PubMed] [Google Scholar]
- 28.Shlyakhtenko LS, Gall AA, Filonov A, Cerovac Z, Lushnikov A, Lyubchenko YL. Silatrane-based surface chemistry for immobilization of DNA, protein-DNA complexes and other biological materials. Ultramicroscopy 2003;97(1–4):279–87. [DOI] [PubMed] [Google Scholar]
- 29.Belov L, Matic KJ, Hallal S, Best OG, Mulligan SP, Christopherson RI. Extensive surface protein profiles of extracellular vesicles from cancer cells may provide diagnostic signatures from blood samples. J Extracell Vesicles 2016;5:25355. [DOI] [PMC free article] [PubMed] [Google Scholar]
- 30.Singh SP, Deshmukh A, Chaturvedi P, Krishna CM. Raman spectroscopy in head and neck cancers: toward oncological applications. J Cancer Res Ther 2012;8(Suppl 1):S126–32. [DOI] [PubMed] [Google Scholar]
- 31.Czamara K, Al E. Raman spectroscopy of lipids: a review. J Raman Spectrosc 2015;46(1):4–20. [Google Scholar]
- 32.Wang H, Wang X, Wang J, Fu W, Yao C. A SPR biosensor based on signal amplification using antibody-QD conjugates for quantitative determination of multiple tumor markers. Sci Rep 2016;6:33140. [DOI] [PMC free article] [PubMed] [Google Scholar]
- 33.Castillo J, Bernard V, San Lucas FA, Allenson K, Capello M, Du, et al. Surfaceome profiling enables isolation of cancer-specific exosomal cargo in liquid biopsies from pancreatic cancer patients. Ann Oncol 2017;29(1):223–9. [DOI] [PMC free article] [PubMed] [Google Scholar]
- 34.Arya SK, Zhurauski P, Jolly P, Batistuti MR, Mulato M, Estrela P. Capacitive aptasensor based on interdigitated electrode for breast cancer detection in undiluted human serum. Biosens Bioelectron 2017;102:106–12. [DOI] [PubMed] [Google Scholar]
- 35.Stremersch S, Marro M, Pinchasik BE, Baatsen P, Hendrix A, De Smedt SC, et al. Identification of individual exosome-like vesicles by surface enhanced Raman spectroscopy. Small 2016;12(24):3292–301. [DOI] [PubMed] [Google Scholar]
Associated Data
This section collects any data citations, data availability statements, or supplementary materials included in this article.