

We used mammalian reovirus as a model to study how virus infections result in cell death. Here, we sought to determine how viral factors regulate cell death. Our work highlights a previously unknown role for the reovirus outer capsid protein μ1 in limiting the induction of a necrotic form of cell death called necroptosis. Induction of cell death by necroptosis requires the detection of viral gene products late in infection; μ1 limits cell death by this mechanism because it prevents excessive accumulation of viral gene products that trigger cell death.
KEYWORDS: cell death, reovirus
ABSTRACT
The reovirus outer capsid protein μ1 regulates cell death in infected cells. To distinguish between the roles of incoming, capsid-associated, and newly synthesized μ1, we used small interfering RNA (siRNA)-mediated knockdown. Loss of newly synthesized μ1 protein does not affect apoptotic cell death in HeLa cells but enhances necroptosis in L929 cells. Knockdown of μ1 also affects aspects of viral replication. We found that, while μ1 knockdown results in diminished release of infectious viral progeny from infected cells, viral minus-strand RNA, plus-strand RNA, and proteins that are not targeted by the μ1 siRNA accumulate to a greater extent than in control siRNA-treated cells. Furthermore, we observed a decrease in sensitivity of these viral products to inhibition by guanidine hydrochloride (GuHCl) (which targets minus-strand synthesis to produce double-stranded RNA) when μ1 is knocked down. Following μ1 knockdown, cell death is also less sensitive to treatment with GuHCl. Our studies suggest that the absence of μ1 allows enhanced transcriptional activity of newly synthesized cores and the consequent accumulation of viral gene products. We speculate that enhanced accumulation and detection of these gene products due to μ1 knockdown potentiates receptor-interacting protein 3 (RIP3)-dependent cell death.
IMPORTANCE We used mammalian reovirus as a model to study how virus infections result in cell death. Here, we sought to determine how viral factors regulate cell death. Our work highlights a previously unknown role for the reovirus outer capsid protein μ1 in limiting the induction of a necrotic form of cell death called necroptosis. Induction of cell death by necroptosis requires the detection of viral gene products late in infection; μ1 limits cell death by this mechanism because it prevents excessive accumulation of viral gene products that trigger cell death.
INTRODUCTION
Replication of a virus within host cells can result in cell death (1), which is often detrimental to virus infection (2). To counter the antiviral effect of cell death, many viruses encode proteins that prevent cell death (1, 2). In some cases, cell death can have pathogenic consequences. In instances in which cell death is required for cell-to-cell spread of the virus or dissemination of the virus beyond the primary site of replication, cell death can exacerbate disease (1). Additionally, tissue injury caused by cell death can contribute to viral disease. Mammalian reovirus has been used as an experimental model to investigate the impact of cell death on viral disease. In a mouse model of infection, the potential for reovirus to cause heart or central nervous system disease is dependent on its capacity to induce cell death by apoptosis (3–5). Numerous studies have mapped out both viral and cellular factors that influence apoptosis induction and disease following reovirus infection.
The known viral determinants of reovirus-induced apoptosis are the attachment protein σ1 and the membrane penetration protein μ1 (6–9). The role of σ1 in controlling cell death correlates with the efficiency with which σ1 mediates attachment to host cell receptors (8, 9). The reovirus outer capsid protein μ1, which plays an essential role in delivering the viral core particle into the cytoplasm, is also important for controlling the efficiency with which reovirus induces apoptosis. Mutations within the C-terminal region of μ1 diminish the capacity of reovirus to evoke proapoptotic signaling (10, 11). Cell death signaling following ectopic expression of μ1 in plasmid-transfected cells also supports this idea (12, 13). Even in this artificial context, the C-terminal region of μ1, which affects the localization of μ1 to intracellular membranous structures such as mitochondria, plays an important role in the release of proapoptotic factors cytochrome c and second mitochondria-derived activator of caspase/direct inhibitor of apoptosis-binding protein with low pI (Smac/DIABLO) from the mitochondria and activation of effector caspases (12, 13). Based on evidence that events that occur prior to viral gene expression are sufficient for the induction of apoptosis (9, 14), it is assumed that the effect of μ1 on the apoptotic potential of reovirus is related to the function of μ1 as part of the incoming viral capsid. However, this idea has not directly been tested.
Depending on the cell type, reovirus can elicit another form of regulated cell death called necroptosis (15, 16). Unlike apoptosis, necroptosis is thought to be an inflammatory form of cell death (17). Reovirus-induced necroptosis is initiated by the sensing of incoming genomic double-stranded RNA (dsRNA) by retinoic acid-inducible gene I (RIG-I) and melanoma differentiation-associated protein 5 (MDA5) (16). These sensors signal via the mitochondrial antiviral signaling protein (MAVS) to produce type I interferon (IFN). In addition to IFN signaling, de novo synthesis of the viral dsRNA genome is required for induction of necroptosis (16, 18). Together, these events in reovirus infection lead to receptor-interacting protein 1 (RIP1)- and RIP3-dependent cell death (15, 16). The necroptotic effector protein mixed-lineage kinase-like protein (MLKL) is also activated at times that are consistent with the induction of cell death (16). Our working hypothesis is that de novo synthesized genomic RNA (or its products) is detected by an IFN-stimulated gene (ISG) to induce necroptosis. Viral factors that increase dsRNA synthesis or control the exposure of dsRNA are likely to influence necroptosis. However, a link between dsRNA binding by viral proteins and cell death has not been established.
We sought to identify viral factors that contribute to the induction of cell death following reovirus infection. Given the previously described role of μ1 in cell death, we aimed to further dissect the mechanisms by which μ1 is involved in reovirus-induced cell death. Here, we explored the role of newly synthesized μ1 in cell death by using small interfering RNA (siRNA)-mediated knockdown. We observed that knockdown of μ1 does not affect apoptosis induction by reovirus, suggesting that μ1 present in the incoming capsid is sufficient to regulate apoptosis. In contrast, knockdown of μ1 accelerates necroptosis induction following reovirus infection, indicating that newly synthesized μ1 affects this form of cell death. Furthermore, we discovered that knockdown of the μ1 protein in infected cells results in increased accumulation of progeny dsRNA, secondary transcripts produced from dsRNA, and viral proteins in infected cells. These data highlight a new function for newly synthesized μ1 in controlling the levels of viral gene products in infected cells, and they support the model that viral components that are synthesized late in infection are detected to elicit necroptotic cell death.
(This article was submitted to an online preprint archive [19].)
RESULTS
Newly synthesized μ1 does not affect reovirus-induced apoptosis.
The reovirus outer capsid protein μ1 regulates apoptotic cell death following infection (9–13, 20). However, whether this is a function of incoming capsid-associated μ1 or newly synthesized μ1 protein has not been evaluated directly. To determine whether newly synthesized μ1 is responsible for this described role in apoptosis, we knocked down the levels of the T3D strain μ1 protein in reovirus-infected HeLa cells using siRNA. Because HeLa cells are less permissive to reovirus, we used a multiplicity of infection (MOI) of 100 PFU/cell, consistent with previous experiments with HeLa cell infection (11). As expected, the siRNA significantly diminished levels of newly synthesized μ1 in infected cells (Fig. 1A). To assess the impact of μ1 knockdown on levels of cell death, HeLa cells transfected with either control or μ1 siRNA were infected with T3D for 48 h and cell death was quantified by acridine orange-ethidium bromide (AOEB) staining (Fig. 1B). Acridine orange is a membrane-permeable dye that stains all cells, whereas ethidium bromide incorporates into and stains only the DNA of cells with compromised membranes, such as following cell death. Thus, ethidium bromide-positive cells are scored as dead cells. We observed that preventing the expression of newly synthesized μ1 did not alter the levels of cell death induced in HeLa cells following T3D infection. HeLa cells display markers of apoptosis following reovirus infection and were suggested previously to undergo cell death by apoptosis following reovirus infection (8, 14, 21). To confirm that cell death in the HeLa cells used for these experiments occurred by apoptosis, the infected cells were treated with the pan-caspase inhibitor quinoline-Val-Asp-difluorophenoxymethyl ketone (QVD) (Fig. 1C). Cell death in the presence of control or μ1 siRNA was significantly decreased by treatment with QVD (Fig. 1C). Thus, newly synthesized μ1 does not affect the efficiency of apoptotic cell death following reovirus infection.
FIG 1.

Newly synthesized μ1 does not affect apoptotic cell death. HeLa cells were transfected with either control or μ1 siRNA using INTERFERin. Twenty-four hours following transfection, the cells were infected and processed as described. (A) Cells were infected with T3D at a MOI of 100 PFU/cell. Cell lysates prepared 24 h following infection were immunoblotted for the μ1 protein using antireovirus antiserum and anti-PSTAIR mAb. Levels of μ1 and μ1C bands, relative to PSTAIR, are indicated. The level of μ1 and μ1C, relative to PSTAIR, in control siRNA-treated cells was considered 100%. (B) Cells were infected with T3D at a MOI of 100 PFU/cell. At 48 h postinfection, cell death was quantified by AOEB staining. (C) Cells were infected with T3D at a MOI of 100 PFU/cell and either were left untreated or were treated with 20 μM QVD when infection was initiated. At 48 h postinfection, cell death was quantified by AOEB staining. Cell death for each independent infection and mean are shown. Error bars indicate standard deviations (SDs). P values were determined by Student's t test. *, P < 0.05; **, P < 0.005.
Knockdown of newly synthesized μ1 drives an increase in necroptotic cell death.
L929 cells succumb to reovirus infection by undergoing a different form of cell death, called necroptosis (16). The requirements for induction of this necrotic form of cell death are distinct from those described for reovirus-induced apoptosis (18). To determine whether newly synthesized μ1 plays a role in the regulation of necroptotic cell death, we used siRNA-mediated knockdown of μ1 following T3D infection in L929 cells. Analogous to HeLa cells, the siRNA significantly diminished levels of newly synthesized μ1 in infected L929 cells (Fig. 2A). To determine whether knockdown of μ1 affects the levels of cell death, L929 cells transfected with control or μ1 siRNA were infected with T3D and cell death was quantified by AOEB staining (Fig. 2B). Interestingly, in contrast to what we observed in HeLa cells, loss of μ1 in L929 cells enhanced cell death. Even at a time when control siRNA-treated cells exhibited a minimal level of cell death (∼5%) following reovirus infection, μ1 knockdown led to significantly more cell death (∼25%). These data suggest that newly synthesized μ1 negatively regulates L929 cell death following reovirus infection.
FIG 2.

Knockdown of newly synthesized μ1 increases cell death in L929 cells. L929 cells were transfected with either control or μ1 siRNA using Lipofectamine. Twenty-four hours following transfection, the cells were infected with T3D at a MOI of 10 PFU/cell and processed as described. (A) Cell lysates prepared 24 h following infection were immunoblotted for the μ1 protein using antireovirus antiserum and anti-PSTAIR mAb. The level of μ1 and μ1C, relative to PSTAIR, in control siRNA-treated cells was considered 100%. (B) Cell death was quantified 24 h following infection by AOEB staining. Cell death for each independent infection and means are shown. Error bars indicate SDs. P values were determined by Student's t test. *, P < 0.05; **, P < 0.005.
To ensure that the effect of the μ1 siRNA was specific and related to its complementarity to the T3D M2 gene (Fig. 3A), we evaluated the capacity of the μ1 siRNA to affect levels of μ1 from the prototype strain T1L or a M2 gene reassortant, T1L/T3DM2, which expresses T3D μ1 in a T1L genetic background (Fig. 3B). We observed that T3D M2-specific siRNA failed to affect the expression of T1L μ1 (due to sequence mismatch) but reduced μ1 expression after infection with T1L/T3DM2. Thus, the μ1 siRNA we have designed specifically and efficiently diminishes the T3D μ1 protein levels in infected cells. To confirm that the increased cell death phenotype is specific to knocking down μ1 from T3D, we measured cell death in μ1 siRNA-treated cells infected with T1L or T1L/T3DM2 (Fig. 3C). Because T1L induces cell death less efficiently (6, 7, 15), T1L-induced cell death was measured at a later time postinfection. Nevertheless, μ1 siRNA failed to affect cell death following T1L infection. In contrast, knockdown of μ1 following infection with T1L/T3DM2 demonstrated an increase in cell death, similar to findings observed with T3D. This suggests that the increase in cell death observed is due to the specific siRNA knockdown of μ1 and not due to off-target effects of μ1 siRNA on a cellular signaling pathway. Having established the specificity of the siRNA and the enhanced cell death phenotype observed, we performed the remainder of the experiments with T3D, which has been predominantly used to define reovirus-driven cell death pathways.
FIG 3.

Effect of μ1 siRNA on cell death is sequence specific. (A) The μ1 siRNA sequence is aligned with the targeted (underlined) region of the M2 gene segment from T3D. The corresponding region from T1L M2, showing mismatches (shaded) within the siRNA target sequence, is also shown. M2 encodes μ1. (B) L929 cells were transfected with either control or μ1 siRNA using INTERFERin. Twenty-four hours following transfection, the cells were infected with either T1L or T1L/T3DM2 at a MOI of 10 PFU/cell. Cell lysates prepared 24 h following infection were immunoblotted for the μ1 protein using antireovirus antiserum and anti-PSTAIR mAb. The level of μ1 and μ1C, relative to PSTAIR, in control siRNA-treated cells was considered 100%. (C) L929 cells were transfected with either control or μ1 siRNA using Lipofectamine. Twenty-four hours following transfection, the cells were infected with either T1L or T1L/T3DM2, at a MOI of 10 PFU/cell, for 72 h or 24 h, respectively. Following infection, cell death was quantified by AOEB staining. Cell death for each independent infection and means are shown. Error bars indicate SDs. P values were determined by Student's t test. **, P < 0.005.
To determine whether μ1 knockdown is sufficient to influence virus replication, we measured viral yield over a 24-h period. Because μ1 is an essential outer capsid protein whose function is required to launch infection (22), it was expected that efficient knockdown of newly synthesized μ1 would result in a decrease in production of infectious progeny. We observed that knockdown of μ1 following T3D infection resulted in a significant (∼1-log10 unit) decrease in viral yield (Fig. 4A). Since our siRNA targets newly synthesized μ1, it would not be expected that this knockdown would affect any events early in viral replication, prior to gene expression. Consistent with this, we found that virus attachment and disassembly of incoming particles (which are derived from normal cells) are not affected in cells that express μ1 siRNA (data not shown). Therefore, as expected, only events in viral replication that are dependent on de novo expression of μ1 affect viral yield.
FIG 4.

Knockdown of μ1 reduces viral yield and evokes cell death independently of σ3. (A) L929 cells were transfected with either control or μ1 siRNA using Lipofectamine. Twenty-four hours following transfection, the cells were infected with T3D at a MOI of 2 PFU/cell. Viral replication 24 h following infection was measured by plaque assay on L929 cells. Viral yield for each independent infection and means are shown. (B) L929 cells were transfected with either control or σ3 siRNA using Lipofectamine. Twenty-four hours following transfection, the cells were infected with T3D at a MOI of 10 PFU/cell. Cell lysates prepared 24 h following infection were immunoblotted for the σ3 protein using antireovirus antiserum and anti-PSTAIR mAb. The level of σ3, relative to PSTAIR, in control siRNA-treated cells was considered 100%. (C) L929 cells were transfected with either control, μ1, or both μ1 and σ3 siRNA using INTERFERin. Twenty-four hours following transfection, the cells were infected with T3D at a MOI of 10 PFU/cell for the indicated time. Following infection, cell death was quantified by AOEB staining. Mean values for three independent infections are shown. Error bars indicate SDs. P values were determined by Student's t test. **, P < 0.005; NS, not significant.
Newly synthesized μ1 interacts with its viral binding partner, σ3 (23–25). This interaction negatively affects the function of μ1 in apoptotic cell death (12). Free σ3 promotes viral protein synthesis. However, when σ3 is complexed to μ1, the protein-synthesis-promoting function of σ3 is diminished (26, 27). To determine whether the increase in cell death observed following μ1 knockdown is due to the presence of free σ3 in cells, L929 cells transfected with control or μ1 siRNA or cotransfected with μ1 and σ3 siRNA (Fig. 4B) were infected with T3D and cell death over time was quantified with AOEB staining (Fig. 4C). Cells transfected with control siRNA started exhibiting cell death around 36 h postinfection with T3D. In contrast, cells transfected with μ1 siRNA succumbed to reovirus infection as early as 24 h postinfection, exhibiting ∼30% cell death, in comparison to only ∼5% in control siRNA-treated cells. Moreover, in comparison to control siRNA-transfected cells, significantly more cell death was observed at each time point for cells transfected with the μ1 siRNA. Knockdown of both μ1 and σ3 together demonstrated a phenotype similar to that of knockdown of μ1 alone. In comparison to control siRNA-treated cells, a greater level of cell death was observed following knockdown of both μ1 and σ3. Moreover, cell death following double knockdown of μ1 and σ3 occurred with kinetics that resembled those of cell death following knockdown of only μ1. Thus, the enhancement of cell death following μ1 knockdown occurs regardless of whether σ3 is present in cells.
L929 cells infected with reovirus undergo RIP3-dependent necroptosis (15, 16). It is possible, however, that μ1 knockdown changes the nature of cell death. To determine what form of cell death is enhanced by μ1 knockdown following T3D infection, we quantified cell death in μ1 knockdown cells treated with inhibitors of apoptotic or necroptotic cell death. Although treatment of cells with the pan-caspase inhibitor QVD completely blocked effector caspase (caspase-3/7) activity in reovirus-infected cells (Fig. 5A), it did not influence cell death in the presence of μ1 siRNA knockdown (Fig. 5B). These data suggest that, following knockdown of μ1, reovirus continues to induce a nonapoptotic form of cell death. To block necroptosis, we used a siRNA specific to RIP3 (Fig. 5C). Double knockdown of μ1 and RIP3 resulted in a diminishment of cell death (Fig. 5D). Thus, even following knockdown of μ1, L929 cells infected with reovirus undergo cell death via necroptosis.
FIG 5.

Knockdown of μ1 increases reovirus-induced necroptosis in L929 cells. (A and B) L929 cells were transfected with μ1 siRNA using Lipofectamine. Twenty-four hours following transfection, the cells were infected with T3D at a MOI of 10 PFU/cell and either were left untreated or were treated with 20 μM QVD when infection was initiated. At 30 h following infection, caspase-3/7 activity was determined by chemiluminescent assay (A) or cell death was quantified by AOEB staining (B). (C) L929 cells were transfected with control or RIP3 siRNA using INTERFERin. Cell lysates prepared 24 h following transfection were immunoblotted using anti-RIP3 and anti-PSTAIR antibodies. The level of RIP3, relative to PSTAIR, in control siRNA-treated cells was considered 100%. (D) L929 cells were cotransfected with siRNA specific to μ1 and β-galactosidase or μ1 and RIP3 using Lipofectamine. Thirty-six hours following transfection, cells were infected with T3D. At 30 h following infection, cell death was quantified by AOEB staining. Values for each independent infection and means are shown. Error bars indicate SDs. P values were determined by Student's t test. **, P < 0.005.
Knockdown of μ1 increases reovirus-induced necroptosis downstream of IFN signaling.
Based on previous data from our laboratory, we have proposed that necroptosis following reovirus infection requires expression of type I IFN and signaling via the IFN-α/β receptor (IFNAR) to allow expression of a currently unidentified ISG required for cell death (16). Thus, one possible way in which μ1 knockdown increases cell death could be through increased synthesis of type I IFN or through increased signaling via the IFNAR. We quantified levels of IFN-β mRNA and Z-DNA-binding protein 1 (ZBP1), as a representative ISG, in T3D-infected cells by reverse transcription (RT)-quantitative PCR (qPCR). At 18 h following infection, similar increases in the expression of IFN-β and ZBP1 mRNA were observed in control and μ1 siRNA-treated cells (Fig. 6A and B). These data suggest that enhanced induction of necroptosis in reovirus-infected cells with diminished levels of μ1 is not related to enhanced IFN-β induction or IFNAR signaling.
FIG 6.
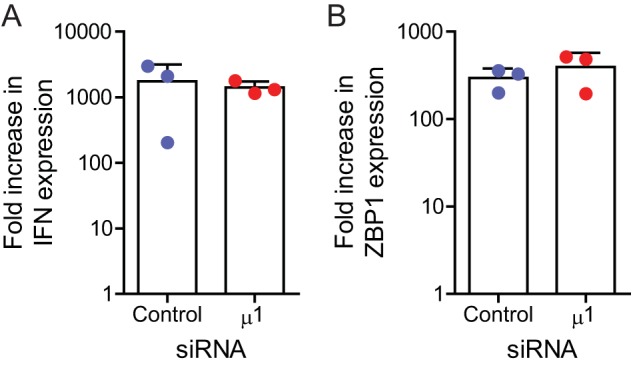
Reduction in μ1 levels does not affect IFN signaling following infection. L929 cells were transfected with β-galactosidase or μ1 siRNA using INTERFERin. Twenty-four hours following transfection, the cells were infected with T3D at a MOI of 10 PFU/cell. RNA extracted from infected cells, harvested 0 and 18 h postinfection, was reverse transcribed using random primers. Fold increases in levels of IFN-β (A) or ZBP1 mRNA (B), relative to GAPDH mRNA, over 18 h of infection were quantified by qPCR and comparative CT analyses. Values for each independent infection and means are shown. Error bars indicate SDs.
Viral RNA genome and secondary transcripts accumulate following μ1 knockdown.
Our previous evidence indicated that, in addition to IFN signaling, de novo generation of the viral dsRNA genome and/or a product dependent on dsRNA synthesis contributes to the induction of necroptosis by reovirus (16). Thus, one way in which μ1 knockdown can result in greater cell death is through increased accumulation of these viral components in infected cells. To address this issue, we measured the levels of viral minus-strand and plus-strand RNA in infected cells by strand-specific RT and qPCR. We used S1 gene-derived RNAs as representatives for these experiments. In comparison to control siRNA-treated cells, μ1 siRNA-treated cells contained ∼4-fold more minus-strand RNA at 21 h postinfection (Fig. 7A). Since minus-strand RNA exists only in the context of the dsRNA genome during reovirus replication (28), minus-strand RNA levels are indicative of the amount of genomic dsRNA. Thus, μ1 knockdown increases the level of progeny dsRNA. Significantly greater (∼2- to 3-fold) levels of the S1 plus strand were also observed in cells transfected with μ1 siRNA (Fig. 7B). While we observed increases in accumulation of both minus-strand and plus-strand RNA following knockdown of μ1, under both control and μ1 knockdown conditions there was substantially (∼100-fold) more plus-strand RNA than minus-strand RNA. Furthermore, there was no significant difference in the level of plus-strand RNA, relative to minus-strand RNA, when μ1 was knocked down (Fig. 7C).
FIG 7.

Knockdown of μ1 results in increased accumulation of viral RNAs following infection. L929 cells were transfected with control or μ1 siRNA using INTERFERin. Twenty-four hours following transfection, cells were infected with T3D at a MOI of 10 PFU/cell. RNA extracted from untreated infected cells, harvested 21 h postinfection (A, B, and C), or cells treated with 30 mM GuHCl at the time of infection, harvested 8 h postinfection (D), was reverse transcribed using primers specific for the minus strand or plus strand of the T3D S1 gene or GAPDH mRNA. (A, B, and D) Levels of accumulated T3D S1 minus-strand (A) or plus-strand (B and D) RNA, relative to GAPDH mRNA, were quantified by qPCR and comparative CT analysis. The ratio of T3D S1 RNA to GAPDH mRNA in control siRNA-treated cells was set to 1. (C) The level of the plus strand, relative to the minus strand, was quantified by qPCR and comparative CT analysis. Values for each independent infection and means are shown. Error bars indicate SDs. P values were determined by Student's t test. **, P < 0.005.
In reovirus-infected cells, plus-strand RNA is present in the context of viral genomic dsRNA and in the form of viral primary and secondary transcripts (29–32). Since the experiment described above was performed at 21 h, our plus-strand RNA measurements represent a combination of these plus-strand species. Under the conditions used, plus-strand RNA of the incoming genome is near the lower limit of detection of this assay and does not affect our measurements (data not shown). It is expected that, if plus-strand RNA were quantified early in infection, it would predominantly represent primary transcripts. Inclusion of guanidine hydrochloride (GuHCl), which blocks dsRNA synthesis and therefore secondary transcription (33), would ensure that only primary transcripts are present in cells. To determine whether μ1 knockdown affects primary transcription, we measured viral plus-strand RNA levels at 8 h postinfection in the presence of GuHCl. Under these conditions, the S1 plus strand accumulated to equivalent levels in control and μ1 siRNA-treated cells (Fig. 7D). Because primary transcript levels are unchanged following μ1 knockdown, these data suggest that the increase in plus-strand RNA levels observed later in infection is related to an increase in viral dsRNA, secondary transcripts, or both.
An increase in secondary mRNA transcripts should also result in an increase in the accumulation of viral proteins (34–38). In comparison to control cells, we observed significant increases in two representative viral proteins, namely, σNS and σ3, in cells transfected with μ1 siRNA (Fig. 8A and B). Together, our data suggest that products of reovirus infection (genomic dsRNA, secondary transcripts, and viral proteins) accumulate to higher levels when μ1 is knocked down.
FIG 8.
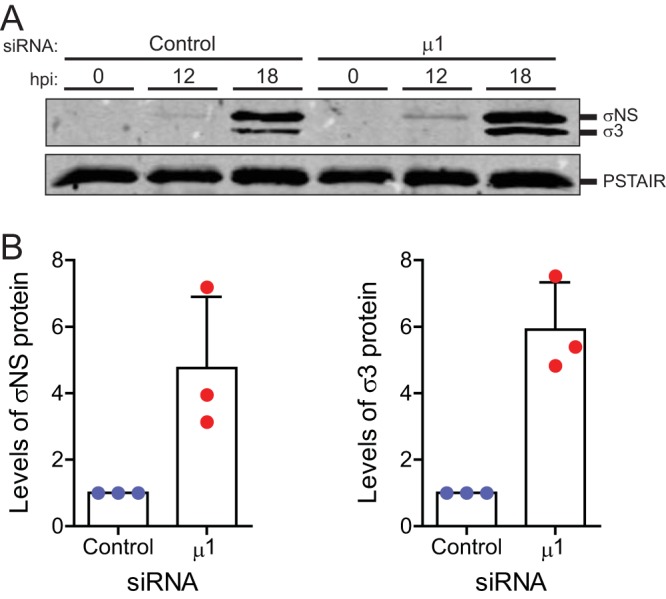
Knockdown of μ1 increases accumulation of other viral proteins following infection. L929 cells were transfected with control or μ1 siRNA using Lipofectamine. Twenty-four hours following transfection, cells were infected with T3D at a MOI of 10 PFU/cell. (A) Cell lysates prepared 0, 12, or 18 h postinfection (hpi) were immunoblotted for σNS protein with anti-σNS antiserum, for σ3 protein with antireovirus antiserum, and with anti-PSTAIR mAb. (B) Accumulated levels of σNS (left) and σ3 (right), relative to PSTAIR, at 18 h postinfection for each independent infection and means are shown. The ratio of viral protein to GAPDH for control siRNA-treated cells was set to 1. Error bars indicate SDs. P values were determined by Student's t test. *, P < 0.05; **, P < 0.005.
Knockdown of μ1 results in decreased sensitivity to the blocking effects of GuHCl.
Treatment of reovirus-infected cells with GuHCl results in blockade of progeny dsRNA synthesis and a concomitant reduction in necroptotic cell death (16, 33). Because we observed a greater level of dsRNA in infected cells following μ1 knockdown (Fig. 7), we asked whether the potency with which GuHCl influences dsRNA synthesis is altered in the absence of μ1. We found that, at 21 h postinfection in control siRNA-treated cells, GuHCl treatment diminished levels of S1 minus-strand RNA in a dose-dependent manner. Treatment with 15 mM GuHCl was sufficient to reduce levels of S1 minus-strand RNA by about 60% (Fig. 9A). In contrast, 15 mM GuHCl did not affect S1 minus-strand RNA levels in cells transfected with μ1 siRNA. Thus, μ1 knockdown influences the sensitivity of genomic dsRNA synthesis to GuHCl. We also measured the impact of GuHCl on the levels of viral plus-strand RNA following μ1 knockdown by RT-qPCR (Fig. 9B). Similar to findings observed for minus-strand RNA levels, GuHCl treatment reduced levels of S1 plus-strand RNA, in a dose-dependent manner, at 21 h postinfection in control siRNA-treated cells under control conditions. Treatment of control siRNA-treated cells with 15 mM GuHCl reduced levels of S1 plus-strand RNA by ∼60%. In contrast, 15 mM GuHCl reduced levels of S1 plus-strand RNA by only ∼25% following μ1 knockdown. Therefore, μ1 knockdown also decreases the sensitivity of viral plus-strand RNA to GuHCl. We note that, because the levels of minus-strand and plus-strand RNA are 2- to 4-fold greater when μ1 is knocked down (Fig. 7), even in the presence of higher concentrations of GuHCl, there is significantly more minus-strand and plus-strand RNA accumulated in μ1 siRNA-treated cells, relative to control siRNA-treated cells, when the levels of plus-strand and minus-strand RNA are equivalently decreased in the presence of control and μ1 siRNA (data not shown).
FIG 9.

Intracellular μ1 levels affect the sensitivity of viral RNA synthesis and cell death to GuHCl. L929 cells were transfected with control or μ1 siRNA using INTERFERin. Twenty-four hours following transfection, cells were infected with T3D at a MOI of 10 PFU/cell and processed using the conditions described. Cells were left untreated or 200 μM ribavirin or GuHCl at the indicated concentrations was added when infection was initiated. (A to C) RNA extracted from cells harvested 21 h (A and B) or 6 h (C) following infection was reverse transcribed using primers specific for the minus strand or plus strand of the T3D S1 gene or GAPDH mRNA. Fractions of accumulated T3D S1 minus-strand (A) or plus-strand (B and C) RNA, relative to GAPDH mRNA, in the presence of GuHCl or ribavirin was quantified by qPCR and comparative CT analysis for three independent infections. T3D S1 accumulation in the absence of treatment was set to 1 for each siRNA-treated sample. (D) At 30 h postinfection, cell death was quantified by AOEB staining. The fraction of cell death in the presence of GuHCl was quantified for three independent infections. Cell death in the absence of GuHCl was set to 1 for each siRNA-treated sample. Error bars indicated SDs. P values were determined by Student's t test. *, P < 0.05; **, P < 0.005.
Previous studies used concentrations of only up to 15 mM GuHCl to investigate plus-strand and minus-strand RNA synthesis following reovirus infection (16, 33). Because we used a significantly higher concentration of GuHCl, we sought to confirm that GuHCl did not affect primary transcription. Toward this end, we quantified levels of S1 plus-strand RNA in infected cells by RT-qPCR at 6 h postinfection (Fig. 9C). Ribavirin, which potently inhibits primary rounds of plus-strand RNA synthesis (39), was used as a control. As expected, ribavirin caused nearly complete inhibition of the synthesis of plus-strand RNA. Although treatment with increasing concentrations of GuHCl resulted in reduction of S1 plus-strand RNA levels, this reduction was significantly modest. Even at 50 mM GuHCl, no greater than ∼30% reduction in the levels of plus-strand RNA was observed. Whether the slight reduction in plus-strand RNA synthesis is a bona fide effect on the synthesis of primary transcripts at this higher GuHCl concentration or is seen because secondary transcription has already commenced in our infected cells was not evaluated in this study (40). Based on significantly greater reduction of plus-strand RNA later in infection, however, we conclude that GuHCl mainly affects later stages of infection that are dependent on minus-strand RNA synthesis, such as secondary transcription.
To determine whether knockdown of μ1 also confers a decrease in the sensitivity of cell death to GuHCl, we transfected cells with either control or μ1 siRNA and infected the cells with T3D in the presence of increasing concentrations of GuHCl. At 30 h postinfection, cell death was quantified by AOEB staining (Fig. 9D). Similar to the effect of GuHCl on RNA levels that we observed, control siRNA-treated cells demonstrated a dose-dependent decrease in cell death; 15 mM GuHCl was sufficient to reduce cell death by ∼75%. In contrast, when μ1 was knocked down, even a significantly higher concentration of GuHCl (50 mM) was able to reduce cell death by only ∼50%. While the relationship between the sensitivity of RNA synthesis and that of cell death to GuHCl is not linear, we think that the increased accumulation of minus-strand and plus-strand RNA in μ1 knockdown cells even in the presence of GuHCl (as described above) may be sufficient to contribute to the induction of cell death. Together, the decreased sensitivity of minus-strand RNA synthesis, secondary transcription, and cell death to GuHCl following μ1 knockdown suggests that the observed increase in cell death may be due to an increase in one or more viral products.
DISCUSSION
In this study, we assessed the role of newly synthesized μ1 in cell death following reovirus infection. We report that diminishment of the amount of newly synthesized μ1 does not affect the levels of apoptosis induced. Given the previously proposed role for μ1 in promoting apoptotic signaling, our data suggest that the role of μ1 in apoptosis is a function of μ1 as a component of incoming viral particles. Although knockdown of μ1 does not affect apoptosis induced by reovirus, μ1 knockdown enhances necroptotic cell death following reovirus infection. The loss of μ1 is accompanied by increases in accumulation of viral minus-strand RNA (a measure of dsRNA), plus-strand RNA (likely secondary transcripts produced from newly synthesized dsRNA), and viral proteins. Moreover, cell death following μ1 knockdown is less sensitive to GuHCl, an agent that blocks dsRNA synthesis. Based on these data, we conclude that increased accumulation of one of these viral gene products in the absence of μ1 results in enhanced cell death following reovirus infection. These data raise the following three questions. (i) How does μ1 knockdown affect the generation of viral gene products? (ii) How do μ1 levels influence the sensitivity of virus replication to GuHCl? (iii) How does an increase in viral gene products correlate with enhanced cell death by necroptosis? These issues are discussed below.
An intriguing observation from our experiments is the increased accumulation of viral products in the absence of μ1 (Fig. 7). Viral RNA is transcribed at two stages of reovirus replication, i.e., (i) during entry, by cores formed from incoming viral particles to generate primary transcripts, and (ii) during assembly, by progeny cores to generate secondary transcripts (29–32). Transcriptional activity following entry of the virus into cells correlates with loss of the outer capsid. In vitro studies demonstrate that cores, which lack μ1, and infectious subvirion particles that contain μ1 in an altered conformation (ISVP*), are transcriptionally active (41–45). In contrast, virions and infectious subvirion particles that contain μ1 in its native conformation (ISVPs) are not. When μ1 is in its native conformation, such as in virions and ISVPs, λ2, a core protein that forms turrets at the 12 icosahedral vertices of the virus, assumes a closed conformation (46). In contrast, λ2 assumes an open conformation in cores (46, 47). An open conformation for λ2 correlates with transcriptional activity, potentially because this allows for the entry of nucleotides and the exit of viral mRNA from these turrets (46, 47). Structural information on λ2 in ISVP*s is lacking but, because ISVP*s are capable of transcription, it is likely that the λ2 conformation in ISVP*s resembles that in cores more than that in ISVPs. How the transcriptional activity of progeny cores is regulated is not understood. However, based on the regulation of transcription during entry, it is reasonable to hypothesize that assembly of the outer capsid, composed of μ1-σ3 heterohexamers, onto progeny cores closes the structure of λ2, thereby shutting off transcription. We reason that, when μ1 is knocked down, outer capsid assembly is rendered inefficient; thus, more progeny cores are capable of performing secondary rounds of transcription or secondary transcription proceeds for a longer period (Fig. 10). We think that this may explain the increase in viral plus-strand RNA accumulation later in infection. Because the plus-strand RNA can be translated, we also observe an increase in the level of viral proteins. Finally, because the plus strand is packaged and used as a template for minus-strand synthesis, we also observe a greater level of minus-strand RNA in the absence of μ1. We hypothesize that continued propagation of this replication loop results in the accumulation of viral mRNA, protein, and minus-strand RNA we observed following loss of μ1.
FIG 10.

Model depicts late stages of reovirus replication following knockdown of μ1. Stages of reovirus replication proposed to be enhanced following knockdown of μ1 are indicated by double arrows.
We observed that, in the absence of μ1, GuHCl is less capable of inhibiting viral dsRNA synthesis and secondary transcription (Fig. 9). In reovirus-infected cells, GuHCl blocks progeny viral dsRNA synthesis (33). Because secondary transcription is dependent on dsRNA synthesis, GuHCl also diminishes secondary transcription. However, the viral target of GuHCl is not known, and the basis for GuHCl blocking these events during reovirus replication is not understood. Since GuHCl affects the synthesis of new dsRNA, it is possible that the viral target is the polymerase itself. However, because GuHCl has no effect on primary rounds of transcription, this would suggest that the polymerase functions differently during plus-strand and minus-strand RNA synthesis. Alternatively, GuHCl may target a factor that associates with progeny cores during dsRNA synthesis. Such a factor may be a viral nonstructural protein or an outer capsid protein that is known to interact with progeny cores, such as μ1. Thus, our data support the possibility that μ1 is the target of GuHCl-mediated effects on viral replication. However, direct evidence for this idea is thus far lacking.
Our previous work demonstrated a role for newly synthesized viral dsRNA in the induction of necroptosis by reovirus (16). Our data presented here suggest that necroptosis induction may require viral dsRNA or products dependent on its synthesis, such as secondary transcripts or maximal levels of viral proteins (Fig. 7 to 9). Genomic dsRNA is generated within core particles that are embedded in a viral factory matrix produced by viral nonstructural proteins. This arrangement is thought to prevent host detection of viral genomic RNA in infected cells. However, recent evidence indicates that reovirus factories can be stained by a dsRNA-specific antibody (48), suggesting that at least a portion of the dsRNA is accessible and likely available for detection. If this accessibility is altered by μ1 knockdown, then it could result in enhanced cell death. During primary rounds of transcription of reovirus RNA, the synthesized messages are capped and utilized for translation or packaging (49, 50). However, secondary transcripts, synthesized late in infection, are uncapped (32). If uncapped transcripts are the viral trigger for necroptosis, then it is possible that an increase in secondary transcripts produced by μ1 knockdown increases the amount of viral signature in infected cells, thereby leading to enhanced necroptosis. However, potential cellular sensors of dsRNA or secondary transcripts that contribute to cell death have yet to be identified. The loss of μ1 also results in increases in levels of other viral proteins (Fig. 8). Thus, increased levels of one or more viral proteins may also result in cell death. While the increase in σ3 produced by μ1 knockdown does not contribute to necroptosis, the accumulation of other viral proteins may lead to enhanced necroptosis. Connecting viral components to initiate signaling that leads to necroptosis requires further investigation.
In conclusion, this work identifies a new role for the viral protein μ1 in limiting the transcriptional activity of newly synthesized cores. Furthermore, the loss of μ1-mediated regulation of viral replication events late in infection results in enhanced cell death induction. These intriguing data also highlight the fact that μ1, in addition to playing an essential role in viral entry, can affect two different cell death pathways. The μ1 from the incoming viral capsid potentiates the activation of proapoptotic signaling pathways (10, 11). In contrast, newly synthesized μ1 that is generated in infected cells indirectly, by decreasing the accumulation of viral gene products, diminishes the levels of necroptosis following reovirus infection. Reovirus is currently being tested as an oncolytic agent, due to its ability to preferentially replicate in and kill cancer cells. Thus, optimizing the capacity for reovirus to induce a specific form of cell death through manipulation of the properties of the μ1 protein could be highly advantageous for maximizing its oncolytic potential.
MATERIALS AND METHODS
Cells.
L929 cells obtained from ATCC were maintained in Eagle’s minimal essential medium (EMEM) (Lonza) supplemented to contain 5% fetal bovine serum (FBS) (Life Technologies) and 2 mM l-glutamine (Invitrogen). Spinner-adapted murine L929 cells were maintained in Joklik’s minimal essential medium (Lonza) supplemented to contain 5% FBS (Sigma-Aldrich), 2 mM l-glutamine (Invitrogen), 100 U/ml penicillin (Invitrogen), 100 μg/ml streptomycin (Invitrogen), and 25 ng/ml amphotericin B (Sigma-Aldrich). Spinner-adapted L929 cells were used for cultivating, purifying, and titering viruses. HeLa cells obtained from Melanie Marketon’s laboratory at Indiana University were maintained in Dulbecco’s minimal essential medium (Lonza) supplemented to contain 5% FBS (Sigma-Aldrich) and 2 mM l-glutamine (Invitrogen).
Reagents.
QVD was purchased from Cayman Chemical Company. GuHCl and ribavirin were purchased from Sigma-Aldrich. Custom synthesized siRNAs were purchased from Dharmacon. siRNA targeting β-galactosidase was used as a control. The siRNA sequences used were as follows: β-galactosidase, CUACACAAAUCAGCGAUUU; μ1, GGAAAGAGUUAUAAAGAGA; σ3, GCGCAAGAGGGAUGGGACA. Antisera raised against reovirus capsid and σNS were obtained from T. Dermody and were described previously (51). Rabbit antiserum against RIP3 was purchased from ProSci. Mouse antiserum specific for the PSTAIR sequence was purchased from Sigma. Alexa Fluor-conjugated anti-mouse IgG and anti-rabbit IgG secondary antibodies were purchased from Invitrogen. IRDye-conjugated anti-guinea pig IgG was purchased from LI-COR.
Virus purification.
Prototype reovirus T3D, T1L, and T1L/T3DM2 strains were regenerated by plasmid-based reverse genetics ( 52). Purified reovirus virions were generated using second- or third-passage L-cell lysate stocks of reovirus. Viral particles were extracted from infected cell lysates with Vertrel XF (DuPont), layered onto CsCl gradients of 1.2 to 1.4 g/cm3, and centrifuged at 187,183 × g for 4 h. Bands corresponding to virions (1.36 g/cm3) were collected and dialyzed in virion storage buffer (150 mM NaCl, 15 mM MgCl2, 10 mM Tris-HCl [pH 7.4]) ( 53).
siRNA transfection.
In 96-well plates, 0.25 μl Lipofectamine 2000 was used to transfect siRNA to a final concentration of 100 nM or 0.75 μl INTERFERin (Polyplus) was used to transfect siRNA to a final concentration of 5 nM. Cells (1 × 10⁴) were seeded on top of the siRNA-Lipofectamine/INTERFERin mixture. In 24-well plates, 1.5 μl Lipofectamine 2000 was used to transfect siRNA to a final concentration of 42 nM or 3 μl INTERFERin was used to transfect siRNA to a final concentration of 15 nM. Cells (1 × 10⁵) were seeded on top of the siRNA-Lipofectamine/INTERFERin mixture. Virus infection was performed 28 to 48 h following siRNA transfection.
Infection and preparation of extracts.
Cells were adsorbed with either phosphate-buffered saline (PBS) or reovirus at room temperature for 1 h, followed by incubation with medium at 37°C for the indicated time. When needed, dimethyl sulfoxide (DMSO), ribavirin, GuHCl, carbobenzoxy-valyl-alanyl-aspartyl-(O-methyl)-fluoromethyl ketone (Z-VAD-FMK), or QVD was added to the medium immediately after the 1-h adsorption period. For preparation of whole-cell lysates, cells were washed in PBS, lysed with 1× RIPA (50 mM Tris [pH 7.5], 50 mM NaCl, 1% Triton X-100, 1% sodium deoxycholate, 0.1% SDS, and 1 mM EDTA) containing a protease inhibitor cocktail (Roche) and 2 mM phenylmethylsulfonyl fluoride (PMSF), and centrifuged at 15,000 × g for 10 min to remove debris.
Immunoblotting.
Cell lysates were resolved by electrophoresis on 10% polyacrylamide gels and transferred to nitrocellulose membranes. Membranes were blocked for at least 1 h in Tris-buffered saline (TBS) containing 5% milk or in StartingBlock T20 buffer (Thermo Fisher) and were incubated overnight at 4°C with antiserum against σNS (1:2,000), reovirus (1:10,000), RIP3 (1:1,000), or PSTAIR (1:10,000). Membranes were washed three times (5 min each) with washing buffer (TBS containing 0.1% Tween 20) and incubated with a 1:20,000 dilution in blocking buffer of Alexa Fluor-conjugated goat anti-rabbit IgG (for reovirus polyclonal and RIP3 antibodies), Alexa Fluor-conjugated goat anti-mouse IgG (for PSTAIR antibodies), or IRDye-conjugated anti-guinea pig IgG (for σNS antibodies). Following three washes, membranes were scanned using an Odyssey infrared imager (LI-COR) or a Chemidoc MP imaging system (Bio-Rad). Band intensities were analyzed using Image Studio Lite software (LI-COR).
Quantitation of cell death by AOEB staining.
ATCC L929 cells (2 × 10⁵) grown in 96-well plates were adsorbed with the indicated MOI of reovirus at room temperature for 1 h. The percentage of dead cells at the indicated time following infection was determined using AOEB staining, as described previously (6). For each experiment, >200 cells were counted, and the percentage of isolated cells exhibiting orange staining (ethidium bromide positivity) was determined by epi-illumination fluorescence microscopy using a fluorescein filter set on an Olympus IX71 microscope. For each experiment, mock infection was used as a baseline comparison for cell death. Because no more than 2% cell death was observed during mock infection of L929 cells, this measurement was not included in all figures evaluating cell death.
Assessment of viral growth.
L929 cells in 96-well plates were adsorbed in triplicate infections with T3D at 2 PFU/cell for 1 h. Cells were washed once with PBS and incubated in supplemented EMEM at 37°C for 24 h. The cells were frozen at −80°C and thawed twice prior to determination of viral titers by plaque assay. Viral yields were calculated according to the following formula: log10yield24h = log10(PFU/ml)24h − log10(PFU/ml)0h.
Plaque assays.
Plaque assays to determine infectivity were performed as described previously, with some modifications (53, 54). Briefly, control or heat-treated virus samples were diluted into PBS supplemented with 2 mM MgCl2. L-cell monolayers in 6-well plates (Greiner Bio-One) were infected with 100 μl of diluted virus for 1 h at room temperature. Following the viral attachment incubation, the monolayers were overlaid with 4 ml of serum-free medium 199 (Sigma-Aldrich) supplemented with 1% Bacto agar (BD Biosciences), 10 μg/ml Nα-p-tosyl-l-lysine chloromethyl ketone (TLCK)-treated chymotrypsin (Worthington Biochemical), 2 mM l-glutamine (Invitrogen), 100 U/ml penicillin (Invitrogen), 100 μg/ml streptomycin (Invitrogen), and 25 ng/ml amphotericin B (Sigma-Aldrich). The infected cells were incubated at 37°C, and plaques were counted 5 d postinfection.
Assessment of caspase-3/7 activity.
ATCC L929 cells (1 × 10⁴) were siRNA transfected as described above and seeded into black, clear-bottomed, 96-well plates. Twenty-four hours following transfection, cells were adsorbed with 10 PFU/cell of reovirus in serum-free medium at room temperature for 1 h. Following incubation of cells at 37°C for 48 h, caspase-3/7 activity was quantified using the Caspase-Glo-3/7 assay system (Promega). Luminescence was quantified using a Synergy H1 hybrid reader (BioTek).
RT-qPCR.
RNA was extracted from infected cells, at various times after infection, using a total RNA minikit (Bio-Rad). For RT-qPCR, 0.5 to 2 μg of RNA was reverse transcribed with the high-capacity cDNA RT kit (Applied Biosystems), using random hexamers for amplification of cellular genes or gene-specific primers for amplification of either minus-strand or plus-strand viral RNA. Gene-specific primers were used at a final concentration of 0.1 μM. Undiluted cDNA (for host transcripts and virus minus strand) or a 1:10 dilution of the cDNA (for viral plus strand) was subjected to PCR using SYBR Select Master Mix (Applied Biosystems). Fold increases in gene expression with respect to control samples (indicated in each figure legend) were measured using the ΔΔCT method (55). Calculations for determining ΔΔCT values and relative levels of gene expression were performed as follows: (i) fold increase in cellular gene expression (with respect to glyceraldehyde-3-phosphate dehydrogenase [GAPDH] levels) = 2−[(gene of interest CT – GAPDH CT)24 h – (gene of interest CT – GAPDH CT)0 h]; (ii) fold increase in viral gene expression = 2−[(T3D S1 CT – GAPDH CT)μ1 siRNA – (T3D S1 CT – GAPDH CT)control siRNA]; (iii) plus-strand RNA/minus-strand RNA ratio = 2−[(T3D S1 CT – GAPDH CT)plus-strand RNA – (T3D S1 CT – GAPDH CT)minus-strand RNA]; (iv) relative levels of RNA following treatment with GuHCl = 2−[(T3D S1 CT – GAPDH CT)15–50 mM GuHCl – (T3D S1 CT – GAPDH CT)0 mM GuHCl].
Statistical analysis.
Statistical significance between experimental groups was determined using the unpaired Student's t test function in Excel, and results were graphed using GraphPad Prism software. Statistical analyses for differences in gene expression determined by RT-qPCR were performed on the ΔCT values.
ACKNOWLEDGMENTS
We thank members of our laboratory and the Indiana University virology community for helpful suggestions.
Research reported in this publication was supported by the National Institute of Allergy and Infectious Diseases of the National Institutes of Health under award 1R01AI110637 (to P.D.). The content is solely the responsibility of the authors and does not necessarily represent the official views of the funders.
REFERENCES
- 1.Danthi P. 2016. Viruses and the diversity of cell death. Annu Rev Virol 3:533–553. doi: 10.1146/annurev-virology-110615-042435. [DOI] [PubMed] [Google Scholar]
- 2.Upton JW, Chan FK. 2014. Staying alive: cell death in antiviral immunity. Mol Cell 54:273–280. doi: 10.1016/j.molcel.2014.01.027. [DOI] [PMC free article] [PubMed] [Google Scholar]
- 3.DeBiasi RL, Robinson BA, Sherry B, Bouchard R, Brown RD, Rizeq M, Long C, Tyler KL. 2004. Caspase inhibition protects against reovirus-induced myocardial injury in vitro and in vivo. J Virol 78:11040–11050. doi: 10.1128/JVI.78.20.11040-11050.2004. [DOI] [PMC free article] [PubMed] [Google Scholar]
- 4.Oberhaus SM, Smith RL, Clayton GH, Dermody TS, Tyler KL. 1997. Reovirus infection and tissue injury in the mouse central nervous system are associated with apoptosis. J Virol 71:2100–2106. [DOI] [PMC free article] [PubMed] [Google Scholar]
- 5.Danthi P, Pruijssers AJ, Berger AK, Holm GH, Zinkel SS, Dermody TS. 2010. Bid regulates the pathogenesis of neurotropic reovirus. PLoS Pathog 6:e1000980. doi: 10.1371/journal.ppat.1000980. [DOI] [PMC free article] [PubMed] [Google Scholar]
- 6.Tyler KL, Squier MK, Rodgers SE, Schneider BE, Oberhaus SM, Grdina TA, Cohen JJ, Dermody TS. 1995. Differences in the capacity of reovirus strains to induce apoptosis are determined by the viral attachment protein σ1. J Virol 69:6972–6979. [DOI] [PMC free article] [PubMed] [Google Scholar]
- 7.Tyler KL, Squier MK, Brown AL, Pike B, Willis D, Oberhaus SM, Dermody TS, Cohen JJ. 1996. Linkage between reovirus-induced apoptosis and inhibition of cellular DNA synthesis: role of the S1 and M2 genes. J Virol 70:7984–7991. [DOI] [PMC free article] [PubMed] [Google Scholar]
- 8.Connolly JL, Barton ES, Dermody TS. 2001. Reovirus binding to cell surface sialic acid potentiates virus-induced apoptosis. J Virol 75:4029–4039. doi: 10.1128/JVI.75.9.4029-4039.2001. [DOI] [PMC free article] [PubMed] [Google Scholar]
- 9.Danthi P, Hansberger MW, Campbell JA, Forrest JC, Dermody TS. 2006. JAM-A-independent, antibody-mediated uptake of reovirus into cells leads to apoptosis. J Virol 80:1261–1270. doi: 10.1128/JVI.80.3.1261-1270.2006. [DOI] [PMC free article] [PubMed] [Google Scholar]
- 10.Danthi P, Coffey CM, Parker JS, Abel TW, Dermody TS. 2008. Independent regulation of reovirus membrane penetration and apoptosis by the μ1 φ domain. PLoS Pathog 4:e1000248. doi: 10.1371/journal.ppat.1000248. [DOI] [PMC free article] [PubMed] [Google Scholar]
- 11.Danthi P, Kobayashi T, Holm GH, Hansberger MW, Abel TW, Dermody TS. 2008. Reovirus apoptosis and virulence are regulated by host cell membrane penetration efficiency. J Virol 82:161–172. doi: 10.1128/JVI.01739-07. [DOI] [PMC free article] [PubMed] [Google Scholar]
- 12.Coffey CM, Sheh A, Kim IS, Chandran K, Nibert ML, Parker JS. 2006. Reovirus outer capsid protein μ1 induces apoptosis and associates with lipid droplets, endoplasmic reticulum, and mitochondria. J Virol 80:8422–8438. doi: 10.1128/JVI.02601-05. [DOI] [PMC free article] [PubMed] [Google Scholar]
- 13.Wisniewski ML, Werner BG, Hom LG, Anguish LJ, Coffey CM, Parker JS. 2011. Reovirus infection or ectopic expression of outer capsid protein μ1 induces apoptosis independently of the cellular proapoptotic proteins Bax and Bak. J Virol 85:296–304. doi: 10.1128/JVI.01982-10. [DOI] [PMC free article] [PubMed] [Google Scholar]
- 14.Connolly JL, Dermody TS. 2002. Virion disassembly is required for apoptosis induced by reovirus. J Virol 76:1632–1641. doi: 10.1128/JVI.76.4.1632-1641.2002. [DOI] [PMC free article] [PubMed] [Google Scholar]
- 15.Berger AK, Danthi P. 2013. Reovirus activates a caspase-independent cell death pathway. mBio 4:e00178-13. doi: 10.1128/mBio.00178-13. [DOI] [PMC free article] [PubMed] [Google Scholar]
- 16.Berger AK, Hiller BE, Thete D, Snyder AJ, Perez E Jr, Upton JW, Danthi P. 2017. Viral RNA at two stages of reovirus infection is required for the induction of necroptosis. J Virol 91:e02404-16. doi: 10.1128/JVI.02404-16. [DOI] [PMC free article] [PubMed] [Google Scholar]
- 17.Newton K, Manning G. 2016. Necroptosis and inflammation. Annu Rev Biochem 85:743–763. doi: 10.1146/annurev-biochem-060815-014830. [DOI] [PubMed] [Google Scholar]
- 18.Hiller BE, Berger AK, Danthi P. 2015. Viral gene expression potentiates reovirus-induced necrosis. Virology 484:386–394. doi: 10.1016/j.virol.2015.06.018. [DOI] [PMC free article] [PubMed] [Google Scholar]
- 19.Roebke KE, Danthi P. 2019. Cell entry-independent role for the reovirus μ1 protein in regulating necroptosis and the accumulation of viral gene products. bioRxiv doi: 10.1101/541623. [DOI] [PMC free article] [PubMed]
- 20.Kim JW, Lyi SM, Parrish CR, Parker JS. 2011. A proapoptotic peptide derived from reovirus outer capsid protein μ1 has membrane-destabilizing activity. J Virol 85:1507–1516. doi: 10.1128/JVI.01876-10. [DOI] [PMC free article] [PubMed] [Google Scholar]
- 21.Connolly JL, Rodgers SE, Clarke P, Ballard DW, Kerr LD, Tyler KL, Dermody TS. 2000. Reovirus-induced apoptosis requires activation of transcription factor NF-κB. J Virol 74:2981–2989. doi: 10.1128/JVI.74.7.2981-2989.2000. [DOI] [PMC free article] [PubMed] [Google Scholar]
- 22.Danthi P, Holm GH, Stehle T, Dermody TS. 2013. Reovirus receptors, cell entry, and proapoptotic signaling. Adv Exp Med Biol 790:42–71. doi: 10.1007/978-1-4614-7651-1_3. [DOI] [PMC free article] [PubMed] [Google Scholar]
- 23.Tillotson L, Shatkin AJ. 1992. Reovirus polypeptide σ3 and N-terminal myristoylation of polypeptide μ1 are required for site-specific cleavage to μ1C in transfected cells. J Virol 66:2180–2186. [DOI] [PMC free article] [PubMed] [Google Scholar]
- 24.Shepard DA, Ehnstrom JG, Schiff LA. 1995. Association of reovirus outer capsid proteins σ3 and μ1 causes a conformational change that renders σ3 protease sensitive. J Virol 69:8180–8184. [DOI] [PMC free article] [PubMed] [Google Scholar]
- 25.Liemann S, Chandran K, Baker TS, Nibert ML, Harrison SC. 2002. Structure of the reovirus membrane-penetration protein, μ1, in a complex with its protector protein, σ3. Cell 108:283–295. doi: 10.1016/S0092-8674(02)00612-8. [DOI] [PMC free article] [PubMed] [Google Scholar]
- 26.Schmechel S, Chute M, Skinner P, Anderson R, Schiff L. 1997. Preferential translation of reovirus mRNA by a σ3-dependent mechanism. Virology 232:62–73. doi: 10.1006/viro.1997.8531. [DOI] [PubMed] [Google Scholar]
- 27.Yue Z, Shatkin AJ. 1997. Double-stranded RNA-dependent protein kinase (PKR) is regulated by reovirus structural proteins. Virology 234:364–371. doi: 10.1006/viro.1997.8664. [DOI] [PubMed] [Google Scholar]
- 28.Sakuma S, Watanabe Y. 1972. Reovirus replicase-directed synthesis of double-stranded ribonucleic acid. J Virol 10:628–638. [DOI] [PMC free article] [PubMed] [Google Scholar]
- 29.Sakuma S, Watanabe Y. 1971. Unilateral synthesis of reovirus double-stranded ribonucleic acid by a cell free replicase system. J Virol 8:190–196. [DOI] [PMC free article] [PubMed] [Google Scholar]
- 30.Skup D, Millward S. 1980. mRNA capping enzymes are masked in reovirus progeny subviral particles. J Virol 34:490–496. [DOI] [PMC free article] [PubMed] [Google Scholar]
- 31.Morgan EM, Zweerink HJ. 1975. Characterization of transcriptase and replicase particles isolated from reovirus infected cells. Virology 68:455–466. doi: 10.1016/0042-6822(75)90286-X. [DOI] [PubMed] [Google Scholar]
- 32.Zarbl H, Skup S, Millward S. 1980. Reovirus progeny subviral particles synthesize uncapped mRNA. J Virol 34:497–505. [DOI] [PMC free article] [PubMed] [Google Scholar]
- 33.Murray KE, Nibert ML. 2007. Guanidine hydrochloride inhibits mammalian orthoreovirus growth by reversibly blocking the synthesis of double-stranded RNA. J Virol 81:4572–4584. doi: 10.1128/JVI.02106-06. [DOI] [PMC free article] [PubMed] [Google Scholar]
- 34.Skup D, Millward S. 1980. Reovirus-induced modification of cap-dependent translation in infected L cells. Proc Natl Acad Sci U S A 77:152–156. doi: 10.1073/pnas.77.1.152. [DOI] [PMC free article] [PubMed] [Google Scholar]
- 35.Skup D, Zarbl H, Millward S. 1981. Regulation of translation in L-cells infected with reovirus. J Mol Biol 151:35–55. doi: 10.1016/0022-2836(81)90220-5. [DOI] [PubMed] [Google Scholar]
- 36.Lemieux R, Zarbl H, Millward S. 1984. mRNA discrimination in extracts from uninfected and reovirus-infected L-cells. J Virol 51:215–222. [DOI] [PMC free article] [PubMed] [Google Scholar]
- 37.Sonenberg N, Skup D, Trachsel H, Millward S. 1981. In vitro translation in reovirus- and poliovirus-infected cell extracts: effects of anti-cap binding protein monoclonal antibody. J Biol Chem 256:4138–4141. [PubMed] [Google Scholar]
- 38.Detjen BM, Walden WE, Thach RE. 1982. Translational specificity in reovirus-infected mouse fibroblasts. J Biol Chem 257:9855–9860. [PubMed] [Google Scholar]
- 39.Rankin UT Jr, Eppes SB, Antczak JB, Joklik WK. 1989. Studies on the mechanism of the antiviral activity of ribavirin against reovirus. Virology 168:147–158. doi: 10.1016/0042-6822(89)90413-3. [DOI] [PubMed] [Google Scholar]
- 40.Acs G, Klett H, Schonberg M, Christman J, Levin DH, Silverstein JC. 1971. Mechanism of reovirus double-stranded RNA synthesis in vivo and in vitro. J Virol 8:684–689. [DOI] [PMC free article] [PubMed] [Google Scholar]
- 41.Borsa J, Long DG, Copps TP, Sargent MD, Chapman JD. 1974. Reovirus transcriptase activation in vitro: further studies on the facilitation phenomenon. Intervirology 3:15–35. doi: 10.1159/000149739. [DOI] [PubMed] [Google Scholar]
- 42.Borsa J, Long DG, Sargent MD, Copps TP, Chapman JD. 1974. Reovirus transcriptase activation in vitro: involvement of an endogenous uncoating activity in the second stage of the process. Intervirology 4:171–188. doi: 10.1159/000149856. [DOI] [PubMed] [Google Scholar]
- 43.Chandran K, Farsetta DL, Nibert ML. 2002. Strategy for nonenveloped virus entry: a hydrophobic conformer of the reovirus membrane penetration protein μ1 mediates membrane disruption. J Virol 76:9920–9933. doi: 10.1128/JVI.76.19.9920-9933.2002. [DOI] [PMC free article] [PubMed] [Google Scholar]
- 44.Farsetta DL, Chandran K, Nibert ML. 2000. Transcriptional activities of reovirus RNA polymerase in recoated cores: initiation and elongation are regulated by separate mechanisms. J Biol Chem 275:39693–39701. doi: 10.1074/jbc.M004562200. [DOI] [PubMed] [Google Scholar]
- 45.Banerjee AK, Shatkin AJ. 1970. Transcription in vitro by reovirus-associated ribonucleic acid-dependent polymerase. J Virol 6:1–11. [DOI] [PMC free article] [PubMed] [Google Scholar]
- 46.Dryden KA, Wang G, Yeager M, Nibert ML, Coombs KM, Furlong DB, Fields BN, Baker TS. 1993. Early steps in reovirus infection are associated with dramatic changes in supramolecular structure and protein conformation: analysis of virions and subviral particles by cryoelectron microscopy and image reconstruction. J Cell Biol 122:1023–1041. doi: 10.1083/jcb.122.5.1023. [DOI] [PMC free article] [PubMed] [Google Scholar]
- 47.Reinisch KM, Nibert ML, Harrison SC. 2000. Structure of the reovirus core at 3.6 Å resolution. Nature 404:960–967. doi: 10.1038/35010041. [DOI] [PubMed] [Google Scholar]
- 48.Tenorio R, Fernandez de Castro I, Knowlton JJ, Zamora PF, Lee CH, Mainou BA, Dermody TS, Risco C. 2018. Reovirus σNS and μNS proteins remodel the endoplasmic reticulum to build replication neo-organelles. mBio 9:e01253-18. doi: 10.1128/mBio.01253-18. [DOI] [PMC free article] [PubMed] [Google Scholar]
- 49.Furuichi Y, Muthukrishnan S, Shatkin AJ. 1975. 5´-Terminal M7G(5´)ppp(5´)Gmp in vivo: identification in reovirus genome RNA. Proc Natl Acad Sci U S A 72:742–745. doi: 10.1073/pnas.72.2.742. [DOI] [PMC free article] [PubMed] [Google Scholar]
- 50.Silverstein SC, Astell C, Levin DH, Schonberg M, Acs G. 1972. The mechanism of reovirus uncoating and gene activation in vivo. Virology 47:797–806. doi: 10.1016/0042-6822(72)90571-5. [DOI] [PubMed] [Google Scholar]
- 51.Becker MM, Peters TR, Dermody TS. 2003. Reovirus σNS and μNS proteins form cytoplasmic inclusion structures in the absence of viral infection. J Virol 77:5948–5963. doi: 10.1128/JVI.77.10.5948-5963.2003. [DOI] [PMC free article] [PubMed] [Google Scholar]
- 52.Kobayashi T, Ooms LS, Ikizler M, Chappell JD, Dermody TS. 2010. An improved reverse genetics system for mammalian orthoreoviruses. Virology 398:194–200. doi: 10.1016/j.virol.2009.11.037. [DOI] [PMC free article] [PubMed] [Google Scholar]
- 53.Berard A, Coombs KM. 2009. Mammalian reoviruses: propagation, quantification, and storage. Curr Protoc Microbiol Chapter 15:Unit15C.1. doi: 10.1002/9780471729259.mc15c01s14. [DOI] [PubMed] [Google Scholar]
- 54.Middleton JK, Severson TF, Chandran K, Gillian AL, Yin J, Nibert ML. 2002. Thermostability of reovirus disassembly intermediates (ISVPs) correlates with genetic, biochemical, and thermodynamic properties of major surface protein μ1. J Virol 76:1051–1061. doi: 10.1128/JVI.76.3.1051-1061.2002. [DOI] [PMC free article] [PubMed] [Google Scholar]
- 55.Schmittgen TD, Livak KJ. 2008. Analyzing real-time PCR data by the comparative CT method. Nat Protoc 3:1101–1108. doi: 10.1038/nprot.2008.73. [DOI] [PubMed] [Google Scholar]