

Abstract
A commercially-available, 3D printer nanocomposite filament of carbon nanotubes (CNTs) and acrylonitrile-butadiene-styrene (ABS) was analyzed with respect to its VOC emissions during simulated fused deposition modelling (FDM) and compared with a regular ABS filament. VOC emissions were quantified and characterized under a variety of conditions to simulate the thermal degradation that takes place during FDM. Increasing residence time and temperature resulted in significant increases in VOC emissions and oxygen content of the reaction gas influenced the VOC profile. In agreement with other studies, the primary emitted VOC was styrene. Multiple compounds are reported in this work for the first time as having formed during FDM, including 4-vinylcyclohexene and 2-phenyl-2-propanol. Our results show that printing 222.0 g of filament is enough to surpass the reference concentration for inhalation exposure of 1 mg/m3 according to the EPA’s Integrated Risk Information System (IRIS). The presence of CNTs in the filament influenced VOC yields and product ratios through three types of surface interactions: 1) adsorption of O2 on CNTs lowers the available O2 for oxidation of primary backbone cleavage intermediates, 2) adsorption of styrene and other VOCs to CNTs leads to surface-catalyzed degradation, and 3) CNTs act as a trap for certain VOCs and prevent them from entering vapor emissions. While the presence of CNTs in the filament lowered the total VOC emission under most experimental conditions, they increased the emission of the most hazardous VOCs, such as α-methylstyrene and benzaldehyde. The present study has identified an increased risk associated with the use of CNT nanocomposites in 3D printing.
Graphical Abstract

Introduction
There is a growing concern over hazardous emissions from 3D printers using fused deposition modelling (FDM) as they become more affordable and enter more workplaces and consumer households. 3D printers operate at borderline temperatures of thermal degradation reactions for polymer filament feedstock. Despite design efforts to limit exposure, printing emissions are still a threat to user health1. Emissions from FDM can be grouped into two categories: particulate matter (PM) and gas-phase compounds. Particulate matter emitted from 3D printers has been studied across a variety of size ranges2–10, including nanoparticle emission11–15. Studies involving gas-phase compounds usually concern volatile organic compounds (VOCs). While some studies quantify total VOCs3, 7, there have been few attempts to fully characterize and quantify VOC emissions5–6, 16–17.
Acrylonitrile-butadiene-styrene (ABS) is a common polymer used in FDM (Figure 1). Thermal degradation of ABS has been studied in the past under conditions of extrusion18 and incineration19. 3D printing filaments often contain additives to adjust their physicochemical properties. Common additives include: dyes, plasticizers, stabilizers, wood particles, metal particles, and carbon allotropes. Many of these additives can either degrade into VOCs or contribute to their formation. The effects of many filament additives on VOC emissions during FDM has not been studied.
Figure 1.

Typical structure of co-linear ABS polymer.
Nanocomposites consisting of carbon nanotubes (CNTs) and a variety of polymers can be made with unique mechanical and electrical properties20–21. These CNT nanocomposites are used with 3D printers to produce conductive electrical components22. Despite the increasing usage of CNT nanocomposites, their influence on hazardous VOC emissions during FDM has not been investigated. The adsorptive properties of CNTs have also been extensively studied on VOCs23, including aromatic species24–25. A thorough understanding of the role CNTs play in VOC formation in thermal processes is critical to limiting health risks to 3D printer users.
In this work, two commercially-available 3D printer filaments, consisting of an ABS-CNT nanocomposite and a plain ABS, were subjected to thermal conditions that simulate FDM. VOC emissions from the simulated printing were quantified and characterized to determine the effect of CNT addition on hazardous emissions.
Materials and Methods
3D printer filaments were purchased from 3DXTech. The ABS filament is from the standard ABS product line and the nanocomposite ABS-CNT filament is from the 3DXNano ESD product line. The ABS-CNT filament is advertised to contain CNTs, but the concentration is not reported. Quartz sample baskets were made in the LSU Chemistry Department glassblowing shop. Pure reference standards used for quantification were purchased from Sigma-Aldrich and dissolved in dichloromethane (DCM) to create calibration curves. HPLC-grade DCM was purchased from Fisher Scientific.
All degradation experiments were performed using the System for Thermal Diagnostic Studies (STDS)26. The STDS is a custom-built, modular instrument that has been previously used to provide thermal conditions for combustion of various waste components27–28. A diagram for the STDS can be found in the Supplemental Information (Figure S1). The STDS consists of a ceramic furnace and quartz reactor housed within a gas chromatograph (GC) oven. Gas-phase compounds leaving the reactor pass through a heated transfer line into the injection port of a second GC where they are separated and detected by mass spectrometer (MS). The advantages of the STDS include being a closed system with direct transfer of products into the detection module, which minimizes sample loss and increases detection sensitivity. Approximately 50–100 mg of filament was weighed and placed in a quartz sample holder basket (15 mm x 4 mm i.d.) above the heated reactor. For pyrolysis experiments, the sample was purged with N2 at room temperature for 3 minutes. The sample was then lowered into the preheated reactor and pyrolysis began. During reaction, the second, analytical GC oven was kept at −60 °C to condense all compounds that passed through the 280°C transfer line. Gas flow rate was set at each temperature to maintain a vapor residence time in the reactor of approximately 0.2 seconds. After reaction completion, the transfer line was removed from the injection port of the second GC and analysis of the reaction products began. Analysis of reaction products was conducted using an Agilent 6890N GC equipped with a DB5-MS column (30 m x 0.25 mm x 0.25 µm) and a 5973N MS with an electron impact (EI) ion source set at 70 eV. The temperature program was as follows: −60°C initial temperature held for 0.5 min; followed by heating at a rate of 15°C/min to 130°C; held for 1 min; heated to 225°C at a rate of 25°C/min; and finally heated to 300°C at 10°C/min and held for 7 minutes, giving a total runtime of 32.47 minutes. The GC inlet and MS quadrupole temperatures were 280°C and 150°C, respectively. The split/splitless inlet was set to a constant split flow of 10 mL/min. The carrier gas used was ultra-high purity helium (UHP, 99.999%) at a constant column flow of 1.0 mL/min. However, during sample collection, the flow of N2 through the transfer line was high enough to increase the column flow to 2 mL/min or above, with the remainder going out the split vent. The mass spectrometer was operated in total ion count mode (TIC) over a mass scan range of 50–500 amu. Identification of pyrolysis products was performed using the Wiley and NIST libraries and by comparison of retention times with those of purchased standard compounds. VOC emissions were calculated by dividing the emitted mass of each VOC by the mass of filament used in the experiment and reported as µg/g. Additional information on the quantification methods and method detection limits can be found in the Supporting Information. Mass loss was calculated by weighing the filament prior to reaction and dividing by the filament mass after reaction.
Reaction conditions were selected to simulate common 3D printer parameters. The manufacturer recommended printing temperatures are 220–240 °C for the ABS filament and 230–260 °C for the ABS-CNT filament. A printing temperature of 230 °C was selected for consistency between samples, but users often change printing temperatures to alter printed objects and extruder nozzles are unlikely to heat uniformly. To account for user preference and nozzle construction, degradation experiments were also performed at 200°C and 300°C. The residence time in the heated area of the printer is based on the feed rate of the filament and the length of the extruder nozzle. Feed rate is often changed by the user to affect the quality of the printed object. Residence times of one and three minutes were investigated. The design of 3D printer nozzles can lead to oxygen-deprived conditions inside the nozzle where melted filament is exposed to the highest temperatures. To better understand the role of oxygen in the thermal degradation of 3D printer filament, experiments were carried out in both pyrolytic (N2) and oxidative (4% O2/N2) conditions.
Results and Discussion
Degradation Products.
Thermogravimetric studies of ABS polymer do not show any significant mass loss at temperatures below 325°C29. Despite mass loss during these experiments being very low (< 1% for all experiments), simulated FDM has yielded emissions of several VOCs. The major components of VOC emissions from simulated 3D printing are shown in Table 1 and their associated structures are presented in Table S1. All of these compounds, except for 2,6-di-tert-butylquinone and 2,4-di-tert-butylphenol, have been found in previous studies involving ABS incineration and heated extrusion18–19. Studies involving VOC emissions from ABS filament have shown different compound profiles and VOC concentrations obtained from similar filaments from different manufacturers5. The emitted VOCs in the current experiments are likely the result of either desorption of unreacted monomer from the polymer matrix or slow degradation/depolymerization of the ABS polymer. In this work, styrene comprises a significant portion of total VOC emissions and justifies the assumption of trapped monomer as the primary VOC emission. Tetramethylsuccinonitrile (TMSN) and 2,4-di-tert-butylphenol, a polymerization byproduct and polymer stabilizer, respectively, are likely part of the polymer synthesis process and volatilized during heating.
Table 1.
Major components of VOC emissions from thermal degradation of ABS 3D printer filament.
| compound | source |
|---|---|
| 4-vinylcyclohexene | butadiene monomer dimerization |
| ethylbenzene | polymer backbone cleavage |
| styrene | unreacted monomer / backbone cleavage |
| isopropylbenzene | polymer backbone cleavage |
| benzaldehyde | oxidation of backbone cleavage intermediate |
| α-methylstyrene | polymer backbone cleavage |
| tetramethylsuccinonitrile | polymerization byproduct |
| acetophenone | oxidation of backbone cleavage intermediate |
| 2-phenyl-2-propanol | oxidation of backbone cleavage intermediate |
| 2,6-di-tert-butylquinone | 2,4-di-tert-butylphenol degradation |
| 2,4-di-tert-butylphenol | polymer UV-stabilizer |
Other compounds, unlikely to be present in pristine polymer material, were also detected. Ethylbenzene is the most commonly reported styrene degradation product5–6, 11, 16 but in this work we also report 4-vinylcyclohexene, isopropylbenzene, benzaldehyde, α-methylstyrene, acetophenone, and 2-phenyl-2-propanol. Figure 2 presents proposed pathways to the observed thermal degradation products of ABS at low temperatures. Based on the proposed pathways, the depolymerization process is initiated through the cleavage of polymer backbone at β-carbons with respect to either phenyl or nitrile groups. The VOC sources in Table 1 are inferred from these pathways based on where cleavage occurred on the polymer backbone and whether additional oxygen atoms have been incorporated into their structure.
Figure 2.

Pathways of the low temperature depolymerization of ABS filament. Solid arrows signify primary polymer backbone degradation products. Dashed arrows signify secondary products formed by the oxygenation of primary products.
VOC Emission.
Emissions for VOCs from different reaction temperatures, residence times, and oxygen contents are shown in Figure 3. Complete data tables are presented in the Supplemental Information (Table S2). Interestingly, some oxygenated products were observed under pyrolytic conditions such as acetophenone and benzaldehyde. This may suggest that oxygen is adsorbed to the polymer matrix.
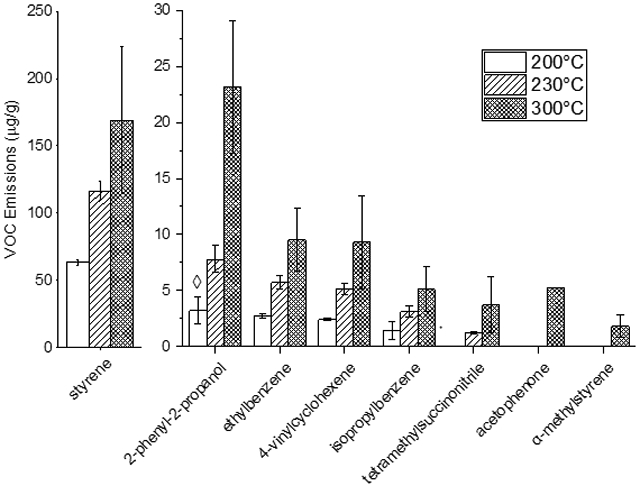
Figure 3.

VOC emissions from thermal degradation of ABS and ABS-CNT composite. Experiment names are generated from the temperature + residence time + reaction gas + filament type.
Role of Residence Time.
For all measured conditions, increasing the residence time from 1 to 3 minutes led to increased yields of all observed products. As seen in Figure 3, the increase in VOC emissions was not directly proportional to the increase in residence time. For 200 and 230°C, styrene emission increased by an order of magnitude when increasing the residence time from 1 to 3 minutes. At 300°C, tripling the residence time increased styrene emission by a factor of approximately four. The significant increase in the effect of residence time seen at lower temperatures could indicate that a residence time of 1 minute is too short for accurate analysis due to the time needed for the filament to equilibrate to the reactor temperature. Therefore, the results for experiments with a residence time of 3 minutes are more accurate predictions of actual printer emissions.
Role of Temperature.
Extrusion temperature in 3D printers is typically selected through a combination of user preference and manufacturer suggestions. Extrusion temperature is both the most commonly adjusted printing parameter and had the most significant effect on VOC emissions. Across all parameter combinations, higher temperature resulted in higher yields of every individual VOC. Figure 4 compares VOC emissions from ABS filament in pure N2 at 200°C, 230°C, and 300°C for 3 minutes.
Figure 4.
Individual VOC emissions from pyrolysis of ABS filament for 3 minutes in pure N2 at 200, 230, and 300 °C. Error bars represent +/− one standard deviation. ◊ = below method detection limit
Acetophenone and α-methylstyrene were typically not detected until 300°C under pyrolytic conditions. However, both acetophenone and α-methylstyrene were formed at 230°C by the addition of O2 and CNTs, respectively. Despite temperature having the greatest effect, no individual parameter can be used to predict VOC emissions.
Role of Oxygen.
Depending on the design of the extruder nozzle, melted filament may be exposed to oxygen-deprived conditions prior to exiting the nozzle into air. Thus, the construction of extruder nozzles likely yields emissions that include products formed under both oxidative and oxygen-deprived conditions. The presence of oxygen in the reaction gas led to lower levels of emitted styrene and certain degradation products (Table S2), primarily those that do not contain oxygen in their formula. This decrease in emission can be explained by 1) oxidation of polymer decomposition products to low molecular weight products not analyzed in this study (CO, CO2, and compounds with less than six carbons) and 2) increased formation of oxygen-containing acetophenone and benzaldehyde. Contrary to acetophenone and benzaldehyde (Figure 2, Path B), 2-phenyl-2-propanol yield (Figure 2, Path A) is not affected by addition of gas phase O2. This may indicate that polymer adsorbed oxygen plays a key role in Path A, while gas-phase O2 forms secondary products in Path B.
Role of Carbon Nanotubes.
Studies have indicated that incorporation of single-walled CNTs into ABS decreases activation energy of thermal degradation by up to 6 kcal/mol30. The mechanism of this effect is not clear. The presence of CNTs in the filament affected both the total VOC emission and VOC profile. Overall, addition of CNTs slightly decreased the emissions of VOCs (Figure 3), except for the sample treated at 300°C/3 minutes/N2, which showed the highest emission due to the drastically increased emission of UV-stabilizer 2,4-di-tert-butylphenol. Figure 5 shows emissions of five VOCs that best exemplify the differences between ABS and ABS-CNT filament degradation. Despite still being the most prevalent VOC, styrene emissions decreased in the presence of CNTs (Figure 5A) except for pyrolytic conditions at 300°C, where the difference between ABS and ABS-CNT was insignificant.
Figure 5.
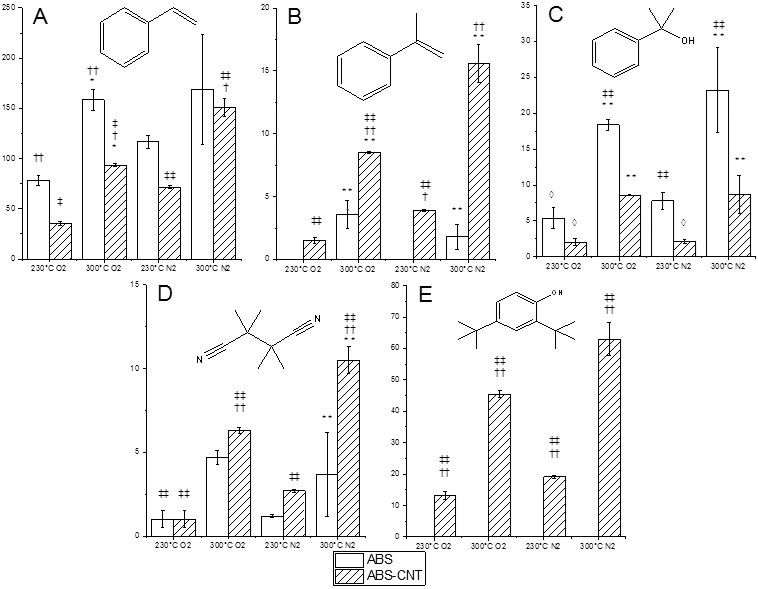
Influence of CNTs on emissions of a) styrene, b) α-methylstyrene, c) 2-phenyl-2-propanol, d) tetramethylsuccinonitrile, and e) 2,4-di-tert-butylphenol. All values are in µg/g. ‡ = statistical significance between 230 and 300°C, † = statistical significance between O2 and N2, * = statistical significance between ABS and ABS-CNT, and ◊ = below method detection limit. Single symbol represents p-value of < 0.05 and double symbol represents p-value of < 0.01. Statistical significance determined using ANOVA with a post-hoc Tukey Test. Error bars are +/− one standard deviation.
The sum of the products of Path A decomposition (Figure 2) did not change significantly for the ABS-CNT samples; however, product distribution within this group was altered. The formation of α-methylstyrene was increased (Figure 5B) and 2-phenyl-2-propanol was significantly suppressed (Figure 5C). This change in product ratio away from oxygenated products is explained by a change in available oxygen in the system, possibly due to strong adsorption of O2 on CNTs.
Figure 6 shows the VOC yields of Path A and B products only, with the exclusion of styrene and benzaldehyde. Styrene is not included in the Path B product sum to compensate for the presence of unreacted monomer and benzaldehyde was removed due to only being formed at the highest temperature. The similarities between Path A and B after the removal of styrene and benzaldehyde, particularly in the CNT-containing filament, leads to the conclusion that the majority of styrene emissions are from unreacted monomer and not polymer backbone cleavage. Figure 6 also indicates that CNTs do not have a significant effect on the preference for Path A or B. The decrease in styrene emission in the presence of CNTs is therefore likely due to adsorption and subsequent surface-catalyzed degradation of unreacted styrene monomer on CNTs. There may even be a synergistic effect between adsorption of both O2 and VOCs on the surface of CNTs as several compounds show significantly lower yields when both O2 and CNTs are present, including 2-phenyl-2-propanol, acetophenone, and isopropylbenzene.
Figure 6.

VOC emissions from Path A and Path B of the mechanism in Figure 2. Unreacted monomer styrene removed from all conditions and benzaldehyde removed from 300°C/3min/O2.
CNTs could also be acting as sinks for certain VOCs. Significantly lower yields for certain VOCs, such as 2-phenyl-2-propanol could be due to an increased affinity for adsorption of phenolic compounds on CNTs24. This would mean that formation of these VOCs is not necessarily affected by CNTs, but that they are not detected once adsorbed to CNTs.
There is evidence that three types of surface interactions may be responsible for the effect of CNTs on VOC emissions: 1) strong adsorption of O2 on CNTs lowering the amount of O2 available for reaction with polymer backbone cleavage intermediates, 2) adsorption of unreacted monomer styrene to CNTs yielding different products compared to Path A and B, and 3) increased affinity for certain aromatics leading to CNTs acting as sinks for particular VOCs. These three interactions can occur independently, compete, or even exhibit synergy in altering VOC emissions.
Some VOC emissions are not the result of polymer degradation. As seen in Figure 5D, TMSN was emitted in greater concentrations in the presence of CNTs. TMSN is a polymerization byproduct from the radical initiator 2,2’-azobis-isobutyronitrile. Interestingly, a new group of VOCs was observed for ABS-CNT filaments: 2,4-di-tert-butylphenol and 2,6-di-tert-butylquinone. Shown in Figure 5E, 2,4-di-tert-butylphenol was only emitted from ABS-CNT filament. 2,4-di-tert-butylphenol is a common polymer stabilizer that protects from UV damage. The structural and mechanical changes caused by the addition of CNTs to ABS could necessitate a different polymer formulation that incorporates different polymerization initiators and stabilizers. It is not clear whether this stabilizer is only added to ABS-CNT or if the presence of CNTs triggers the release.
Environmental Implications.
The Integrated Risk Information System (IRIS) is an EPA-created tool for categorizing chemicals and their associated health hazards. IRIS contains entries for five of the measured VOCs from this study and three entries contain a reference concentration for inhalation exposure (RfC). Table 2 shows the IRIS RfC values for styrene, ethylbenzene, and isopropylbenzene (in IRIS as cumene). The IRIS RfC for styrene is 1 mg/m3, which could be easily reached after printing a few hundred grams of filament depending on room size and ventilation. VOCs whose formation is increased by CNTs also pose known inhalation hazards, such as α-methylstyrene31 and benzaldehyde32.
Table 2.
IRIS RfC values for VOCs emitted during 3D printing. Calculated ‘printed mass to achieve RfC’ values based on highest emission of individual VOC and a 37.5 m3 unventilated room.
| compound | RfC (mg/m3) | printed mass to achieve RfC (g) |
|---|---|---|
| styrene | 1 | 222.0 |
| ethylbenzene | 1 | 2451.0 |
| cumene / isopropylbenzene | 0.4 | 2586.0 |
The increasing utility and decreasing price of 3D printing is leading to greater numbers of printers in households and workplaces and, therefore, increased exposure of users to hazardous emissions. Understanding the printing parameters that have the greatest influence on VOC emissions can lead to printer designs and that limit these emissions and recommended printing locations that limit exposure to users. This work has shown that filament additives such as CNTs can influence VOC emissions and their use in 3D printing should be reevaluated. CNTs increase formation of more hazardous VOC emissions and, if emitted in particulate, pose an added inhalation hazard as adsorption sites for VOCs.
The variety of filament additives currently available on the market includes wood fiber, transition metal particles, organic dyes, metal-containing dyes, nanomaterials, and phosphorescent materials. Many of these materials either contain VOCs or may catalyze VOC formation at printing temperatures. Future work will involve prioritizing the risk posed by these additives and investigating their influence on VOC emissions. There is also a need to address particulate emissions from 3D printers. While the STDS is not designed for particulate matter collection, we are exploring other experimental setups to capture and characterize particulate emissions with respect to their morphology, metal content, and adsorbed organic species. As the popularity of 3D printing grows, and applications spread from industry to the household, there is a critical need to investigate filament additives to assess their health risks.
Supplementary Material
Acknowledgments
This research was funded and conducted by the National Risk Management Research Laboratory of the U.S. Environmental Protection Agency (EPA), Cincinnati, OH. This project was supported, in part, by appointments in the Research Participation Program at the Office of Research and Development (ORD), EPA administered by the Oak Ridge Institute for Science and Education (92431601) through an interagency agreement between the DOE and EPA. This manuscript was subjected to EPA internal reviews and quality assurance approval. The research results presented in this paper do not necessarily reflect the views of the Agency or its policy. Mention of trade names or products does not constitute endorsement or recommendation for use.
Footnotes
Supporting Information
Additional methods, instrument diagram, calibration curves, and data table.
References
- 1.Stefaniak AB; LeBouf RF; Duling MG; Yi J; Abukabda AB; McBride CR; Nurkiewicz TR, Inhalation exposure to three-dimensional printer emissions stimulates acute hypertension and microvascular dysfunction. Toxicol Appl Pharm 2017, 335, 1–5. [DOI] [PMC free article] [PubMed] [Google Scholar]
- 2.Stephens B; Azimi P; El Orch Z; Ramos T, Ultrafine particle emissions from desktop 3D printers. Atmos Environ 2013, 79, 334–339. [Google Scholar]
- 3.Afshar-Mohajer N; Wu CY; Ladun T; Rajon DA; Huang Y, Characterization of particulate matters and total VOC emissions from a binder jetting 3D printer. Building and Environment 2015, 93, 293–301. [Google Scholar]
- 4.Zhou Y; Kong XR; Chen AL; Cao SJ, Investigation of Ultrafine Particle Emissions of Desktop 3D Printers in the Clean Room. Procedia Engineer 2015, 121, 506–512. [Google Scholar]
- 5.Azimi P; Zhao D; Pouzet C; Crain NE; Stephens B, Emissions of Ultrafine Particles and Volatile Organic Compounds from Commercially Available Desktop Three-Dimensional Printers with Multiple Filaments. Environmental Science & Technology 2016, 50 (3), 1260–1268. [DOI] [PubMed] [Google Scholar]
- 6.Steinle P, Characterization of emissions from a desktop 3D printer and indoor air measurements in office settings. J Occup Environ Hyg 2016, 13 (2), 121–132. [DOI] [PubMed] [Google Scholar]
- 7.Mendes L; Kangas A; Kukko K; Molgaard B; Saamanen A; Kanerva T; Ituarte IF; Huhtiniemi M; Stockmann-Juvala H; Partanen J; Hameri K; Eleftheriadis K; Viitanen AK, Characterization of Emissions from a Desktop 3D Printer. J Ind Ecol 2017, 21, S94–S106. [Google Scholar]
- 8.Rao CC; Gu F; Zhao P; Sharmin N; Gu HB; Fu JZ, Capturing PM2.5 Emissions from 3D Printing via Nanofiber-based Air Filter. Sci Rep-Uk 2017, 7. [DOI] [PMC free article] [PubMed] [Google Scholar]
- 9.Stabile L; Scungio M; Buonanno G; Arpino F; Ficco G, Airborne particle emission of a commercial 3D printer: the effect of filament material and printing temperature. Indoor Air 2017, 27 (2), 398–408. [DOI] [PubMed] [Google Scholar]
- 10.Vance ME; Pegues V; Van Montfrans S; Leng W; Marr LC, Aerosol Emissions from Fuse-Deposition Modeling 3D Printers in a Chamber and in Real Indoor Environments. Environmental Science & Technology 2017, 51 (17), 9516–9523. [DOI] [PubMed] [Google Scholar]
- 11.Kim Y; Yoon C; Ham S; Park J; Kim S; Kwon O; Tsai PJ, Emissions of Nanoparticles and Gaseous Material from 3D Printer Operation. Environmental Science & Technology 2015, 49 (20), 12044–12053. [DOI] [PubMed] [Google Scholar]
- 12.Deng YL; Cao SJ; Chen AL; Guo YS, The impact of manufacturing parameters on submicron particle emissions from a desktop 3D printer in the perspective of emission reduction. Building and Environment 2016, 104, 311–319. [Google Scholar]
- 13.Yi JH; LeBouf RF; Duling MG; Nurkiewicz T; Chen BT; Schwegler-Berry D; Virji MA; Stefaniak AB, Emission of particulate matter from a desktop three-dimensional (3D) printer. J Toxicol Env Heal A 2016, 79 (11), 453–465. [DOI] [PMC free article] [PubMed] [Google Scholar]
- 14.Kwon O; Yoon C; Ham S; Park J; Lee J; Yoo D; Kim Y, Characterization and Control of Nanoparticle Emission during 3D Printing. Environmental Science & Technology 2017, 51 (18), 10357–10368. [DOI] [PubMed] [Google Scholar]
- 15.Zhang Q; Wong JPS; Davis AY; Black MS; Weber RJ, Characterization of particle emissions from consumer fused deposition modeling 3D printers. Aerosol Sci Tech 2017, 51 (11), 1275–1286. [Google Scholar]
- 16.Stefaniak AB; LeBouf RF; Yi JH; Ham J; Nurkewicz T; Schwegler-Berry DE; Chen BT; Wells JR; Duling MG; Lawrence RB; Martin SB; Johnson AR; Virji MA, Characterization of chemical contaminants generated by a desktop fused deposition modeling 3-dimensional Printer. J Occup Environ Hyg 2017, 14 (7), 540–550. [DOI] [PMC free article] [PubMed] [Google Scholar]
- 17.Floyd EL; Wang J; Regens JL, Fume emissions from a low-cost 3-D printer with various filaments. J Occup Environ Hyg 2017, 14 (7), 523–533. [DOI] [PubMed] [Google Scholar]
- 18.Contos DA; Holdren MW; Smith DL; Brooke RC; Rhodes VL; Rainey ML, Sampling and Analysis of Volatile Organic-Compounds Evolved during Thermal-Processing of Acrylonitrile-Butadiene-Styrene Composite Resins. J Air Waste Manage 1995, 45 (9), 686–694. [Google Scholar]
- 19.Shapi MM; Hesso A, Gas-Chromatographic Mass-Spectrometric Analysis of Some Potential Toxicants Amongst Volatile Compounds Emitted during Large-Scale Thermal-Degradation of Poly(Acrylonitrile Butadiene Styrene) Plastic. J Chromatogr-Biomed 1991, 562 (1–2), 681–696. [PubMed] [Google Scholar]
- 20.Coleman JN; Khan U; Blau WJ; Gun’ko YK, Small but strong: A review of the mechanical properties of carbon nanotube-polymer composites. Carbon 2006, 44 (9), 1624–1652. [Google Scholar]
- 21.Breuer O; Sundararaj U, Big returns from small fibers: A review of polymer/carbon nanotube composites. Polym Composite 2004, 25 (6), 630–645. [Google Scholar]
- 22.Acquah SFA; Leonhardt BE; Nowotarski MS; Magi JM; Chambliss KA; Venzel TES; Delekar SD; Al-Hariri LA, Carbon Nanotubes and Graphene as Additives in 3D Printing. Carbon Nanotubes - Current Progress of Their Polymer Composites 2016, 227–251. [Google Scholar]
- 23.Ren XM; Chen CL; Nagatsu M; Wang XK, Carbon nanotubes as adsorbents in environmental pollution management: A review. Chem Eng J 2011, 170 (2–3), 395–410. [Google Scholar]
- 24.Lin DH; Xing BS, Adsorption of phenolic compounds by carbon nanotubes: Role of aromaticity and substitution of hydroxyl groups. Environmental Science & Technology 2008, 42 (19), 7254–7259. [DOI] [PubMed] [Google Scholar]
- 25.Zhang SJ; Shao T; Kose HS; Karanfil T, Adsorption of Aromatic Compounds by Carbonaceous Adsorbents: A Comparative Study on Granular Activated Carbon, Activated Carbon Fiber, and Carbon Nanotubes. Environmental Science & Technology 2010, 44 (16), 6377–6383. [DOI] [PubMed] [Google Scholar]
- 26.Rubey WA; Grant RA, Design Aspects of a Modular Instrumentation System for Thermal Diagnostic Studies. Rev Sci Instrum 1988, 59 (2), 265–269. [Google Scholar]
- 27.Kibet J; Khachatryan L; Dellinger B, Molecular Products and Radicals from Pyrolysis of Lignin. Environmental Science & Technology 2012, 46 (23), 12994–13001. [DOI] [PubMed] [Google Scholar]
- 28.Nganai S; Lomnicki S; Dellinger B, Ferric Oxide Mediated Formation of PCDD/Fs from 2-Monochlorophenol. Environmental Science & Technology 2009, 43 (2), 368–373. [DOI] [PMC free article] [PubMed] [Google Scholar]
- 29.Polli H; Pontes LAM; Araujo AS; Barros JMF; Fernandes VJ, Degradation behavior and kinetic study of ABS polymer. J Therm Anal Calorim 2009, 95 (1), 131–134. [Google Scholar]
- 30.Yang SY; Castilleja JR; Barrera EV; Lozano K, Thermal analysis of an acrylonitrile-butadiene-styrene/SWNT composite. Polym Degrad Stabil 2004, 83 (3), 383–388. [Google Scholar]
- 31.Morgan DL; Mahler JF; Kirkpatrick DT; Price HC; O’Connor RW; Wilson RE; Moorman MP, Characterization of inhaled alpha-methylstyrene vapor toxicity for B6C3F1 mice and F344 rats. Toxicol Sci 1999, 47 (2), 187–194. [DOI] [PubMed] [Google Scholar]
- 32.Laham S; Broxup B; Robinet M; Potvin M; Schrader K, Subacute Inhalation Toxicity of Benzaldehyde in the Sprague-Dawley Rat. Am Ind Hyg Assoc J 1991, 52 (12), 503–510. [DOI] [PubMed] [Google Scholar]
Associated Data
This section collects any data citations, data availability statements, or supplementary materials included in this article.