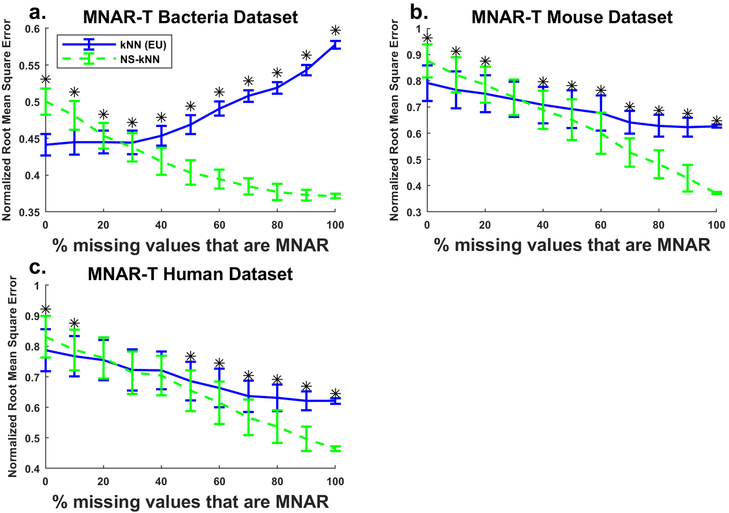
Fig. 4.
Imputation error for kNN and NS-kNN on three different datasets with 30% MNAR-T missingness and varying fractions of MNAR of the total missingness. Curves represent the mean NRMSE for 100 randomly generated missingness datasets from the a bacteria, b mouse, and c human datasets. Error bars represent one standard deviation. Asterisks indicate statistical significance (p < 0.05). The increasing behavior of kNN in a is discussed in the Supplementary Information

