Summary
In response to muscle damage, satellite cells proliferate and undertake both differentiation and self-renewal, generating new functional muscle tissue and repopulating this new muscle with stem cells for future injury responses. For many questions relating to the physiological regulation of satellite cells, quantitative readouts of self-renewal and differentiation can be very useful. There is a particular need for a quantitative assay for satellite cell self-renewal that does not rely solely upon sectioning, staining and counting cells in sections. In this chapter, we provide detailed methods for quantifying the self-renewal and differentiation potential of a given population of satellite cells using an assay involving transplantation into injured, regenerating muscle together with specific markers for donor cell identity and state of differentiation. In particular, using the Pax7-ZsGreen transgene as a marker of satellite cell state, self-renewal can be quantified by FACS on transplanted muscle to actually count the total number of resident satellite cells at time points following transplantation.
Keywords: satellite cells, Pax7, transplantation, myogenesis
1. Introduction
The ability to quantify self-renewal and differentiation allows one to make statistical arguments about the effect of external or intrinsic variables on satellite cell physiology. Although satellite cells are often studied by extraction from muscle followed by ex vivo culture, when satellite cells are removed from muscle, they activate, irreversibly exit the stem cell state, and commit to myogenesis. Even a short period of ex vivo culture significantly ablates the ability of these cells to engraft the satellite cell compartment (1). Therefore, such cultures should not be referred to as satellite cells and properties attributed to such cells should not be ascribed to satellite cells. Since true self-renewal only occurs in vivo, only an in vivo assay can quantify the native self-renewal potential of a given satellite cell population.
In order to track self-renewal, it is essential to have markers that allow the cell autonomous readout of differentiation state. The assay that we describe makes use of two such markers, one for the satellite cell and the other for the differentiated myofiber. Conveniently, within skeletal muscle, satellite cells uniquely express the transcription factor Pax7 (2) and this marker is often used to quantify satellite cells in sections (see Quiroga and Zammit, chapter X in this volume). We have exploited this unique expression pattern to develop a transgenic mouse in which quiescent satellite cells are labelled with green fluorescence. A BAC containing the Pax7 locus was modified to replace the first coding exon of Pax7 with ZsGreen, and introduced into the mouse genome by pronuclear injection. The resulting Pax7-ZsGreen mouse can be used for flow cytometric purification or flow cytometric quantification of satellite cells from any muscle (3). A key feature of ZsGreen is that it serves as both a donor marker (provided the recipient does not carry the reporter) as well as a marker of satellite cell state – the green fluorescence is rapidly lost when cells satellite cells differentiate (3).
The second marker is the protein dystrophin. Dystrophin is strongly expressed in differentiated myofibers, detected just beneath the sarcolemma (4, 5) where it ensures integrity of the cell membrane during cycles of contraction and release (6), by linking the contractile apparatus to the extra cellular matrix (7). The mdx mouse lacks dystrophin (8), thus when wild-type (WT) satellite cells are transplanted into the muscle of an mdx host, their contribution to skeletal muscle regeneration can be observed by immunostaining of sections with antibodies to dystrophin. Thus, as with Pax7 above, dystrophin serves as both a host marker and a marker for differentiated state.
Because experiments evaluating the function of specific genes in satellite cell physiology often require many genetic components, the mice whose satellite cell self-renewal and differentiation potential need to be quantified are typically outbred. Tissue from outbred mice transplanted into mdx mice, which are conventionally on a C56BL/10 background, would in most cases provoke a strong immune response and be rejected. To eliminate any immune system interference with the output of this assay, we have developed an immunodeficient version of the mdx mouse, NSG-mdx4Cv, which serves as an excellent and highly tolerant recipient of satellite cell grafts (9). This strain carries the SCID mutation, which leads to a complete absence of mature B and T cells (10), together with the IL2Rg mutation, which ablates NK cells (11), important mediators of non-self MHC recognition. In addition, it utilizes an allele of Dmd referred to as mdx4Cv (12) which has a very low rate of spontaneous reversion (13). Because the dystrophin gene has so many exons, there are many opportunities for alterations in splicing to produce a shortened protein with functional N- and C-termini but bypassing the mutation; these relatively infrequent reversion events also occur in Duchenne patients (14). Spontaneous reversion leads to dystrophin positivity in revertant fibers, therefore its presence sets a level of background noise. With the 4Cv mutation, this background is close to zero (13).
In overview, the experiment involves purifying Pax7-ZsGreen-labeled cells from one or more donor mice, transplanting these cells into both TA muscles of an irradiated, pre-injured NSG-mdx4Cv mouse, harvesting both TA muscles one month later, and processing one for FACS and the other for sectioning and dystrophin/laminin staining. The rate of self-renewal can be quantified as the number of ZsGreen cells in the muscle one month post-transplant per input ZsGreen cell. The rate of differentiation can be quantified as the number of dystrophin+ fibers one month post-transplant, per input ZsGreen cell. We typically find that an n of 6 is a good starting point for reliable output data in both arms.
2. Materials
2.1. Irradiation
X-ray irradiator
NSG-mdx4Cv mice (9).
Ketamine [45 mg/mL]/xylazine [5 mg/mL]
Lead shields
2.2. Cardiotoxin-injury
Ketamine [45 mg/mL]/xylazine [5 mg/mL]
10 μM Cardiotoxin from Naja mossambica mossambica solution: 5 mg lyophilized cardiotoxin (Sigma – C9759) dissolved in 73.25 ml PBS, aliquoted and frozen
Hamilton Syringe with 26-gauge needle
6–0 Nylon Suture
2.3. Harvest of Satellite Cells for Transplant
Mice carrying the Pax7-ZsGreen reporter gene (3), see Note 1.
Digestion Solution 1: 500 mL DMEM High Glucose plus 4500 mg/L Glucose without L-Glutamine and Sodium Pyruvate supplemented with 1% Penicillin/Streptomycin and 1 gram collagenase type II
Rinsing Solution: Ham’s/F-10 medium plus 1.00 mM L-Glutamine supplemented with 10% Horse Serum, 1% 1 M HEPES Buffer Solution, and 1% Penicillin/Streptomycin
Digestion Solution 2: 7 mL Rinsing Solution supplemented with 500 μL of Digestion Solution 1 and 1.25 mL of 0.4% Dispase in Rinsing Solution per sample
Sorvall LEGEND RT Centrifuge (Thermo Electron Corporation)
100 X 15 mm Petri dishes
Razor blades
Serological pipettes
50 ml conical tubes (sterile)
Pasteur pipettes
Small pipette bulbs
10 mL syringes
18-gauge needles
16-gauge needles
40 micron cell strainers
Collection Medium: Ham’s/F-10 medium plus 1.00 mM L-Glutamine supplemented with 20% Fetal Bovine Serum, 1% Penicillin/Streptomycin, 1% Glutamax, 10 ng/mL human basic Fibroblast Growth Factor, and 114.4 μM 2-Mercaptoethanol (2 μL in 250 mL).
2.4. Transplantation
Ketamine/xylazine mixture: ketamine[45 mg/mL]/xylazine [5 mg/mL]
Hamilton Syringe with 26-gauge needle
Phosphate-Buffered Saline without calcium and magnesium, 1X
6–0 Nylon Suture
2.5. TA Harvest for FACS analysis
Digestion Solution 1: (same as 2.3 above)
Rinsing Solution: (same as 2.3 above)
Digestion Solution 2: 3.5 mL Rinsing Solution supplemented with 250 μL of Digestion Solution 1 and 625 μL of 0.4% Dispase in Rinsing Solution per sample
60 X 15 mm petri dishes
15 mL conical tubes (sterile)
3 mL syringes
2.6. FACS Staining
FACS Staining Medium: Phosphate-Buffered Saline without calcium and magnesium supplemented with 2% Fetal Bovine Serum
FACS Staining Medium with Propidium Iodide: as above, supplemented with 1 μg/mL Propidium Iodide
-
Antibody Mixture: (1 μL CD31-PE-Cy7, 1 μL CD45-PE-Cy7, 1 μL VCAM-Biotin,1 μL Streptavidin-PE, 2 μL α7-integrin-647).
Specific antibodies for FACS Staining:
CD31-PECy7 Clone 390 (BD Biosciences - 561410)
CD45-PE-Cy7 Clone 30-F11 (BD Biosciences - 552848)
VCAM-Biotin Clone 429(MVCAM.A) (BD Biosciences - 553331)
Streptavidin-PE (BD Biosciences - 554061)
α7-integrin Clone R2F2 (AbLab - 67–0010-05)
2.7. Sectioning and Immunohistochemistry
O.C.T. Compound
Peel-A-Way embedding molds
2-methylbutane
Liquid Nitrogen
Cryostat
Microscope slides
Acetone
Liquid-repelling PAP Pen
Bovine Serum Albumin
Phosphate-Buffered Saline, 1X
Rabbit polyclonal antibody to Dystrophin (AbCam - ab15277)
Mouse monoclonal antibody to Laminin Clone LAM-89 (Sigma)
Alexa Fluor 555 goat anti-rabbit IgG antibody (Invitrogen - A21429)
Alexa Fluor 488 goat anti-mouse IgG antibody (Invitrogen - A11029)
DAPI
IMMU-MOUNT
Glass coverslips
Upright fluorescence microscope
3. Methods
3.1. Irradiation Procedure
In order to limit the contribution of the endogenous satellite cells to muscle repair, 48 hours prior to transplantation, both hind limbs of the NSG-mdx4Cv recipient mice are irradiated.
Sedate mice with ketamine/xylazine mixture.
Placed mice in a supine position on irradiator platform.
Protect the body of each mouse is with lead shielding, leaving only the hind limbs exposed (Figure 1).
Apply tape to immobilize the feet of each mouse. This maintains optimum exposure of the tibialis anterior (TA) during irradiation, as turning can result in shielding of the TA by the bone.
Tape is also used to prevent the exposure of the tails to the irradiation, by holding the tail in place under the lead shield. (Figure 1).
Figure 1.
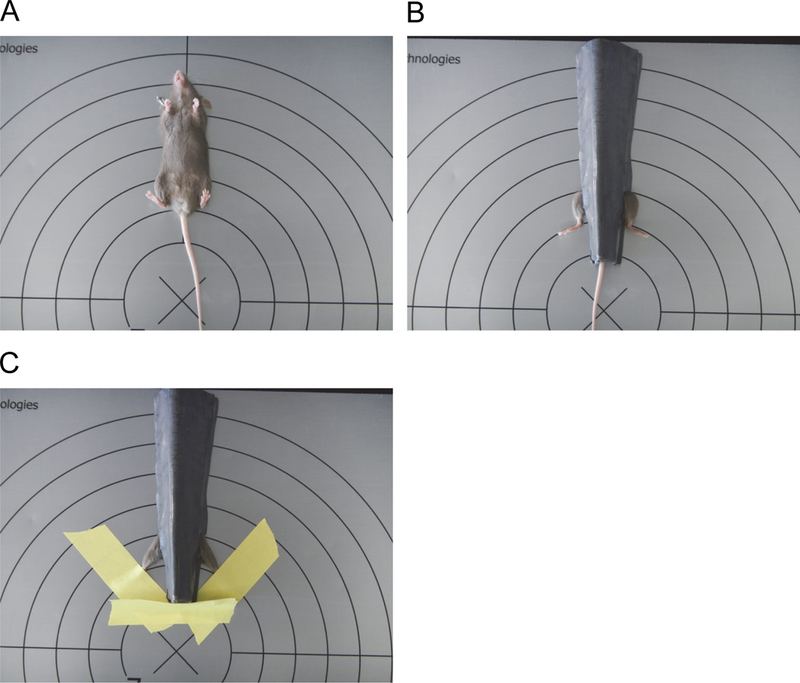
Positioning of mice for irradiation.
A. Mice are placed on the irradiation platform in a supine position.
B. Except for their limbs, the mice are protected from the irradiation with lead shields.
C. Tape is applied to hold the hind limbs in place and to secure the tail under the lead shield.
3.2. Cardiotoxin-injury Procedure
While the NSG-mdx4Cv mice lack full length dystrophin protein, they have a relatively mild muscle phenotype compared to humans with a similar mutation in the dystrophin gene. To further stimulate muscle regeneration, both TAs are injected with cardiotoxin. This induces hypercontraction, ultimately destroying muscle fibers throughout a large part of the TA muscle.
Sedate mice with ketamine/xylazine mixture.
Shave skin and swab with 70% ethanol and betadine solution.
A 7–10 mm skin incision is made to expose the TA.
- The TA is injected intramuscularly with a 26-gauge needle on a Hamilton syringe containing 15 μL of 10 μM cardiotoxin solution.
- The bevel of the needle should be up when entering the TA, and the needle should be at an angle of approximately 30 degrees relative to the axis of the muscle. (Figure 2A)
- After piercing the muscle, change the angle of the needle to align with the axis, so the needle can be inserted through the core of the muscle. Rotate the needle slightly as it is pushed further into the TA prior to injecting the volume. (Figure 2B)
- After volume is injected, hold the needle in place for approximately 30 seconds prior to withdrawing from the muscle. If the needle has become attached to the muscle, a gentle twist of the needle may be needed to withdraw the needle.
Close the skin incision with a 6–0 nylon suture.
Figure 2.
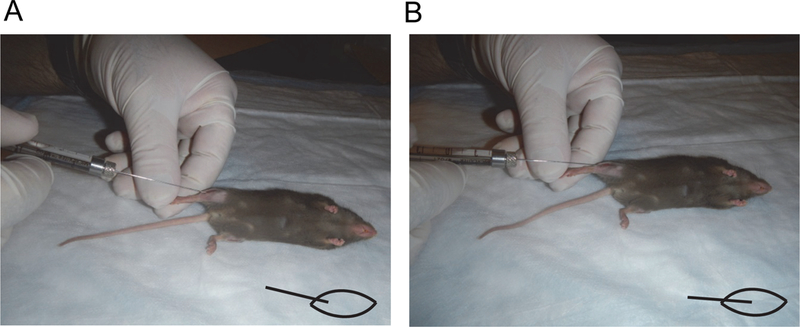
Positioning of Hamilton syringe for the injection of cardiotoxin or cells.
A. To first pierce the muscle, the needle is brought in at an angle. Diagram at lower right indicates orientation of needle and muscle.
B. Prior to transplanting cells, the needle is oriented with the axis of the muscle, and inserted. Diagram at lower right indicates the desired orientation.
3.3. Harvest of Satellite Cells for Transplant
Carefully dissect both hind limbs, triceps and psoas muscles.
Chop the muscle parallel to the muscle fiber direction into approximately 2 mm thick pieces (use the razor blade as a straight edge and pull along the straight edge with a curved forceps). (Figure 3)
Place the sample into a 50 mL tube containing 15 mL of Digestion Solution 1.
Keep the samples on ice until all samples have been harvested.
Incubate shaking for 75 min. at 37 °C.
Invert the tubes five times, then let the sample gravity settle for approximately 5 min.
Aspirate the supernatant to the 10 ml mark of the 50 mL conical tube. Add 6 mL Rinsing Solution, invert the tubes five times; then let the samples settle for 5 min.
Repeat step 7.
Aspirate the supernatant, again leaving behind 10 ml.
Add 2 ml Rinsing Solution, and pour muscle solution into an inclined 100 × 15 cm Petri dish.
Scrape the muscle solution against the bottom of the inclined Petri dish and squeeze into and out of a sheared Pasteur pipette (with small bulb). This will mechanically disrupt the muscle fibers.
Add 2 mL Rinsing Solution to wash the Petri dish, transferring the solution back to the 50 mL conical tube. Repeat this rinse to collect as much residue as possible.
Centrifuge the samples at 300 x g for 5 min. on a benchtop centrifuge.
Aspirate the supernatant, leaving behind 5 mL.
Add 10 mL Rinsing Solution, and resuspend the pellet.
Centrifuge the samples at 300 x g for 5 min..
Aspirate the supernatant to the 5 mL mark of the tube.
Add 8.5 mL Digestion Solution 2, and resuspend the pellet.
Vortex for 30 sec.
Incubate shaking for 30 min. at 37 °C.
Vortex for 30 sec.
Place a 40 micron cell strainer on a new 50 mL conical tube and wet with 2 mL Rinsing Solution.
Draw the sample into and out of a 10 mL syringe with a 16-gauge needle 4 times.
Draw into and out of a 10 mL syringe with an 18-gauge needle 4 times.
Apply the sample through the 40 micron cell strainer, collecting into the new 50 mL conical tube.
Collect any residue in the original 50 mL tube by adding 10 mL Rinsing Solution and pouring through the cell strainer into the new 50 mL tube.
Centrifuge the samples at 300 x g for 5 min.
Place a 40 micron cell strainer onto a new 50 mL conical tube and wet with 2 mL Rinsing Solution.
Again, draw the sample into and out of a 10 mL syringe with an 18-gauge needle 4 times
Apply the sample through the 40 micron cell strainer, collecting in the new 50 mL conical tube.
Collect any residue by adding 10 mL Rinsing Solution and adding to the the new 50 mL tube, through the strainer.
Centrifuge the samples at 300 x g for 5 min.
Carefully aspirate until there is only approximately 100 μL little volume left above the cell pellet.
Add 2 mL of staining medium to the sample, resuspend the cells, and transfer to a new 15 mL conical tube for FACS sorting.
Sort the ZsGreen+ cells (Figure 4), and collect into Collection Medium. Make sure to keep a count of cells as they are sorted.
Figure 3.
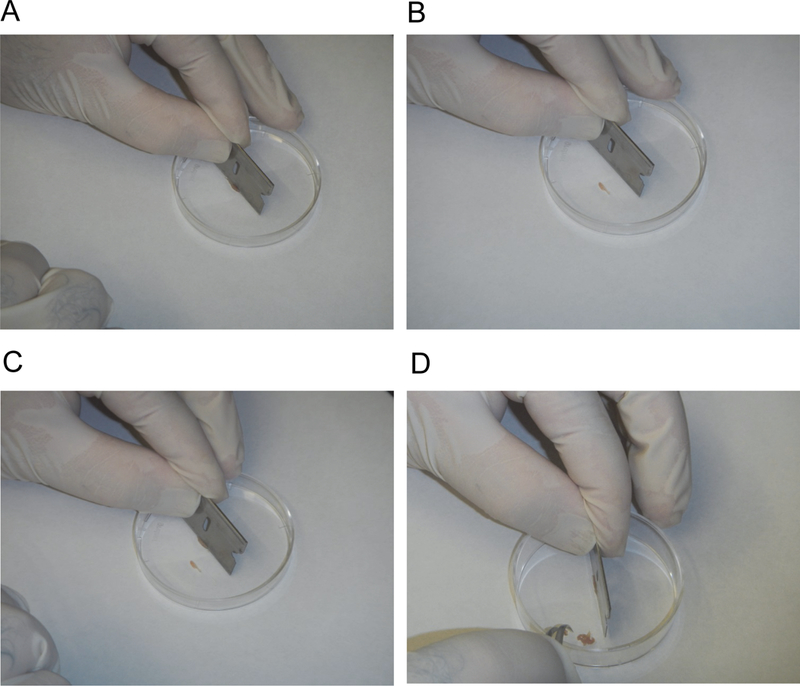
Preparing muscle for digestion.
A. The razor blade is aligned parallel to the long axis of the muscle fibers.
B. Forceps are sliced along the razor blade to separate the muscle into approximately 2 mm wide pieces.
C. Steps A and B are repeated.
D. This process is continued for the entire muscle.
Figure 4.
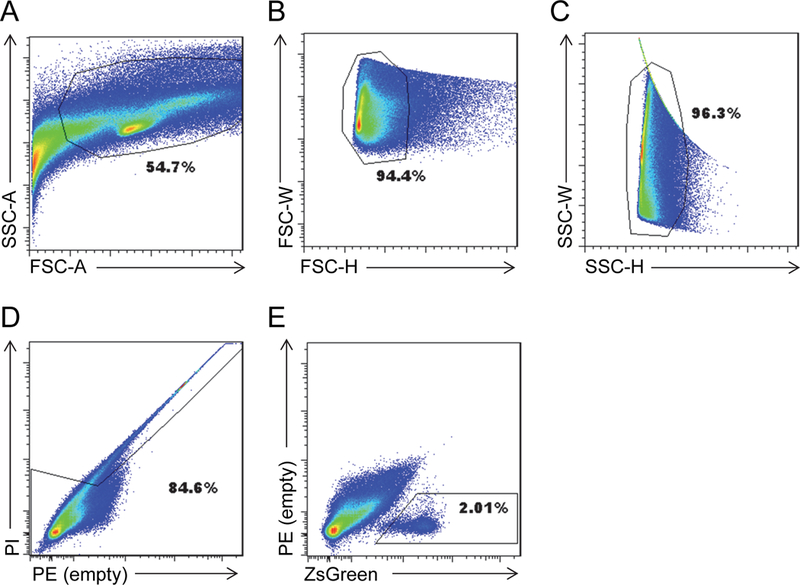
Gating for FACS sorting of satellite cells bulk hind limb.
A. FSC-A X SSC-A
B. FSC-H X FSC-W
C. SSC-H X SSC-W
D. PE X PI
E. ZsGreen X PE
3.4. Transplantation Procedure
Resuspend donor Pax7-ZsGreen+ cells from Pax7-ZsGreen mice in sterile saline at the desired cell number, typically a density allowing injections of 10 μL volume to contain 300 Pax7-ZsGreen cells (See Note 4). Cells are transplanted into both the right and left TAs of at least 6 NSG-mdx4Cv mice per condition.
Sedate mice with ketamine/xylazine mixture.
Reopen the incision made the previous day by cutting the nylon suture to expose the TA.
- Inject 10 μL of the appropriate number of cells suspended in sterile PBS intramuscularly in to each TA using a 26-gauge needle on a Hamilton syringe.
- The bevel of the needle should be up when entering the TA, and the needle should be at an angle of approximately 30 degrees relative to the axis of the muscle. (Figure 2A)
- After piercing the muscle, change the angle of the needle to align with the axis, so the needle can be inserted through the core of the muscle. Rotate the needle slightly as it is pushed further into the TA prior to injecting the volume. (Figure 2B)
- After volume is injected, hold the needle in place for approximately 30 seconds prior to withdrawing from the muscle. If the needle has become attached to the muscle, a gentle twist of the needle may be needed to withdraw the needle.
Close the skin incision with a 6–0 nylon suture.
3.5. Harvesting mononuclear cells from individual TA muscles.
Transplanted TA muscles are harvested four weeks post-transplant. Utilizing the Pax7-ZsGreen mouse as the donor for the transplanted satellite cells allows for quantitation of contribution to the satellite cell pool. Undifferentiated donor-derived satellite cells are identifiable by their green fluorescence. The procedure for harvesting cells from the TA muscle is similar to that for harvesting donor cells from total hind limb, but because the amount of tissue is so small, the volumes at each step are reduced, and disruption through syringes is done only once and the number of wash steps is reduced in order to limit cell loss. In addition, it is important not to lose any satellite cells that might be released during the first digestion (which releases the fibers). Therefore, rather than letting fibers gravity settle, in the individual TA prep, all cells are centrifuged into the pellet after the first digestion.
Carefully dissect that TA muscles to be used for FACS analysis.
Chop the TA muscle parallel to the muscle fibers into approximately 2 mm thick pieces (use the razor blade as a straight edge and pull along the straight edge with a curved forceps).
Place the sample into a 15 mL tube containing 3 mL of Digestion Solution 1.
Place the samples on ice until all samples have been harvested.
Incubate shaking for 75 min. at 37 °C.
Invert the tubes five or six times, then centrifuge for 5 min at 300 x g. Centrifugation at this step is different from the bulk prep, above.
Aspirate the supernatant to the 1 mL mark of the 15 ml conical tube. Add 3 mL Rinsing Solution, pipette to resuspend pellet with a P1000 pipette; then centrifuge for 5 min at 300 x g. Centrifugation at this step is different from the bulk prep, above.
Repeat step 7.
Aspirate the supernatant, again leaving behind 1 mL.
Add 3 mL Rinsing Solution, pull the pellet up and down 8 times through a sheared Pasteur pipette (approximately 1.5 cm from the narrow end of the pipette)
Centrifuge the samples at 300 x g for 5 min.
Aspirate the supernatant, leaving behind 1 mL.
Add 3 mL Rinsing Solution, resuspend using a 1 mL pipette.
Centrifuge the samples at 300 x g for 5 min.
Aspirate the supernatant to the 0.5 mL mark of the tube
Add 3 mL Digestion Solution 2, resuspend using a 1 mL pipette
Vortex for 30 sec.
Incubate shaking for 30 min. at 37 °C
Vortex for 30 sec.
Draw into and out of a 3 mL syringe with a 16-gauge needle 4 times
Draw into and out of a 3 mL syringe with an 18-gauge needle 4 times
Using a 1 mL pipette, apply the sample through a 40 micron cell strainer, collecting in a new 15 mL conical tube.
Discard the cell strainer, then add 3 mL Rinsing Solution to each sample.
Centrifuge the samples at 300 x g for 5 min.
Aspirate until only approximately 50 μL remains in the conical tube
Tap the tubes to resuspend the cells.
Add 250 μL of staining medium to each sample.
3.6. FACS Staining
One month after transplantation, the left and right TA are harvested from each mouse. One is used for immunostaining do quantify dystrophin+ fibers (described in 3.7, below), while the other is processed for FACS. In addition to determining the number of Pax7-ZsGreen+ satellite cells that have self-renewed based upon their green fluorescence, staining the cell samples for surface markers prior to analysis on the FACS allows for the enumeration of the total number of satellite cells in the TA. The cell samples are stained for CD31 and CD45 (Lineage-negative markers) as well as the satellite cell markers VCAM1 and α7-integrin (15–19).
Prepare Antibody Mixture. Section 2.6.3 provides the recipe per TA. Multiply these volumes by the number of TAs to be analyzed and add 4 uL of PBS to ensure that the last sample is not treated with a smaller volume than the others.
6 μL of the antibody mixture is added to each TA sample (this is enough to stain approximately 2 million cells).
Incubate on ice for 20 min (see Note 5).
Add 5 ml Staining Medium to each sample.
Centrifuge at 300 x g for 5 min.
Aspirate the Staining Medium until only approximately 50 μL remains in the conical tube.
Tap the tubes to resuspend the cells.
Add 250 μL of Staining Medium with Propidium Iodide to resuspend the cells for analysis on the FACS machine.
3.7. FACS Gating Strategy
Cells can be analyzed/sorted on a variety of instruments, using the same strategies. The examples provided below pertain to our instrument of choice, a BD FACS Aria II, equipped with red (641 nm), blue (488 nm) and yellow-green (561 nm) lasers. The cells are analyzed sequentially through a series of gates. Below are the gates utilized for the analysis of satellite cell self-renewal (Figure 5).
Figure 5.
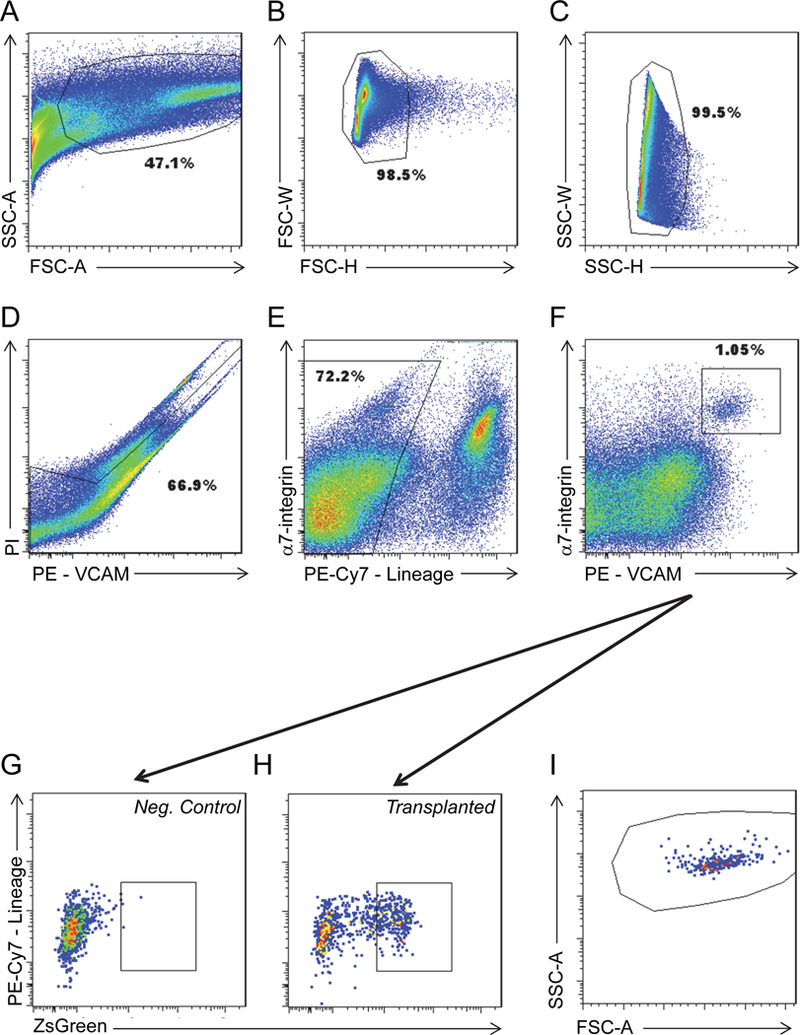
Gating for FACS analysis of transplanted TAs.
A. FSC-A X SSC-A
B. FSC-H X FSC-W
C. SSC-H X SSC-W
D. PE X PI (VCAM)
E. PE-Cy7 (Lineage) X α7-integrin
F. PE (VCAM) X α7-integrin
G. ZsGreen X PE-Cy7 (Lineage) for a control sample that was not transplanted with any cells.
H. ZsGreen X PE-Cy7 (Lineage) for a sample transplanted with 300 transplanted cells.
I. Back gating of ZsGreen+ cells in H back to the forward/side scatter (FSC-A x SSC-A) plot. This should be done to verify that the FSCxSSC gate is collecting all of the ZsGreen+ cells.
The Forward Scatter Threshold eliminates the signal from debris and setting this threshold appropriately is important to ensure speed of sort and sort efficiency (see Note 6).
Side Scatter Area X Forward Scatter Area is a plot of event complexity versus size of events. This plot allows for exclusion of debris and inclusion of mononuclear cells (Figure 5A).
Side Scatter Height X Side Scatter Width plots exclude doublets (Figure 5B).
Forward Scatter Height X Forward Scatter Width plots exclude doublets (Figure 5C).
Live cells are determined by the ability of the cells to exclude propidium iodide (Figure 5D). We plot PI against PE because of the strong spectral overlap of these two channels, using a triangular gate to include all PI– cells, including those with a strong PE signal that bleeds into the PI channel, and to exclude true PI+ cells.
Satellite cells do not express the lineage surface markers CD31 and CD45 (PE-Cy7 or lineage negative cells), therefore we gated on the negative fraction (Figure 5E).
Lineage negative cells are examined for the expression of VCAM and α7-integrin and a gate is placed on the well separated double-positive population (Figure 5F).
Finally, the Pax7-ZsGreen status of the VCAM / α7-integrin double positive cells is determined using the green channel vs. PE-Cy7 (Figure 5G & H).
3.8. Cryosectioning and Dystrophin/Laminin Staining
Quantification of the ability of the transplanted cells to differentiate and contribute to myofibers can be determined by staining TA cross-sections with antibodies to dystrophin and laminin (Figure 6).
Figure 6.
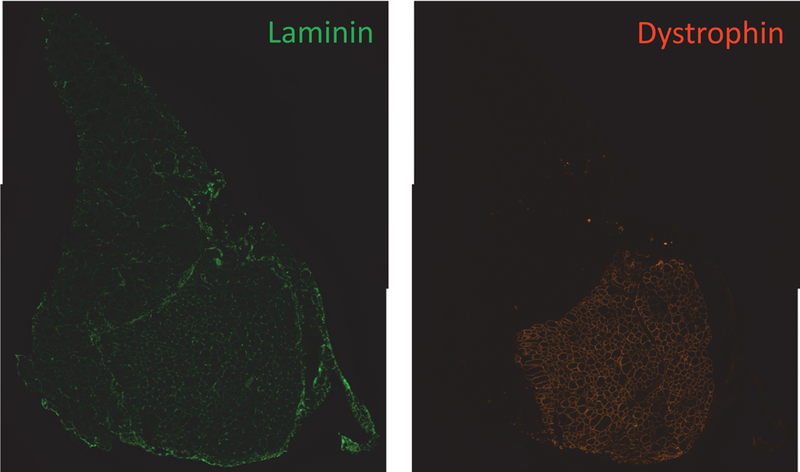
Merged image for dystrophin and laminin staining of transplanted TA. Left: laminin staining; right: dystrophin staining.
Place each TA into a cryoblock containing O.C.T. Compound.
Cool 2-methylbutane with liquid nitrogen.
After the 2-methylbutane has become solid, place the cryoblocks on the surface of liquid nitrogen-cooled 2-methylbutane for approximately 2 min.
Store cryoblocks containing samples in −80 freezer until ready to section.
10 micron sections are collected onto microscope slides; approximately 150 microns between sections, 10 sections per slide. Each slide therefore includes 10 sections at different places through a single TA muscle.
Slides are fixed with cold acetone for 5 min.
Allow the slides to air dry for 10 min and circle the samples with PAP Pen.
Rehydrate the samples with 1X PBS for 10 min.
Block with 3% BSA in 1X PBS for 1 hour at room temperature.
Incubate with a 1:250 dilution of rabbit polyclonal antibody to dystrophin and 1:500 dilution of mouse monoclonal laminin in 3% BSA in 1X PBS for 1 hour at room temperature.
Wash slides 3X for 5 min with 1X PBS.
Incubate with a 1:750 dilution of Alexa Fluor 555 goat anti-rabbit IgG and 1:750 dilution of Alexa Fluor 488 goat anti-rabbit IgG in 3% BSA in 1X PBS for 45 min at room temperature.
Wash slides 3X for 5 min with 1X PBS.
Incubate with a 1:1000 dilution of DAPI in 1X PBS for 10 min at room temperature.
24X60–1 glass coverslips are mounted using Immu-Mount.
Slides are photographed at 5X magnification with a Zeiss Axio Imager M1 Upright microscope with an AxioCam HRc camera.
Multiple images are needed to visualize the entire TA. Images can be merged using Adobe Photoshop.
Under File>Automate>Photomerge>Select Interactive Layout, browse to select the images to be merged (see Note 7), then save your merged file image.
Counting either dystrophin and/or laminin fibers can be done using Adobe Photoshop: Select Analysis>Count Tool
As you click on each fiber, Photoshop marks the site with a number (see Note 8).
4. Notes
The Pax7-ZsGreen transgene should never be allowed to become homozygous. We maintain this stock by back crossing to C57BL/6 and PCR genotyping. Carrier mice should never be bred with each other, as we have found that in the homozygous state, the transgene can undergo generational silencing. This does not occur if the transgene is kept heterozygous.
We routinely perform irradiation on a RS 2000 Biological Research Irradiator (Rad Source Technologies, Inc.) for 6 min. 45 sec. with the shelf at level 3.
NSG-mdx4Cv mice carry the SCID mutation, which makes them about 3x more sensitive to irradiation than WT mice. If performing transplantations into SCID+ mice, the dose would need to be increased accordingly.
When using the Pax7-ZsGreen mouse on a clean C57BL/6 background, 300 cells should result in approximately 300 donor fibers and 300 detectable donor-derived satellite cells after one month. Beyond about 500 cells, the correlation between cells in to cells/fibers out deviates from linearity. However, if the Pax7-ZsGreen cells are on a mixed background, the linear range will need to be determined empirically.
20 minutes is a minimum time. Incubation with antibodies on ice may be extended to 40 minutes.
On the BD FACS Aria II, we set the Forward Scatter Threshold to 5,000.
Depending on memory and image size, Photoshop may only let you merge two images at a time. If this is the case, it will be necessary to perform the merge iteratively.
Make sure to record the number of counted fibers at the end of each image analysis. The program does not save the count.
Acknowledgments
This work was supported by grants from the NIH (R01 AR055685) and Muscular Dystrophy Association (MDA351022).
References
- 1.Montarras D, et al. (2005) Direct isolation of satellite cells for skeletal muscle regeneration. Science 309(5743):2064–2067. [DOI] [PubMed] [Google Scholar]
- 2.Seale P, et al. (2000) Pax7 is required for the specification of myogenic satellite cells. Cell 102(6):777–786. [DOI] [PubMed] [Google Scholar]
- 3.Bosnakovski D, et al. (2008) Prospective isolation of skeletal muscle stem cells with a Pax7 reporter. Stem Cells 26(12):3194–3204. [DOI] [PMC free article] [PubMed] [Google Scholar]
- 4.Hoffman EP, Brown RH Jr., & Kunkel LM(1987) Dystrophin: the protein product of the Duchenne muscular dystrophy locus. Cell 51(6):919–928. [DOI] [PubMed] [Google Scholar]
- 5.Watkins SC, Hoffman EP, Slayter HS, & Kunkel LM (1988) Immunoelectron microscopic localization of dystrophin in myofibres. Nature 333(6176):863–866. [DOI] [PubMed] [Google Scholar]
- 6.Petrof BJ, Shrager JB, Stedman HH, Kelly AM, & Sweeney HL (1993) Dystrophin protects the sarcolemma from stresses developed during muscle contraction. Proceedings of the National Academy of Sciences of the United States of America 90(8):3710–3714. [DOI] [PMC free article] [PubMed] [Google Scholar]
- 7.Ervasti JM & Campbell KP (1991) Membrane organization of the dystrophin-glycoprotein complex. Cell 66(6):1121–1131. [DOI] [PubMed] [Google Scholar]
- 8.Sicinski P, et al. (1989) The molecular basis of muscular dystrophy in the mdx mouse: a point mutation. Science 244(4912):1578–1580. [DOI] [PubMed] [Google Scholar]
- 9.Arpke RW, et al. (2013) A New Immuno- Dystrophin-Deficient Model, the NSG-Mdx Mouse, Provides Evidence for Functional Improvement Following Allogeneic Satellite Cell Transplantation. Stem Cells. [DOI] [PMC free article] [PubMed] [Google Scholar]
- 10.Bosma GC, Custer RP, & Bosma MJ (1983) A severe combined immunodeficiency mutation in the mouse. Nature 301(5900):527–530. [DOI] [PubMed] [Google Scholar]
- 11.Cao X, et al. (1995) Defective lymphoid development in mice lacking expression of the common cytokine receptor gamma chain. Immunity 2(3):223–238. [DOI] [PubMed] [Google Scholar]
- 12.Chapman VM, Miller DR, Armstrong D, & Caskey CT (1989) Recovery of induced mutations for X chromosome-linked muscular dystrophy in mice. Proceedings of the National Academy of Sciences of the United States of America 86(4):1292–1296. [DOI] [PMC free article] [PubMed] [Google Scholar]
- 13.Danko I, Chapman V, & Wolff JA (1992) The frequency of revertants in mdx mouse genetic models for Duchenne muscular dystrophy. Pediatr Res 32(1):128–131. [DOI] [PubMed] [Google Scholar]
- 14.Hoffman EP, Morgan JE, Watkins SC, & Partridge TA (1990) Somatic reversion/suppression of the mouse mdx phenotype in vivo. J Neurol Sci 99(1):9–25. [DOI] [PubMed] [Google Scholar]
- 15.Chan SS, et al. (2013) Mesp1 patterns mesoderm into cardiac, hematopoietic, or skeletal myogenic progenitors in a context-dependent manner. Cell Stem Cell 12(5):587–601. [DOI] [PMC free article] [PubMed] [Google Scholar]
- 16.Blanco-Bose WE, Yao CC, Kramer RH, & Blau HM (2001) Purification of mouse primary myoblasts based on alpha 7 integrin expression. Exp Cell Res 265(2):212–220. [DOI] [PubMed] [Google Scholar]
- 17.Fukada S, et al. (2007) Molecular signature of quiescent satellite cells in adult skeletal muscle. Stem Cells 25(10):2448–2459. [DOI] [PubMed] [Google Scholar]
- 18.Jesse TL, LaChance R, Iademarco MF, & Dean DC (1998) Interferon regulatory factor-2 is a transcriptional activator in muscle where It regulates expression of vascular cell adhesion molecule-1. J Cell Biol 140(5):1265–1276. [DOI] [PMC free article] [PubMed] [Google Scholar]
- 19.Seale P, Ishibashi J, Holterman C, & Rudnicki MA (2004) Muscle satellite cell-specific genes identified by genetic profiling of MyoD-deficient myogenic cell. Dev Biol 275(2):287–300. [DOI] [PubMed] [Google Scholar]


