Abstract
Fast-scan cyclic voltammetry (FSCV) is an effective method for investigating electro-active neurochemical species. In recent years, FSCV has been used to measure electro-active neurotransmitters in a variety of neuroscience studies. We previously reported on the use of paired-pulse voltammetry (PPV) that enables FSCV to differentiate various analytes and minimize confounding factors by taking advantage of the adsorption characteristics of the analyte on carbon fiber microelectrodes. In spite of a number of studies regarding adsorption/desorption characteristics of neurotransmitters, the difference in adsorption/desorption properties among neurotransmitters has yet to be fully explored. To calculate adsorption/desorption constants for neurotransmitters, we propose the use of multi-waveform FSCV (M-FSCV), which consists of decade triangular waveforms in a single scan. Within the multiple waveforms, the voltammetric response of dopamine decayed exponentially because of the decreased adsorption time period. The decay pattern was mathematically described using adsorption/desorption characteristics and two additional initial points: an exponential decay constant (K) and an initial quantity (A), which were extracted from the decay equation. Using this method, we were able to quantify the decay constant (K-map) and an initial quantity (A-map) color plot in addition to a conventional pseudo color plot. M-FSCV was evaluated with two biogenic amine groups (catecholamines and indolamines) to characterize their inherent adsorption/desorption constants. As a result, the A-map showed a high correlation with concentration and the K-map for each group to be significantly differentiated. These results demonstrate that M-FSCV has the potential to be a useful technique for acquiring additional adsorption/desorption information regarding neurotransmitters.
Keywords: fast-scan cyclic voltammetry (FSCV), multi-waveform FSCV (M-FSCV), adsorption/desorption constant
Graphical abstracts
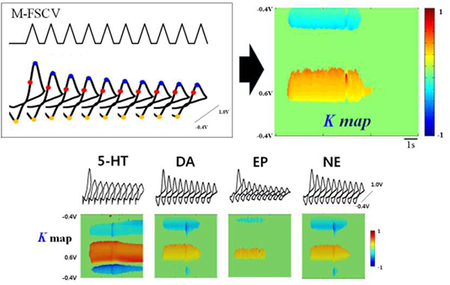
A novel multi-waveform FSCV (M-FSCV) developed for characterizing adsorption/desorption kinetics of neurotransmitters
Introduction
Fast-scan cyclic voltammetry (FSCV) is a powerful electroanalytical tool that can indirectly measure small changes in neurotransmitter extracellular levels in brain tissue at carbon fiber microelectrodes (CFMs) with a sub-second temporal resolution1–5. Although a number of studies have been carried out with FSCV demonstrating a higher sensitivity, selectivity, and reliability6–11, FSCV continues to have limitations in terms of differentiating among various analytes. We previously reported on a paired-pulse voltammetry (PPV) technique that uses two identical triangle-shaped waveforms that are separated by a short interval at the holding potential in a single scan12. PPV can discriminate between analytes and mitigates confounding factors on the basis of their difference in adsorption properties. The adsorption of species from the solution on the surface of a CFM is one of the significant factors affecting the voltammetric response in FSCV12–17 and a higher adsorption strength leads to increased sensitivity in the case of a biogenic catecholamine such as dopamine (DA)14 The focus of most research related to the adsorption characteristics of biogenic amines onto CFM has been on increasing sensitivity18–20, and yet, the theoretically derived adsorption/desorption properties have not been fully examined for biogenic amines or their major metabolites. Their adsorptive characteristics were originally described by the adsorption equilibrium coefficient (b), the diffusion coefficient (D), the surface concentration (Γ), and the time required to reach equilibrium surface concentration Γeq (t10–90%)14,21,22. In this study, we propose a multi-waveform FSCV (M-FSCV), which consists of 10 triangular waveforms (−0.4V ➔ 1.0V ➔ −0.4V, at 1000V/s) with a 1ms gap, to derive adsorption/desorption related constants from 10 consecutive subtracted voltammograms. The response for DA in these consecutive cyclic voltammograms showed a decreasing voltammogram peak current pattern, because the adsorption time was fixed to 1ms in the multiple waveforms. Even though the same concentration of neurotransmitter was present, the higher scan repetition rate caused the adsorbed chemical to be attenuated resulting in successive lower peak oxidation currents.14. This report prompted us to mathematically demonstrate the decreasing pattern by examining the adsorption/desorption kinetics of DA and dopamine-o-quinone (DOQ). By establishing an adsorption/desorption constant, we were able to depict a new type of pseudo color map: the kinetic map (K-map), which shows specific kinetic characteristics of particular analytes. In addition, a concentration map (A-map) was developed that shows the concentration for the specific analytes. M-FSCV was applied to other biogenic amines (norepinephrine, NE; epinephrine, EP; 5-hydroxytryptamine, 5-HT). The findings show that these compounds were distinguishable by catecholamines (DA, NE, and EP) and the indolamine (5-HT) using the K value for each of these compounds. This study characterizes the adsorption/desorption kinetics of these neurochemicals and their major metabolites using M-FSCV and demonstrate that M-FSCV has the potential to serve as a complementary technique to FSCV to evaluate adsorption/desorption characteristics of important biologically active neurochemicals in the brain, in addition to conventional redox responses.
Experimental
Multiple-waveform cyclic voltammetry
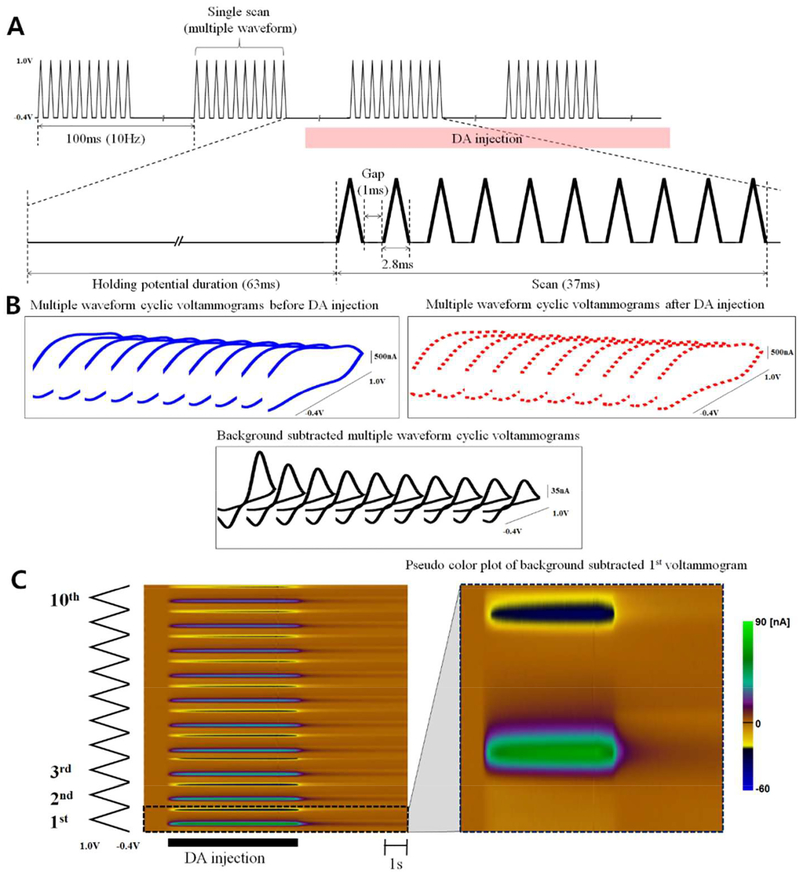
The multi-waveform FSCV consists of 10 triangular waveforms with a gap duration (1ms) in a single scan as shown in Figure 1A. The triangular waveform used in the multiple waveform data acquisition was from −0.4 V to + 1.0 V and back to −0.4 V at 1000 V/s. The total duration of a single scan was 37ms and the scan was repeated at intervals of 100ms (10Hz, 63ms holding duration).
Figure 1.
Schematic of the multi-waveform fast-scan cyclic voltammogram (M-FSCV) (A) M-FSCV consists of ten consecutive triangle waveforms with a gap in a single scan and the scan sequence is repeated at a rate of 10Hz. The triangular waveform cycles from −0.4 V to +1.0 V and back −0.4 V at 1000 V/s. (B) Ten background current voltammograms from a single scan before (solid blue line) and after DA injection (dashed red line), with a background-subtracted M-FSCV (solid black line). (C) Pseudo color plot of background subtracted M-FSCV
Data acquisition
Data were acquired using a commercial interface (NI USB-6251, 16 bit, National Instruments) with a personal computer and a LabVIEW software programming environment (National Instruments, Austin, TX). The NI USB-6251 was also used to synchronize the applied waveform and flow injection analysis control. After the data collection, background subtraction, signal averaging, and digital filtering were all done under software control. Custom programming was used to control waveform parameters and operations, such as data acquisition and transmission, the applied potential waveform, and data sampling rate. Data, in the form of a sequence of unsigned 2-byte integers, were saved to the personal computer hard drive for offline processing using MATLAB (MathWork Inc., Natick, MA). The acquired data were displayed in several graphical formats by custom software for real time analysis.
Fabrication of carbon fiber microelectrodes
The CFM was constructed by inserting a single carbon fiber (d = 7 μm, Cytec Thornel® T300) into a silica capillary and insulated with polyimide. The CFM was connected to a Nitinol wire (Fort Wayne Metals, Indiana, USA, Nitinol #1) with a silver-polyamide mixed paste. The Nitinol wire was insulated with polyimide tubing. The exposed carbon fiber was trimmed to a final length of approximately 50 μm using a scalpel blade5. The Ag/AgCl reference electrode was fabricated by chloriding a 31 gauge silver wire.
Flow injection apparatus
A flow-injection analysis system was used for the in vitro measurements of DA and consisted of a syringe pump (Harvard Apparatus, Hollisoton, MA) that directed a buffer solution through a Teflon tube to a six-port injection valve (Rheodyne, Rohnert Park, CA). The injection valve was controlled by a 12V solenoid and was used to introduce the analyte from an injection loop to an electrochemical flow cell. A CFM was placed in a flowing stream of buffer and the analyte was injected as a bolus. All chemicals were purchased from Sigma-Aldrich (St. Louis, MO). The buffer solution was composed of 150 mM sodium chloride and 12 mM Trizma base at pH 7.4 or 6.4, and was pumped across the CFM at a rate of 2 mL/min12.
Chemicals
The analytes were dissolved in distilled water and placed in conical tubes at a stock concentration of 10 mM, and were then diluted with flow injection analysis buffer to the appropriate final concentration. All chemicals were purchased from Sigma-Aldrich (St. Louis, MO).
Results and discussion
Multi-waveform fast scan cyclic voltammetry (M-FSCV)
A single scan in M-FSCV consists of ten consecutive triangular waveforms (decade voltammogram) with a 1ms gap between each waveform, as described in Figure 1A. The duration of a single triangular waveform is 2.8ms (from −0.4V to +1.0V and back −0.4V at 1000V/s) with a total scan duration of 37ms. A decade voltammogram can be acquired by a single M-FSCV scan (Figure 1B, blue line). When DA is present at the CFM (Figure 1B, dashed red line), a background subtraction method23 can be applied to the M-FSCV from the 1st to 10th waveform correspondingly. As a result, a decade of DA redox voltammograms (Figure 1B, black line) and corresponding pseudo color plot (Figure 1C) are acquired. These successive redox cyclic voltammograms have a rapidly decreasing voltammogram peak faradaic current pattern from the 1st to the 10th voltammogram because the adsorption time changes rapidly from 63ms to 1.0ms. This indicates that the amount of adsorbed DA reaches an equilibrium state from a slow repetition rate to a rapid repetition rate even when the concentration of DA is the same, which has been previously explained as based on sensitivity changes as a result of directly varying the DA adsorption time14,21.
Kinetics analysis of M-FSCV
The decreasing voltammogram peak faradaic current pattern of M-FSCV is influenced by the adsorption and desorption kinetics of DA on the CFM, depending on the holding potential duration. For M-FSCV, the kinetic model reported by Bath et al.14 was expanded to explain the observed pattern. The dynamic response of the faradaic current on the surface of the CFM was modeled by the adsorption and desorption kinetics of both DA and DOQ, as shown in equation 1.
| (1) |
Where DAsoln and DOQsoln are the solution-based forms of DA and DOQ, respectively, and DAads and DOQads are the amounts of DA and DOQ adsorbed on the CFM surface. k1 and k2 are the adsorption rates of DA and DOQ and k−1 and k−2 are desorption rates of DA and DOQ off of the CFM surface. There are several assumptions to be taken into account in this equation: first, the injection of DA is assumed to occur almost instantaneously. Therefore, the DA response to M-FSCV is mainly governed by adsorption/desorption characteristics of DA. Second, the DOQ in the solution does not exist before the start of DA oxidation, but during the anodic sweep after DA oxidation has occurred. Third, the concentration of DA and its surface coverage is equal. Fourth, the rates of adsorption and desorption of DA and DOQ are first order constant values. Fifth, all of the adsorbed DA is nearly completely oxidized to DOQ on the CFM surface during anodic periods. Lastly, the DOQ desorption process also occurs during the cathodic sweep after all of the adsorbed DOQ has been reduced to DA at the surface of the CFM during the holding potential before the start of the next waveform.
| (2) |
| (3) |
The differential equations 2 and 3 were also derived by Bath et al.14 from equation 1 and its underlying assumptions, where ΓDA and ΓDOq are the carbon surface coverage of DA and DOQ, respectively. In addition, [DA] and [DOQ] are the concentrations of DA and DOQ, respectively.
| (4) |
| (5) |
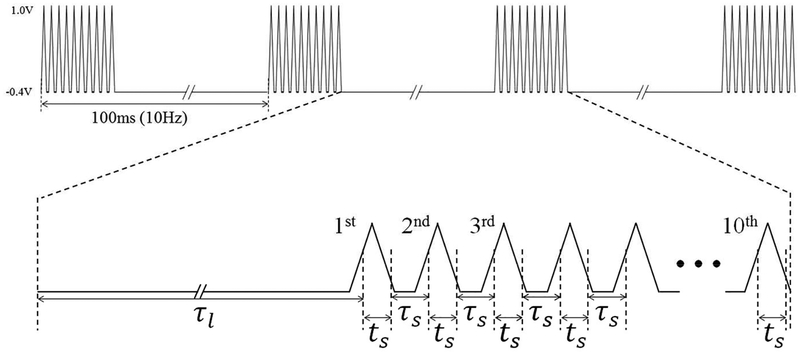
The equations 4 and 5 are derived from the integral forms of equations 2 and 3, respectively, while using the boundary conditions and , where and are the initial surface coverage of DA and DOQ, respectively14 In the case of M-FSCV, the initial concentration of both DA and DOQ during each successive iteration ( and ) can be determined by the final concentration in the previous step. Here, τ represents the duration between reduction potential and oxidation potential in consecutive triangle waveforms and t is the duration between oxidation potential and reduction potential. As shown in Figure 2, equations 4 and 5 could be applied to M-FSCV with three parameters; τl, ts and τs. The duration τl is from the reduction potential (−0.2V) in the 10th triangle waveform of the previous scan to the oxidation potential (+0.6V) in the 1st triangle waveform of the current scan. ts is the duration between the oxidation potential and reduction potential within a triangular waveform and τs represents the duration between the reduction potential and oxidation potential in consecutive triangle waveforms within a scan. In this study, the values for τl, ts and τs were 64.2ms, 1.6ms, and 2.2ms. A 1.0ms gap between triangle waveforms and a 63ms duration between scans and 1000V/s scan rate were used.
Figure 2.
Definition of parameters for redox kinetic analysis: τl is the duration from the reduction potential (−0.2V) in the 10th waveform of the previous scan and the oxidation potential (+0.6V) in the 1st waveform of the current scan. ts is the duration between the oxidation potential and reduction potential within a triangular waveform and τs represents the duration between the reduction and oxidation potential in consecutive triangle waveforms within the current scan.
| (6) |
| (7) |
For simplification of equations 4 and 5 in M-FSCV, and were substituted for α and β, respectively, as shown in equations 6 and 7. Using these equations developed by Bath et al.14, the model was expanded to explain the coverage of DA on the CFM surface in M-FSCV. An anodic sweep of the 1st waveform () is represented with and τl, which is the duration from the reduction potential (−0.2V) in the 10th waveform of the previous scan and the oxidation potential (+0.6V) in the 1st waveform of the current scan (equation 8). In addition, the coverage of DOQ in the cathodic sweep of the 1st waveform is shown in equation 9. In the same manner, is shown with ts and τs as equation 10.
| (8) |
| (9) |
| (10) |
The coverage of DA in the mth triangle waveforms (m>2) could be represented by an iterative calculation as shown in equation 11.
| (11) |
The sigma summation form in equation 11 could be eliminated with the difference calculation between and .
| (12) |
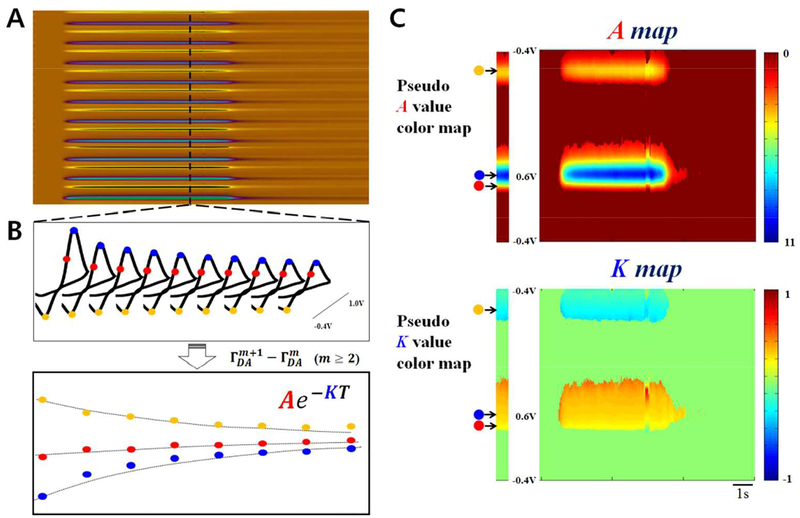
For equation 12, is , which is not dependent on the pulse iteration and is determined by the initial concentration of DA, the rate of adsorption and desorption, and time parameter (τl, ts and τs), and is constant at the same concentration. The most interesting aspect of equation 12 is that the difference in coverage between two consecutive triangle waveforms shows an exponential decreasing pattern with increasing number of applied triangular voltage waveforms (m in eq. 12). That is, when M-FSCV consists of ten consecutive triangle waveforms, the eight differential points at the oxidation peak potential can be obtained (m ≥ 2) and can be fitted to an exponential curve in the form of Ae−Km, where m is from 2 to 9 and K is k−1τs + k−2ts (shown as a blue dot-arrow in Figure 3C). can also be derived as equation 13.
Figure 3.
An outline of a M-FSCV 2D color map. (A) Representation of the conventional oxidation and reduction of DA in a pseudo color map of M-FSCV (B) DA response of M-FSCV (top) and the difference between the adjacent waveforms (bottom). (C) In the same manner, fitting calculations expanded to all voltage points of the voltammogram. A pseudo ‘A’ value color map (top) indicating concentration and a pseudo ‘K’ value color map (bottom) indicating the kinetic characteristics of the analyte.
| (13) |
For equation 13, is . Thus, the differences between two consecutive waveforms (m step and m+1 step) can be fitted to an exponential curve, which is described in equation 12 above. This exponential curve is derived from the desorption property of both DA and DOQ, which affects the decay rate. in equation 12 does not depend on the iteration of a single scan in M-FSCV, but rather is determined by the initial DA concentration, the adsorption and the desorption rate, time parameter (τl, ts and τs), which are constant values at the same concentration. A linear relationship exists between the value of ΓDA and the peak current of the cyclic voltammogram (ip ∝ Q/nFA = ΓDA). However, in this study we applied the deduced equation to all voltage points in the voltammogram in creating a 2D plot using the current parameters (Figure 3B). In other words, background subtracted M-FSCV waveforms were fitted by the exponential equation (Ae−KT) at all voltage points across the entire time, as shown in Figure 3A. Therefore, A and K values are calculated by the voltage and time units and each value can be plotted as shown in Figure 3C. The oxidation current differences between adjacent waveforms, (, m≥2), show an increase pattern, whereas the current differences in reduction part show a decrease pattern. Therefore, the A value should be negative and the K value should be positive in the modelling result using exponential decay equation (Ae−KT) for DA oxidation. In the case of reduction, the A value should be positive and the K value remain positive as well. Although the redox pattern for these fitted maps (maps A and K) are similar to the redox pattern obtained from conventional FSCV pseudo color plots, the information contained in these maps is quite different. In these newly depicted color maps, ‘A’ represents the initial amplitude of the exponential decay, ‘T’ is the scan iteration number minus one (m − 1) in one scan, and ‘K’ is a positive constant term (k−1τs + k−2ts) that describes how rapidly the difference in the coverage of DA or DOQ decreases with increasing scan number. In conclusion, the ‘K’ value indicates the kinetic characteristics of the analyte, and the ‘A’ value indicates the concentration of the analyte. Since the A value corresponds to concentration, we unified the sign as positive for both oxidation and reduction. In contrast, we switched the sign of the K value in the reduction sequence as negative to along the same line as FSCV’s customary response to DA.
Our previous study, which focused solely on DA, supported the notion that a significant amount of DOQ reduction takes place during the holding time. The reduction process is rate-limited by the concentration of H+ at the surface of the CFM. In addition, the intervals in the M-FSCV waveforms are too short to allow DOQ to be reduced to DA, so the conventional model cannot be used to precisely represent the kinetics of multiple waveforms as applied here. During these experiments, the kinetics of FSCV are affected by adsorption, desorption, oxidation and reduction. The kinetics of the reduction process is heavily affected by changes in the scan rate14,24. Therefore, equation 11 must be modified by multiplying a compensational decay coefficient e−R (0 ≤ e−R ≤ 1). This new equation explains why the rate of decay in the M-FSCV response to DA is faster than the theoretical value.
| (14) |
The equations used for determining DA coverage values with the compensational coefficient in all subsequent pulses are shown in equation 14 and a equation for determining the difference in detection values for DA in consecutive pulses (m and m+1) as expressed in equation 15.
| (15) |
Application of M-FSCV to DA in vitro and in vivo
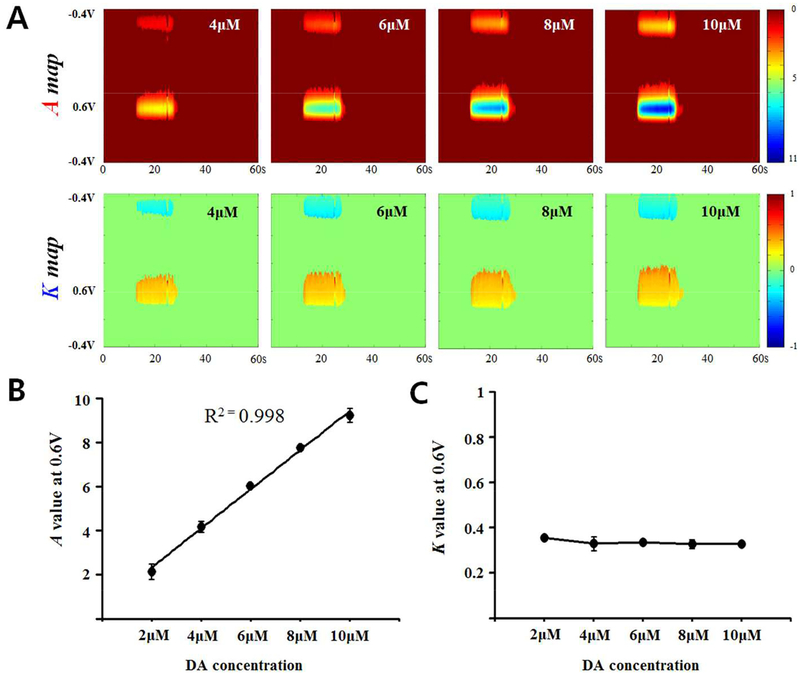
To characterize the values of A and K in M-FSCV, we used different DA concentrations to test the M-FSCV. As shown in Figure 4A, increasing the concentration of DA leads to an increased intensity in the A maps, but the K maps remain unchanged because the K value only affects the rate of decay, while the A value determines the initial concentration on the CFM surface, as described in equation 13. As equation 13 implies, the peak A value at +0.6V increased linearly with increasing concentrations of DA (Figure 4B, n=3, single CFM, R2=0.998). However, the K value remained relatively constant and no significant difference was detected among the concentrations examined (Figure 4C, n=3). From these observations, we reconfirm that the initial amplitude in exponential decay (A) is correlated with the concentration of analyte and the decreasing rate in exponential decay (K) is not affected by the concentration of the analyte. M-FSCV recordings in vivo also showed robust response in both A and K maps (Figure S1, n=4).
Figure 4.
Characterization of M-FSCV responses to DA concentrations. (A) A-maps (top) and K-maps (middle) for increasing concentrations of DA. (B) The A values are correlated with DA concentrations (n=3, single CFM, R2=0.998). (C) The K values remained around 0.32 through all concentrations. No significant difference was observed (n=3, single CFM).
Effect of mass transport and pH level
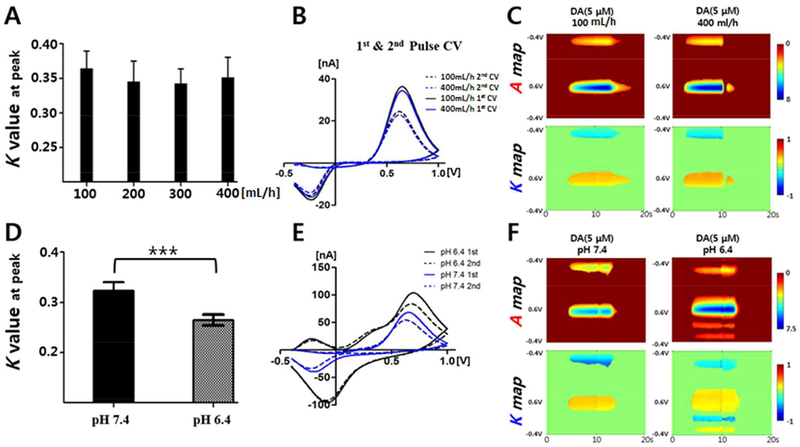
Previous studies have reported that the kinetics of DA in cyclic voltammetry is controlled by both adsorption and desorption at the CFM surface25,26. To examine whether adsorption effects are controlled by mass transport, we performed a flow rate controlled M-FSCV experiment in a flow cell. The flow rate was increased from 100mL/hour, which is close to the conventional flow rate (2mL/min) used to calibrate CFMs using FSCV, to 400mL/hour. As shown in Figure 5A, the K value was not affected by the flow rate and no significant differences were found among the flow rates. Changes in the voltammograms in Figure 5B and the K map patterns in Figure 5C were negligible. These results confirm that the cyclic voltammetry diffusion layer, which is located very close to the CFM surface, is not affected by the flow velocity in the flow injection cell system as previously reported25.
Figure 5.
The effects of flow rate and pH on the K value of DA. All flow cell experiments were conducted using 5μM DA. The flow rate and pH of the buffer were varied during this experiment. (A) The K value at the peak current with flow rates of 100mL/h to 400mL/h (n=4). (B) Comparison of the different voltammograms that resulted from different flow rates. 1st and 2nd CV of 100 mL/h (black lines) and 400 mL/h (blue lines) (C) The A and K pseudo color maps of the flow rate experiment. (D) The K value at the peak current with respect to the different pH levels (n=4, p < 0.0005, paired t-test). (E) DA 1st and 2nd CV with pH 6.4 (black lines) and pH 7.4 (blue lines). (F) The A and K pseudo color maps with respect to the different pH levels. All values are presented as the mean ± SD.
In order to investigate the correlation between the rate-limited reduction process of DA and the K value, we used two different pH levels (pH6.4, and pH7.4). The current of the reduction peak at pH 6.4 was significantly higher than the current recorded at pH 7.4, as shown in Figure 5E. The K value decreased significantly at lower pH conditions (Figure 5D). These results support the notion that an increase in the concentration of protons in the electrolyte medium results in an increase in the rate-limited two-electron transfer process coupled with two-proton transfer steps. Because of this phenomenon, even though the K value is independent from DA concentration at CFM surface, an increased reduction results in a slower decreasing pattern that leads to a lower K value, as shown in Figure 5D (n=4, CFM, p < 0.0005, paired t-test). The peak potential shift and broadening effect with acidification of the solution can be caused by quite complicated affects such as thermodynamic and kinetic effects32. With respect to the rate-limited reduction process, the thermodynamic and kinetic changes may lead to relatively wide and greater reduction of DOQ during the anodic sweep of the triangle waveform. AA, which serves as an important antioxidant in the brain, can affect the DA redox mechanism as well. In Figure S2, the K value of DA was significantly higher when AA was present in the buffer (n=3, CFM) which implies that AA is behaving as a reducing compound for DA and competing with DA at CFM surface.
Application of M-FSCV to examining various biogenic amines and their metabolites
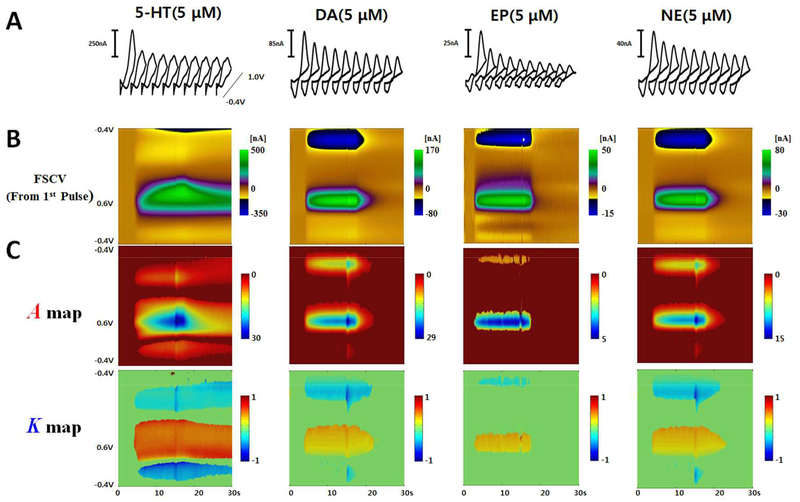
Numerous reports regarding the characteristics of biogenic amine adsorption/desorption to the CFM have appeared14,21,27–29. Because the adsorption/desorption characteristics can be quantified by M-FSCV, we applied the M-FSCV technique to several electro-active biogenic amines (DA, NE, EP, 5-HT) to quantify their adsorption/desorption characteristics. These catecholamines showed different decreasing rate characteristics compared to 5-HT at equimolar concentrations. The temporal response of the 5-HT oxidation peak current was very slow in the first triangular waveform, indicating that 5-HT is strongly adsorbed to CFM (Figure 6)30. The first waveform responses in M-FSCV are identical to the conventional triangle waveform results (Figure 6B). However, the catecholamines and 5-HT have distinctively different decay maps and K values at their peak currents, as shown in the Figure 6C and Figure 7.
Figure 6.
M-FSCV recordings of 5-HT, DA, EP, and NE. (A) The successive decade cyclic voltammograms of different analytes. (B) Color plots of the first pulses which are the same as a conventional FSCV result. (C) M-FSCV maps of successive decade cyclic voltammograms from analytes.
Figure 7.
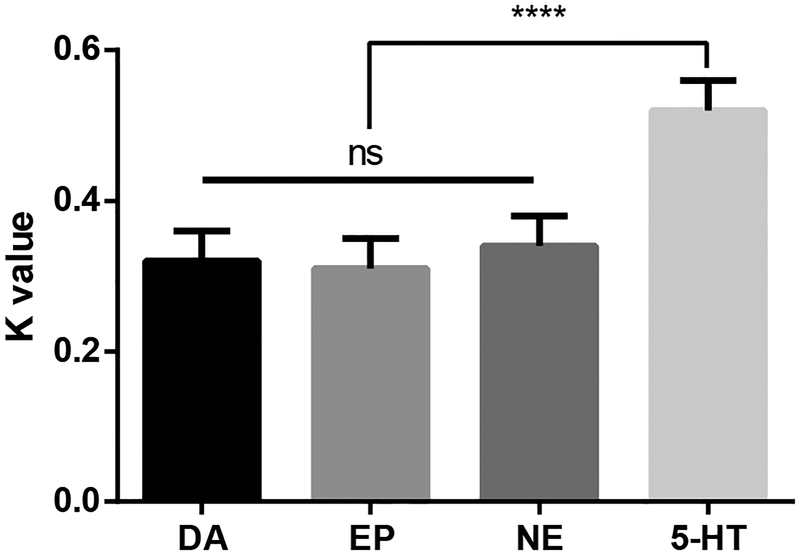
K value properties of analytes at CFMs (n=8 electrodes). The K value for the indolamine 5-hydroxytryptamine (5-HT) was significantly different compared to the K values for the catecholamines dopamine (DA), epinephrine (EP), and norepinephrine (NE (1-way ANOVA, p<0.0001, Tukey’s multiple comparisons test). There was no significant difference within the catecholamine group. All values are presented as the mean ± SD.
The cyclic voltammograms for DA, NE, and EP were nearly identical, but DA showed the largest sensitivity because of its adsorption properties31. In other words, each catecholamine has a different sensitivity at the same concentration. These different catecholamines were found to have different adsorption rates at the same concentration. However, K values were not significantly different regardless of analyte concentration and adsorption rate (Figure 7, n=8 electrodes). This is because the structures of catecholamines are very similar, in that they all contain hydroxyl groups that are oxidized. This is contrary to 5-HT, which has stronger adsorption properties compared to the catecholamines, hence, 5-HT has the highest sensitivity10,21. However, the K value for 5-HT is much higher than the corresponding value for catecholamines at the peak current potential. The K value in 5-HT is an indicator of how rapidly the difference in the coverage of the reagent decreases with the consecutive scans. The CFM surface fouling effect by 5-HT may contribute to the resulting value of K. However, a single scan (37ms) is not a long enough duration of time for surface fouling to take place. As such, the initial peak currents of 5-HT during the flow cell analysis were maintained. The K values for each group were significantly different (Figure 7, 1-way ANOVA, p<0.0001, Tukey’s multiple comparisons test, n=8). M-FSCV responses for major metabolites of DA (3,4-dihydroxyphenylacetic acid, DOPAC and homovanillic acid, HVA) and 5-HT (5-hydroxyindoleacetic acid, 5-HIAA) are also described in Figure S3.
Conclusions
In this study we mathematically modeled a decreasing voltammetric waveform pattern of DA faradaic current using M-FSCV. Background subtracted voltammograms in M-FSCV were fitted by an exponential decaying model and expanded to all voltage points in the series of waveforms to generate new types of pseudo color maps. Using the M-FSCV technique, we were able to obtain both a conventional cyclic voltammogram and fast decaying maps, which are related to the specific electroactive analyte and its concentration. In conclusion, M-FSCV has the potential to serve as a complementary technique to FSCV to evaluate adsorption/desorption characteristics of essential neurochemicals in the brain, in addition to conventional redox responses.
Supplementary Material
ACKNOWLEDGEMENTS
This research was supported by the NIH 1U01NS090455–01 award and the National Research Foundation of Korea (NRF-2017R1A2B2006896).
Footnotes
CONFLICT OF INTEREST STATEMENTS
The authors declare that we have no conflict of interest in relation to the work in this article.
References
- (1).Hashemi P; Dankoski EC; Petrovic J; Keithley RB; Wightman RM Anal. Chem 2009, 81, 9462–9471. [DOI] [PMC free article] [PubMed] [Google Scholar]
- (2).Kimble CJ; Johnson DM; Winter BA; Whitlock SV; Kressin KR; Horne AE; Robinson JC; Bledsoe JM; Tye SJ; Chang SY; Agnesi F; Griessenauer CJ; Covey D; Shon YM; Bennet KE; Garris PA; Lee KH Conf Proc. IEEE Eng. Med. Biol. Soc. 2009, 2009, 4856–4859. [DOI] [PMC free article] [PubMed] [Google Scholar]
- (3).Griessenauer CJ; Chang SY; Tye SJ; Kimble CJ; Bennet KE; Garris PA; Lee KH J. Neurosurg 2010, 113, 656–665. [DOI] [PMC free article] [PubMed] [Google Scholar]
- (4).Keithley RB; Takmakov P; Bucher ES; Belle AM; Owesson-White CA; Park J; Wightman RM Anal. Chem 2011, 83, 3563–3571. [DOI] [PMC free article] [PubMed] [Google Scholar]
- (5).Chang SY; Kim I; Marsh MP; Jang DP; Hwang SC; Van Gompel JJ; Goerss SJ; Kimble CJ; Bennet KE; Garris PA; Blaha CD; Lee KH Mayo Clin. Proc 2012, 87, 760–765. [DOI] [PMC free article] [PubMed] [Google Scholar]
- (6).Oh Y; Kim DH; Shin H; Park C; Chang SY; Blaha CD; Bennet KE; Kim IY; Lee KH; Jang DP Int. J. Electrochem. Sci 2015, 10, 10061–10073. [Google Scholar]
- (7).Heien ML; Khan AS; Ariansen JL; Cheer JF; Phillips PE; Wassum KM; Wightman RM Proc. Natl. Acad. Sci. U. S. A 2005, 102, 10023–10028. [DOI] [PMC free article] [PubMed] [Google Scholar]
- (8).Wiedemann DJ; Kawagoe KT; Kennedy RT; Ciolkowski EL; Wightman RM Anal. Chem 1991, 63, 2965–2970. [DOI] [PubMed] [Google Scholar]
- (9).Bledsoe JM; Kimble CJ; Covey DP; Blaha CD; Agnesi F; Mohseni P; Whitlock S; Johnson DM; Horne A; Bennet KE; Lee KH; Garris PA J. Neurosurg 2009, 111, 712–723. [DOI] [PMC free article] [PubMed] [Google Scholar]
- (10).Jackson BP; Dietz SM; Wightman RM Anal. Chem 1995, 67, 1115–1120. [DOI] [PubMed] [Google Scholar]
- (11).Oh Y; Park C; Kim DH; Shin H; Kang YM; DeWaele M; Lee J; Min HK; Blaha CD; Bennet KE; Kim IY; Lee KH; Jang DP Anal. Chem 2016, 88, 10962–10970. [DOI] [PubMed] [Google Scholar]
- (12).Jang DP; Kim I; Chang SY; Min HK; Arora K; Marsh MP; Hwang SC; Kimble CJ; Bennet KE; Lee KH Analyst 2012, 137, 1428–1435. [DOI] [PMC free article] [PubMed] [Google Scholar]
- (13).Adams RN Prog. in Neurobiol 1990, 35, 297–311. [DOI] [PubMed] [Google Scholar]
- (14).Bath BD; Michael DJ; Trafton BJ; Joseph JD; Runnels PL; Wightman RM Anal. Chem 2000, 72, 5994–6002. [DOI] [PubMed] [Google Scholar]
- (15).Baur JE; Kristensen EW; May LJ; Wiedemann DJ; Wightman RM Anal. Chem 1988, 60, 12681272. [DOI] [PubMed] [Google Scholar]
- (16).Heien ML; Phillips PE; Stuber GD; Seipel AT; Wightman RM Analyst 2003, 128, 1413–1419. [DOI] [PubMed] [Google Scholar]
- (17).Robinson DL; Hermans A; Seipel AT; Wightman RM Chem. Rev 2008, 108, 2554–2584. [DOI] [PMC free article] [PubMed] [Google Scholar]
- (18).Takmakov P; Zachek MK; Keithley RB; Walsh PL; Donley C; McCarty GS; Wightman RM Anal. Chem 2010, 82, 2020–2028. [DOI] [PMC free article] [PubMed] [Google Scholar]
- (19).Hafizi S; Kruk ZL; Stamford JA J. Neurosci. Methods 1990, 33, 41–49. [DOI] [PubMed] [Google Scholar]
- (20).Chen P; McCreery RL Anal. Chem 1996, 68, 3958–3965. [Google Scholar]
- (21).Atcherley CW; Laude ND; Parent KL; Heien ML Langmuir 2013, 29, 14885–14892. [DOI] [PubMed] [Google Scholar]
- (22).Delahay P; Trachtenberg I J. the American Chem. Soc 1957, 79, 2355–2362. [Google Scholar]
- (23).Howell JO; Kuhr WG; Ensman RE; Wightman RM J. Electroanal. Chem. Interfacial Electrochem 1986, 209, 77–90. [Google Scholar]
- (24).Kim DH; Oh Y; Shin H; Blaha CD; Bennet KE; Lee KH; Kim IY; Jang DP J Electroanal Chem 2014, 717–718, 157–164. [DOI] [PMC free article] [PubMed] [Google Scholar]
- (25).Venton BJ; Troyer KP; Wightman RM Anal. Chem 2002, 74, 539–546. [DOI] [PubMed] [Google Scholar]
- (26).Jacobs CB; Ivanov IN; Nguyen MD; Zestos AG; Venton BJ Anal. Chem 2014, 86, 5721–5727. [DOI] [PMC free article] [PubMed] [Google Scholar]
- (27).Heien ML; Johnson MA; Wightman RM Anal. Chem 2004, 76, 5697–5704. [DOI] [PubMed] [Google Scholar]
- (28).Gerhardt GA; Oke AF; Nagy G; Moghaddam B; Adams RN Brain Res 1984, 290, 390–395. [DOI] [PubMed] [Google Scholar]
- (29).Bath BD; Martin HB; Wightman RM; Anderson MR Langmuir 2001, 17, 7032–7039. [Google Scholar]
- (30).Jackson BP; Dietz SM; Wightman RM Anal. Chem 1995, 67, 1115–1120. [DOI] [PubMed] [Google Scholar]
- (31).Robinson DL; Venton BJ; Heien MLAV; Wightman RM Clin Chem 2003, 49, 1763–1773. [DOI] [PubMed] [Google Scholar]
- (32).Deakin MR; and Wightman RM J. Electroanal. Chem. Interfacial Electrochem 1986, 206, 167–177. [Google Scholar]
Associated Data
This section collects any data citations, data availability statements, or supplementary materials included in this article.


