Abstract
Selective desalination through nanofiltration (NF) is of great interest for many industrial applications including reuse of power plant scrubber wastewater and treatment of water containing high concentrations of TDS (total dissolved solids). This work seeks to understand the effect ion interactions at the membrane interface have on rejection and flux performance of charged NF membranes. NF membranes were also effective for low energy desalination of scrubber wastewater from Georgia Power Plant Bowen, composed primarily of Ca2+, Mg2+, Cl−, and SO42−. As NF membranes have the capability for selective separations, 80% water recovery was achieved experimentally while maintaining an overall rejection of over 60% for Ca2+ and Cl−. The occurrence of CaSO4 precipitation at high water recovery was observed. The effect of precipitation on osmotic pressure and the effect of Cl− counterions on increasing gypsum solubility were explored for water recovery operation. This work expands on a previous work on the topics of desalination of multi-ionic solutions by incorporating the use of large scale membrane modules (0.59 m2) with several synthetic solutions as well as actual scrubber water containing precipitating elements, Ca2+ and SO42−. It was observed that the spiral wound membrane modules maintained a stable water permeability over the 144 day course of tests.
Graphical Abstract
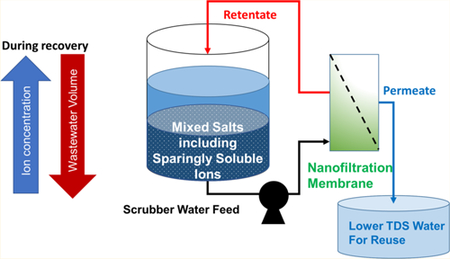
1. INTRODUCTION
Membrane processes have found extensive use in wastewater treatment and desalination in various industries such as textiles,1 dairy,2 and pharmaceuticals.3 Treatment of wastewater containing high concentrations of dissolved solids (TDS) requires selective separations due to osmotic pressure issues. Charged nanofiltration (NF) membranes have found extensive use in the desalination of produced water in the oil and gas industry due to the capability for selective separations and lower energy costs than reverse osmosis (RO) membranes.4
A thin film composite (TFC) NF membrane is formed by the interfacial polymerization of an amine compound with an acyl chloride, resulting in a surface of 100−200 nm.5 The presence of amine and carboxyl groups in TFC membranes result in a charge distribution throughout the membrane pores, which allows NF membranes to effectively reject ions which would not be rejected through size exclusion alone, thus maintaining a higher flux than denser reverse osmosis (RO) membranes.
Charged groups on the membrane surface repulse ions of like charge. Counterions to the repulsed ions are also rejected as charge must be conserved. This exclusion of ions, known as Donnan exclusion, results from the impact of charge on equilibrium partioning. Through Donnan exclusion, rejection of multivalent ions with like charge to the membrane is greater than that of monovalent ions or multivalent counterions (ions with opposite charge to the membrane).6 Thus, by the effect of Donnan exclusion, NF membranes have the potential to selectively separate ions depending on membrane charge and the valence states of the ions.7 Therefore, NF membranes have relatively high ion rejection while maintaining greater water permeability than that of RO membranes. The confined nature of water in the membrane pore leads to dielectric exclusion. Repulsion from dielectric exclusion also contributes to ion rejection in a manner that is significantly more substantial for salts with divalent ions (1:2, 2:1, or 2:2) than for 1:1 monovalent salts.8 In summary Donnan exclusion occurs due to charge repulsion between the membrane surface and ions, while dielectric exclusion is dependent on the magnitude of charge only.
NF membranes have been proven to be effective at removing divalent ions from solution.9 New polyamide-based composite hollow fiber NF membranes have been developed for low pressure water softening.10 Work has been done to model the rejection behavior of NF membranes for mixed salt solutions.11 The concentration polarization phenomenon in the rejection of mixed salt solutions has also been studied.12 High water recovery (~85%) has been investigated for single salt solutions of NaCl and MgSO42− and pretreated lake water.13
The goal of this work is to study ion rejection behavior of mixed salt solutions through NF membranes, with a focus on selective separations of mixed salt solutions through spiral-wound NF membrane modules. Larger scale spiral-wound membrane modules (0.59 m2 surface area) were used in testing to more accurately simulate industrial operating conditions and ensure consistency throughout testing. This work aims to test the effectiveness of desalination of scrubber wastewater at water recover exceeding 75%. Challenges of osmotic pressure increase during water recovery through NF desalination. This work also studies the onset of gypsum (CaSO4·2H2O) precipitation during water recovery, including the effect of counterions such as Cl− on gypsum solubility. This research expands on a previous work in the area of desalination of multicomponent feeds by incorporating the large scale membrane modules in experiments with a variety of synthetic feed solutions and water recovery of actual scrubber water with limitedly soluble ions in solution.
2. EXPERIMENTAL SECTION
2.1. Membranes and Solutions.
The PNF2A membrane studied was a charged polyamide thin film composite membrane developed in cooperation with Nanostone Membranes, Oceanside, CA. The PNF2A membrane is positively charged over a wider pH range than typical NF membranes. For comparison the negatively charged Nanostone NF3A membrane and recently developed NF4 membranes were used. All NF membranes were formed through the well-known interfacial polymerization process of anamine with an acyl chloride, but the exact composition cannot be disclosed. The membranes were tested in the spiral wound module configuration (0.59 m2). The use of membrane modules allowed for a more stable comparison than flat sheet membranes, as the same module was used for various tests. The larger surface area mitigates the impact of any membrane defects and the enclosed module protects the membrane from damage. The commercial NF3A and NF4 membranes were brought in for a comparison.
Feed solutions composed of pure salts and various salt mixtures were prepared for this study from ACS certified salts purchased from Fisher. Actual scrubber water (composition given in Table 1) received from Georgia Power Plant Bowen was also tested. The water contains high concentrations of Ca2+, Mg2+, Cl−, and SO42− mostly divalent cations, and a mixture of divalent and monovalent anions, along with some additional metals. The presence of Ca2+ ions from the limestone slurry and SO42− ions from the removal of SO2 from power plant flue gas is notable due to the potential of precipitation of CaSO4 solid. The received water was slightly below saturation concentrations as no particulates were observed suspended in the water.
Table 1.
Concentration of Various Ions and Trace Metals in Scrubber Wastewater Received from Plant Bowen, GAa
| ion/element | concentration (mg/L) |
|---|---|
| Ca2+ | 3184 |
| Mg2+ | 660 |
| Na+ | 100 |
| CI− | 6656 |
| SO42− | 1169 |
| Se | 0.61 |
| As | 0.005 |
| Ni | 0.39 |
| Cd | 0.06 |
| Mn | 5.79 |
| Zn | 1.92 |
Water pH = 4.5. Trace metal concentrations determined by inductively coupled plasma dynamic reaction cell mass spectrometry (ICP–DRC-MS) by Applied Speciation and Consulting LLC.
2.2. Experimental Apparatus and Methods.
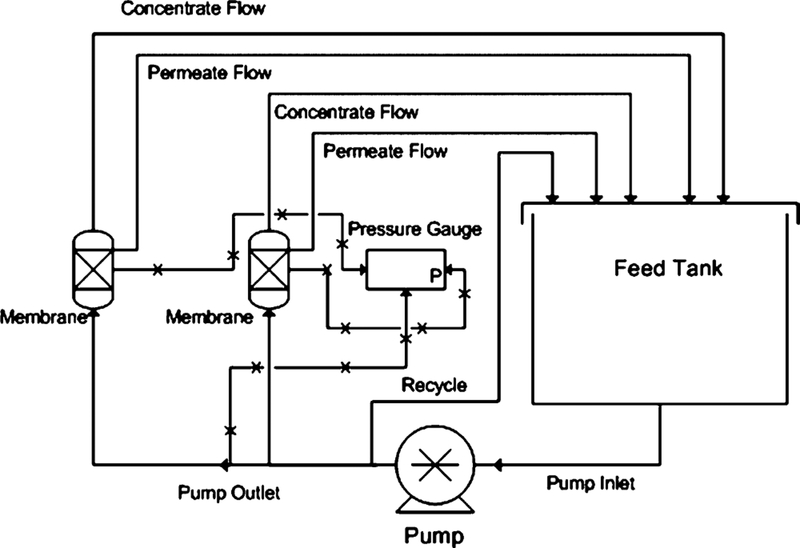
The experimental apparatus comprises two parallel PVC pressure vessels. The schematic for this unit can be seen in Figure 1. Feed solution was stored in a polypropylene tank and was delivered by a Procon stainless-steel pump (200 psi max pressure). In the tests, pressure was varied between 2 and 14 bar. A cooling coil was used to stabilize tank temperature which remained between 25 and 28 °C unless increased for the high-temperature study in which temperatures were increased to 40 °C. Concentrate flow rate was held between around 11.4 L/m. During normal operation, both concentrate and permeate were recycled back into the feed tank. The system was allowed 30 min to reach steady state before data collection after a change in operation pressure. The system was cleaned between test runs, with DI water being permeated through the membrane at a pressure of approximately 3.5 bar for 30 min. After cleaning, the water was discarded to prevent contamination. After recovery runs, the membrane was cleaned with DI water in a similar fashion to avoid scaling caused by the stagnation of water in the membrane. During water recovery testing, the system is operated in feed and bleed mode, meaning permeate was collected in a separate container, while the concentrate was recycled back into the feed tank.
Figure 1.
Membrane unit for the experimental testing of 2514 scale NF membrane modules.
2.3. Analysis.
All conductivity analyses for feed solutions and permeates were measured using a Fisher Scientific conductivity probe with an instrument error of 1%. Ca, Na, Mg, and Se concentrations were measured through analysis with inductively coupled plasma optical emission spectrometry (ICP-OES Varian VISTA-PRO). Following conventional ICP protocol, yttrium chloride (1 mg/L) was used as a standard to account for the variation in sample volumes. Samples were diluted with 1% nitric acid to aid in the digestion of ions in solution. The wavelengths used for cation analysis were 318.127 nm (Ca), 285.213 nm (Mg), and 568.821 nm (Na). Calculated error for ICP-OES was determined to be 1% for Ca2+, 7% for Mg2+, and 18% for Na+. Concentrations of Se exceeding 50 μg/L were analyzed at a wavelength of 196.026 nm. For samples containing less than 50 μg/L Se, graphite furnace atomic absorption spectrometer (GFAAS, Varian 880Z) was used. Samples were digested at 110 °C for 2 h. Selenium standards for analysis of selenium were prepared with similar concentrations of dissolved solids (accounting for dilution) in order to best match the matrix to the scrubber water samples. Concentrations of Cl− and SO42− were analyzed by DIONEX IC25 ion chromatograph (column: IonPac AS18 4 × 250 mm) with Na2CO3/NaHCO3 buffer solution as mobile phase (1 mL/min, 2000 psi). Cl− and SO42− errors were determined to be 3.9% and 6.8%, respectively.
Samples for scrubber water treated by NF and iron nanoparticle functionalized membrane were analyzed by Applied Speciation and Consulting, WA. Selenium speciation analysis was performed by ion chromatography inductively coupled plasma collision reaction cell mass spectrometry (IC–ICP–CRC-MS). Total elemental analyses for Se, As, Ni, Cd, Mn, and Zn were performed via inductively coupled plasma dynamic reaction cell mass spectrometry (ICP–DRC-MS).
2.4. Membrane Parameters.
For the various feed solutions the membranes were characterized by volumetric flux and the rejection of various species. Rejection, for a given species i, is given by
| (1) |
Ci,b and Ci,p correspond to the ion concentration of a species i in the bulk feed and the rejection, respectively. Volumetric water flux, given by Jw, is related to the water permeability of the membrane by
| (2) |
where A, a constant, is defined as the water permeability of a membrane, presented in this work in units of LMH/bar. ΔP is the transmembrane pressure.
| (3) |
Solute flux Js through the membrane is related to the water flux and permeate concentration through a material balance on ion, i.
The Van’t Hoff relation is used to determine osmotic pressure (ΔΠ) at ideal conditions, as seen in eq 4.
| (4) |
where Rg is the gas constant and T is temperature. This equation has been modified with the inclusion of the rejection term Ri to account for the partial ion rejection on the osmotic pressure. At higher concentrations of ions osmotic pressure deviates from the Van’t Hoff relationship. Of course, one can use the well-known equation by relating osmotic pressure with water activity.
| (5) |
where V is the molar volume of water and aw is the water activity. However, for the purpose of this work, the Van’t Hoff relation is determined to be sufficient to determine osmotic pressure in the concentration range between 10 000 and 30 000 mg/L TDS. At the beginning of recovery of scrubber water, the osmotic pressure calculated by the Van’t Hoff relationship only varied by 6% compared to the observed value.
3. RESULTS AND DISCUSSION
Ion rejection phenomenon were studied for several synthetic single salt and mixed salt feed solutions, in addition to scrubber wastewater from Plant Bowen, GA. Selective rejection preferential to divalent ions was observed in PNF2A operation for both synthetic mixed solutions and scrubber water. The addition of similar concentrations of monovalent salt had minimal effects on the rejection of divalent ions, while the rejection of the ions making up the monovalent salt was reduced, becoming negligible at higher concentrations. The flux and rejection of ions were studied for up to 80% water recovery of the scrubber wastewater, at which point over 60% TDS rejection was observed in the overall permeate. Gypsum formation was also studied during recovery.
3.1. Characterization of PNF2A Membrane Surface.
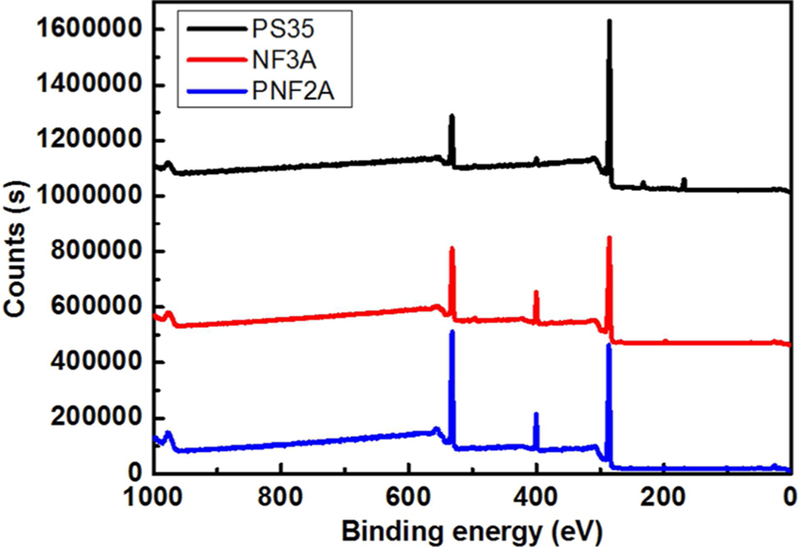
It is important to characterize the PNF2A membrane in relation to commercial membranes in order to analyze the rejection results in the appropriate context. The surface composition of a flat sheet of PNF2A was characterized using X-ray photoelectric spectroscopy (Thermo Scientific K-Alpha) with Al/K (hν = 2000 eV) anode mono-X-ray source. The results of a surface scan on PNF2A alongside NF3A, a commercial negatively charged polyamide NF membrane also produced by Nano-stone, in addition to PS35, a polysulfone ultrafiltration membrane used as a support in NF casting, are shown in Figure 2. The C 1s, N 1s, O 1s, peaks were present at 285, 532, 399 eV, respectively. It can clearly be seen that the intensity of the nitrogen peak in both of the NF membrane is much greater than the surface of the polysulfone backing (PS35). It can also be seen that the S 2s and S 2p3 peaks are not visible in the NF3A or PNF2A samples, thus the backing is not being expressed through the NF surface. The elemental ratios were determined by peak area and compared to literature results for NF 270, a commercial membrane produced by DOW FILMTEC, in Table 2.14 As indicated by the C/O/N ratio, PNF2A has a greater percentage of N than the NF-270 which results from the mixed amines added to the piperazine solution in the casting of the membrane.
Figure 2.
XPS survey scan of PS35, NF3A, and PNF2A membranes.
Table 2.
XPS Surface Characterization for O, N, and C Performed for PNF2A Membrane Compared to Literature Values for DOW NF-270 Membrane
| PNF2A, Experimental Data | DOW NF-27019 | |||
|---|---|---|---|---|
| peak | peak BE (eV) | atomic % | peak | atomic % |
| O 1s | 532.21 | 24.36 | O 1s | 22.3 |
| N 1s | 400.16 | 10.27 | N 1s | 7.5 |
| C 1s | 286.03 | 65.37 | C 1s | 64.4 |
| C/O/N ratio | 6.4:2.4:1 | C/O/N ratio | 8.6:3:1 | |
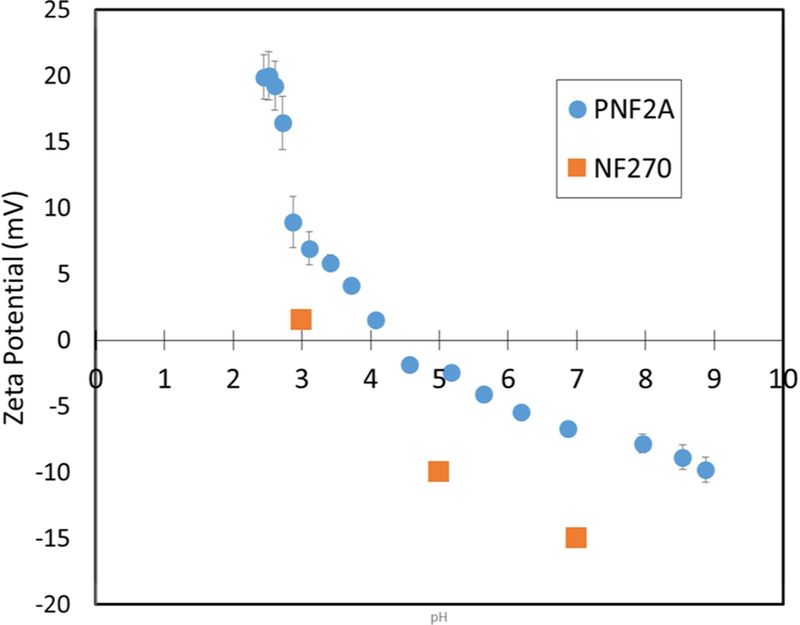
Zeta potential analysis was performed with the Anton-Paar Surpass Electrokinetic Analyzer to characterize membrane surface charge of the Nanostone PNF2A. These data are compared to literature data for the Dow NF-270 membrane published by Tannien et al.15 The resulting data can be seen in Figure 3. Two pKa shifts, one at pH 4 and one at pH 8 in the PNF2A membrane indicate the presence of both acidic and basic groups which in this case are both carboxyl and amine groups. The PNF2A membrane is shown to maintain a higher surface charge than the DOW NF-270 membrane over the pH range, due to the presence of primary amine groups. It must be stated that above pH 5 the PNF2A membrane is negatively charged. As a result, ion transport behavior in regards to counterion and co-ion properties should be comparable between membranes.
Figure 3.
Zeta potential of the Nanostone PNF2A and DOW NF-270 membranes15 vs pH. Zeta potential measured with the Anton-Paar SurPass Electrokinetic Analyzer using a 0.01 M KCl electrolyte solution.
3.2. Ion Rejection in Synthetic Single Salt Solutions.
The water permeability and rejection characteristics of single salt solutions (Na2SO4, CaCl2, MgSO4, NaCl) are presented for NF2A. Table 3 lists these values with data from literature for commercial membranes.15,16 Experimental results for NF3A and NF4, commercial negatively charged membranes also produced by Nanostone, have also been included for reference. Water permeability and single salt rejection of PNF2A are comparable to that of the commercial NF membranes. Concentrations were chosen to maintain charge equivalency of differing ions in later mixed salt experiments. At the concentrations chosen for synthetic salt solutions, the meq/L values are nearly equal to each other, 34.2 mequiv/L Na+ compared to 36 mequiv/L Ca2+ and 34.2 mequiv/L Cl− compared to 28.2 mequiv/L SO42− (a 20% difference). PNF2A ion rejection for single salts was found to increase in the manner of NaCl < Na2SO4 < CaCl2 < Mg2SO4. This corresponds to the combined influence of Donnan and dielectric forces in the rejection of ions. Higher rejection of divalent cations over divalent anions is explained by the larger hydrated ionic radius of Ca2+ (0.42 nm) and Mg2+ (0.44 nm) to SO42−9a,17.
Table 3.
Water Permeability and Single Salt Rejection Performance of Selected Commercial Membranes and PNF2Aa
| salt rejection (%) (concn) | |||||||
|---|---|---|---|---|---|---|---|
| NF membrane | source | contact angle (deg)15,16 | water permeability (LMH/bar) | Na2SO4 | CaCl2 | MgSO4 | NaCl |
| NF270 | Dow Filmtec | 30 ± 2 | 8.515 | 9615 | 6315 | 9916 | 5915 |
| NF90 | Dow Filmtec | 54 | 5.215 | 9515 | 98.815 | 9215 | |
| Desal-5 DK | GE-Osmonics | 74 ± 2 | 3.316 | 96 | 80 | ||
| NF3A | Nanostone | 22.3 ± 2.5 | 5.5 | 99.5 {14.1 mM feed} | 95.9 {18 mM feed} | 99.1 {16.1 mM feed} | |
| PNF2A | Nanostone | 17.7 ± 1.8 | 5.1 | 82.6 {14.1 mM feed} | 92.3 {18 mM feed} | 95 {16.1 mM feed} | 43.6 {34.2 mM feed} |
| NF4 | Nanostone | 8.5 | 98.3 {18 mM feed} | 46.2 {34.2 mM feed} | |||
Operating pressure for NF3A, PNF2A, and NF4 was 10.3 bar. Feed pH for single salt experiments ranged between 5 and 6.
3.3. Ion Rejection in Synthetic Mixed-Salt Solutions.
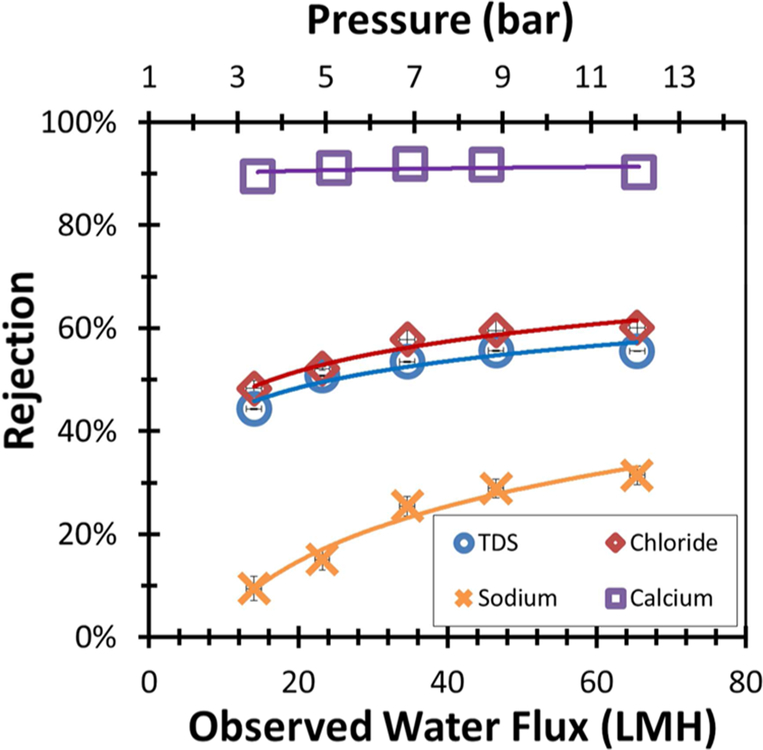
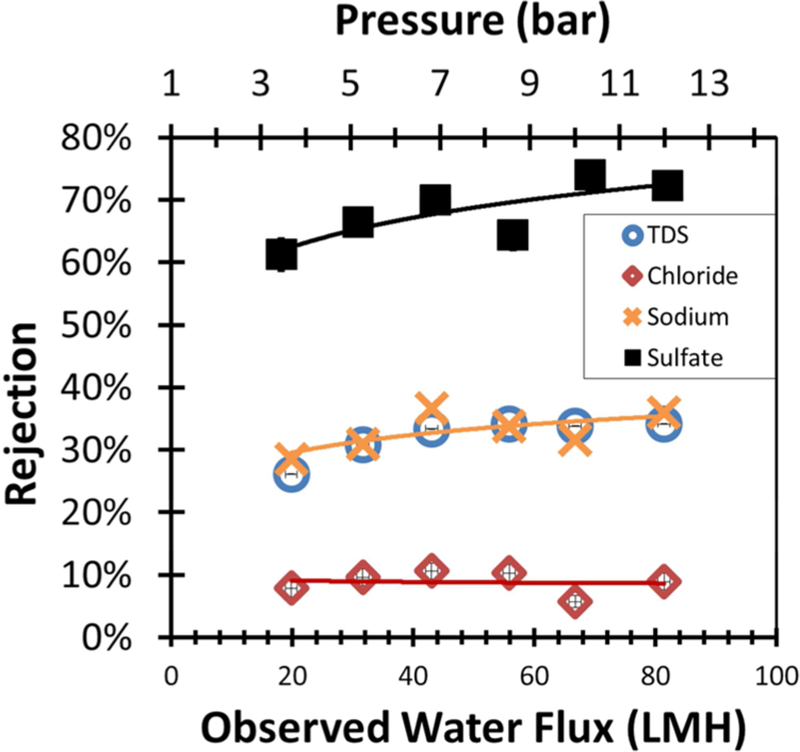
A goal in this work was to study the rejection characteristic of mixed-salt solutions containing either multiple cations or multiple anions. Two synthetic mixed-salt solutions were created, 18 mM CaCl2/34.2 mM NaCl (Figure 4) and 14.1 mM Na2SO4/34.2 mM NaCl. (Figure 5). In tests of both solutions it was evident that the rejection of the divalent ion was not significantly reduced in the presence of added monovalent salt. Monovalent salt rejection was reduced roughly 10%. These results suggest that at similar concentrations charge shielding does not inhibit rejection of divalent ions due to combined Donnan and dielectric exclusion forces. This is consistent with current literature. In experimental data published by Deon et al., a 1:2 ratio of MgCl2 to NaCl the Mg2+ rejection did not decrease from that of a similar concentration of solution of MgCl2.12 The synthetic salt solution experiments were limited to similar concentrations of salt. Excess concentrations of monovalent salt are predicted to reduce the rejection of the divalent ion, as it is well established that significantly increasing ionic strength reduces effective surface charge through shielding.18 The higher charge of Ca2+ interacts more closely with the membrane surface than Na+. This interaction helps to shield the Cl− from the charge of the membrane surface, reducing Donnan exclusion. Na+ has a smaller hydrated radius than Ca2+ and thus will transport through the pores more easily when charge is shielded.
Figure 4.
PNF2A water flux and rejection data for 18 mM CaCl2/34.2 mM NaCl mixed salt solution. Operating temperature was 27 °C. Feed pH = 6. Retentate flow rate was maintained at 10.1 L/min.
Figure 5.
PNF2A water flux and rejection data for 14.1 mM Na2SO4/34.2 mM NaCl mixed salt solution. Operating temperature was 27 °C. Feed pH = 6. Retentate flow rate was maintained at 10.1 L/min.
Similar results are also seen in Garcia-Aleman et al. in regards to the effect increasing Mg2+ concentration has on Na+ transport.19 The paper goes on to show behavior for Cl− transport in the presence of SO42−.
3.4. Ion Rejection During Increasing Ionic Strength.
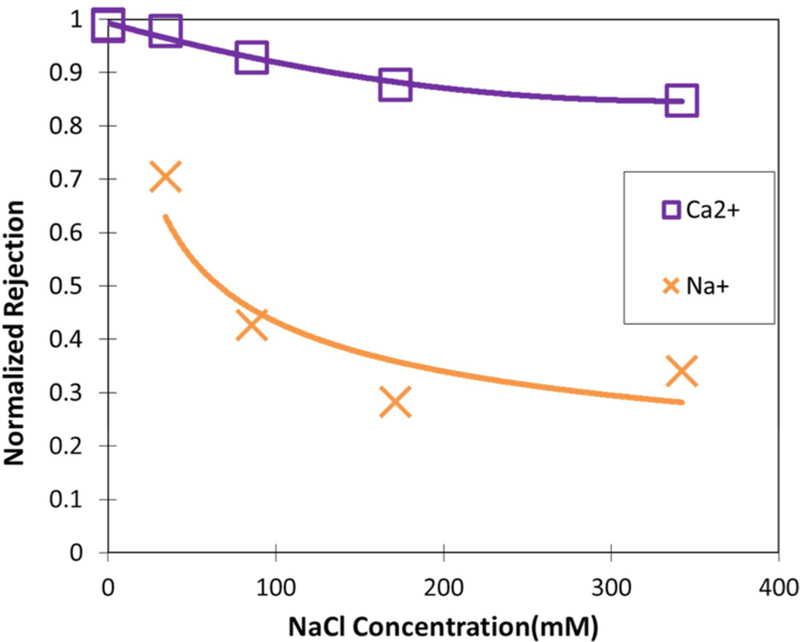
The effects of ionic strength on ion rejection are very significant in understanding transport and interactions for mixed salt solutions. This is particularly relevant as several industrial applications for NF membranes involve concentrations exceeding 10 000 mg/L TDS. To gain a better understanding of the effect of ionic strength and interaction of multiple salts, PNF2A rejection of Ca2+ and Na+ was studied as NaCl was progressively added to an 18 mM CaCl2 solution. Figure 6 shows the Ca2+ and Na+ rejection normalized over the pure CaCl2 and NaCl rejection shown in Table 1. Figure 6 clearly shows that the presence of CaCl2 corresponds to a reduced Na+ rejection when compared to the pure NaCl rejection at the same concentration. The initial added concentration of 34.2 mM NaCl however results in only 3% loss in Ca2+ rejection compared to the single salt rejection. It can be reasoned that in the case of similar equivalencies, the screening effects of the divalent ion have significant implication for Donnan exclusion of the monovalent ion, while the monovalent ion has negligible influence with how the divalent ion interacts with the membrane. Further increase in ionic strength led to the substantial rejection loss for Na+ compared to Ca2+. Charge shielding as ionic strength increases inhibits Donnan exclusion. Thus, the effect of charge repulsion due to charge shielding appears less severe with divalent ions than monovalent ions. The trend in rejection loss seems to level off beyond 200 mM NaCl. This concentration corresponds to the concentration beyond which membrane charge becomes constant, according to studies on membrane surface charge at high ionic strengths.20 Increased rejection of divalent ions at high ionic strength results from their larger hydrated ionic radius over monovalent ions as well as a larger potential for dielectric exclusion due to the magnitude of their charge. High selectivity becomes possible as charge repulsion remains significant enough to reject divalent ions, but monovalent ions are allowed to transport through the membrane.
Figure 6.
Rejection of Ca2+ and Na+ normalized using the single salt rejection in Table 1 vs NaCl concentration as NaCl was progressively added into the mixed salt feed. Initial feed concentration is equal to 18 mM CaCl2. Temperature = 28−30 °C. Retentate flow rate = 10.1 L/min. Feed pH = 6.
3.5. Partial Desalination of High TDS Scrubber Wastewater.
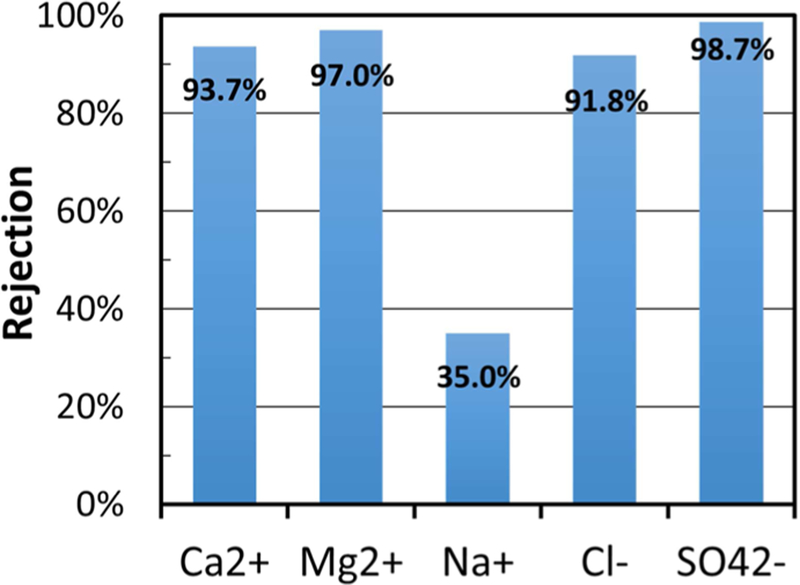
Unlike the high-TDS synthetic water feed solution, the scrubber water received from Plant Bowen, GA, had a relatively low concentration of Na+ (4.3 mM), while containing high concentrations of Ca2+ (~80 mM), Mg2+ (27.2 mM), Cl− (~186.2 mM), and SO42− (~12.1 mM). The overall TDS of the scrubber wastewater is 12 000 mg/L. As this water is largely composed of divalent ions, reduction of TDS through nanofiltration is hypothesized to be successful. Rejection of major ion components can be seen in Figure 7. It can be seen that the membrane rejected over 90% of all major ion species in the scrubber water with the exception of monovalent sodium. A flux 32.2 LMH was maintained during operation.
Figure 7.
PNF2A ion rejection for Plant Bowen scrubber wastewater. Experiment performed at 25 °C. Operating pressure was held at 13.45 bar. Water flux was observed to be 32.2 LM. Feed pH = 4.5.
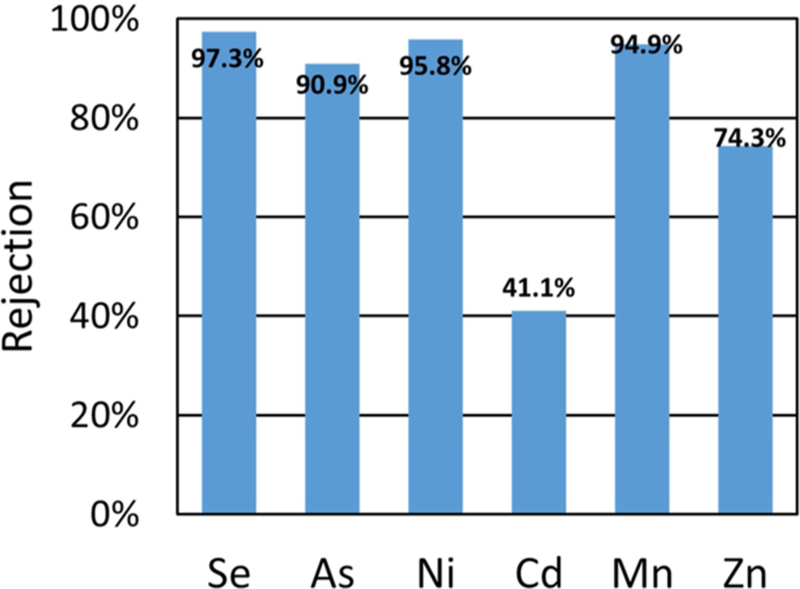
In addition to the rejection of major ions contributing to TDS in the process water, significant rejection of trace metals was achieved, among them selenium being a primary concern. Results for the rejection of trace metals in PNF2A can be seen in Figure 8. Speciation of PNF2A permeate revealed the presence of both Se (IV) and Se (VI). The pKa2 for H2SeO4 is determined to be 2, therefore all selenate is present in the solutions as SeO42−, a divalent anion. Rejection of SeO42− can be predicted to bear similarity to the rejection of SO42− ions. H2SeO3 has a pKa1 of 2.46 and pKa2 of 7.31 and is present in solution predominantly as HS2eO3− in the slightly acidic scrubber wastewater.21 Theoretically SeO42− would be rejected to a greater extent than HSeO3− due to the greater negative charge. Experimentally the rejection is influenced more by the ratio of divalent cations to monovalent cations than the composition of Se.
Figure 8.
PNF2A rejection of various trace metals in FGD process water from Plant Bowen. Water flux for PNF2A was 32.2 LMH. Temperature and operating pressure was maintained at 25 °C and 13.45, respectively. Feed pH = 4.5.
3.6. High Water Recovery of Scrubber Wastewater.
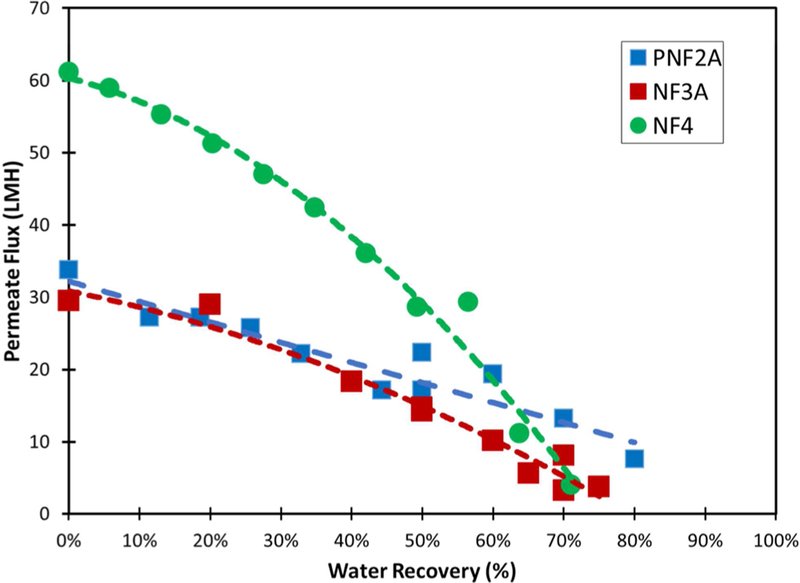
A single pass of scrubber wastewater through the NF membranes results in roughly 5% water recovery when concentrate flow rate is maintained at 3 GPM. Scrubber water feed was recirculated through the membrane while permeate was collected in a container to obtain high water recovery in a feed and bleed mode. Concentration polarization and surface scaling during feed and bleed operation is significantly reduced compared to operating at a high recovery during a single pass. Figure 9 shows the volumetric flux of the PNF2A, NF3A, and NF4 membranes. The decrease in volumetric flux corresponding to increasing water recovery is related to the increase in osmotic pressure of the feed solution with recovery. A higher water recovery could easily be obtained by operating at a higher pressure.
Figure 9.
Water flux throughout high recovery operation of the PNF2A, NF3A, and NF4 membranes. Operating pressure maintained at 13.8 bar. Retentate flow rate maintained at 11.4 L/min. Tank temperature varied from 20 to 27 °C. Feed pH = 4.5.
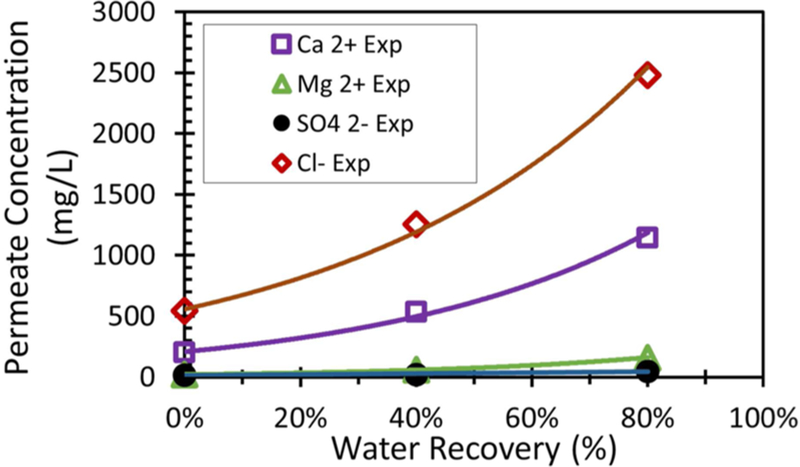
Table 4 shows the concentration of ions in the feed, PNF2A overall permeate, and retentate, after 80% water recovery was achieved in feed and bleed operation. The selectivity of the membranes for ion removal were quantified by the overall rejection of ions, determined by comparing the concentration of the total permeate to the initial feed. This method of quantifying rejection is most practical to the intended application of recovering water suitable for reuse in process, while reducing the volume of wastewater. Charge shielding from the increasing ion concentration at the boundary layer will reduce single pass rejection during the duration of water recovery. Even if this were not the case and rejection was to remain constant, overall rejection would still decrease over the course of water recovery. At 90% water recovery, 90% rejection of a particular ion would result in permeate that is close to the quality of the initial feed. Overall rejection of Ca2+ and Mg2+ was just over 60% and 76%, respectively. Overall Cl− rejection was observed to correlate with Ca2+ rejection as expected because Ca2+ and Cl− form the major cation/anion pair in solution. SO42− rejection after 80% water recovery was observed to remain at over 93% due to the formation of gypsum at higher water recovery preventing the increase of SO42− concentration during water recovery.
Table 4.
Feed, retentate, and overall permeate analysis for high water recovery operation of PNF2A membrane module
| Ca2+ (mg/L) |
Mg2+ (mg/L) |
Na+ (mg/L) |
Cl− (mg/L) |
SO42− (mg/L) |
NO3− as N (mg/L) |
Se (μg/L) | TSS (mg/L) |
|
|---|---|---|---|---|---|---|---|---|
| FGD process water feed | 2894 | 660 | 214 | 6585 | 1262 | 16 | 750 | 0 |
| PNF2A retentate 80% water recovery | 6307 | 1907 | 215 | 15839 | 1614 | 26 | 1570 | 1398 |
| PNF2A overall permeate | 1140 | 157 | 75 | 2480 | 47 | 4 | 120 | 0 |
| PNF2A overall rejection (%) | 60.6% | 76.2% | 64.9% | 62.3% | 93.5% | 71.6% | 84.2% |
NF membranes have the capability of achieving higher water recovery at lower operating pressures than RO membranes because of their selective rejection properties. As water recovery increases, rejection in an NF membrane decreases. RO membranes show relatively constant rejection vs water recovery, as size exclusion is the primary factor in rejection. At 80% water recovery the retentate concentration can be as high as 5 times that of the feed concentration, leading the osmotic pressure to increase nearly 5 times in RO membranes. However, in the case of an NF membrane, the rejection is far below 99%, so only a fraction of the osmotic pressure difference of RO operation is encountered. These can be observed in Figure 9. PNF2A rejection decreases more substantially during water recovery than either NF3A and NF4 allowing for greater water flux at high recovery.
3.7. Gypsum Formation.
The scrubber wastewater contains high concentrations of Ca2+ and SO42−, thus at high water recovery the precipitation of gypsum occurs as the solution reaches saturation. Gypsum fouling on the membrane surface and between feed spacers is well-known to be a cause of reduced volumetric flux. It is desirable to know the point in water recovery that gypsum precipitation will begin in addition, and the amount of particles formed after recovery is complete. Gypsum that precipitates does not contribute to osmotic pressure differences across the membrane. Thus, the true effect of precipitation of gypsum on flux during water recovery is a combination of reduced osmotic pressure and fouling aspects. Gypsum precipitation, if controlled by seed crystals or other methods, may also be utilized to reduce the retentate concentration and lower the osmotic pressure effect during high water recovery operation.22
Calcium sulfate dihydrate has been shown to only be soluble up to 0.015 molal at the temperature range between 20 and 40 °C.23 The Handbook of Chemistry and Physics value for Ksp of calcium sulfate dihydrate is 3.14 × 10⁻⁵ at 25 °C.24 However, the presence of Mg2+ and Na+, both present in significant concentration in scrubber water, is expected to increase the solubility of the solution as soluble complexes compete with gypsum.25 Similar solubility increases are hypothesized with the significant concentration of Cl− anions in solution. Concentrations of Ca2+ and SO42− were 0.158 M (6300 mg/L) and 0.017 M (1600 mg/L) in the final retentate, respectively. The ionic strength of the scrubber water is expected to increase the solubility of calcium sulfate dihydrate somewhat as would the slight increase of temperature during operation. The experimental ionic strength at 50% water recovery, I, was calculated to be 0.12 M. Therefore, significant interaction between Ca2+ and Cl− ions as well as Mg2+ and SO42− ions must be occurring.
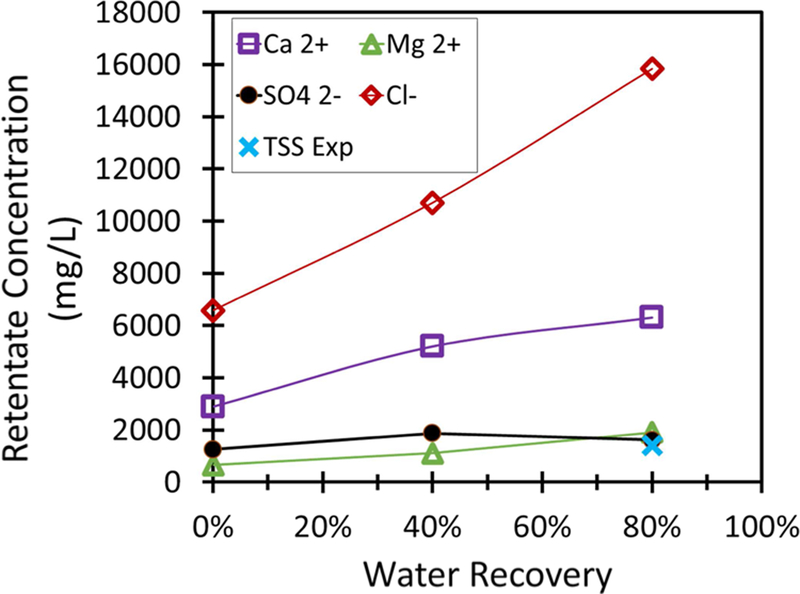
Experimental data for 80% water recovery for PNF2A operation suggests that the total suspended solid concentration was around 1400 mg/L in the retentate. This TSS concentration is a little over 5% of the concentration of the retentate TDS. Magnesium, a nonprecipitating divalent cation, tripled in concentration between feed and retentate after 80% of the water was recovered during the PNF2A tests. Comparatively the concentration species involved in the precipitation of gypsum, Ca2+ and SO42−, increased by 2.2 and 1.3 times respectively during the same test. The maximum amount of gypsum that could theoretically be present before water recovery is 1800 mg/L. Therefore, at 80% water recovery one would expect the maximum possible TSS value to be 9000 mg/L, far greater than the actual measured value. It is possible some CaSO4 could be present as a scale layer on the membrane surface, but flux behavior during recovery does not indicate scale formation is significant. Thus, the presence of Cl− and Mg2+ are believed to result in the reduced occurrence of dissolved solids unless there is significant presence of small particles that bypassed filtering during TSS collection.
As suggested by Mi and Elimilech, Ca2+ attraction to the surface of a negatively charged NF membrane may yield a higher concentration of Ca2+ at the surface, initiating the formation of gypsum prenucleation clusters.26 Thus, it may be possible to reduce fouling by inhibiting the formation of prenucleation clusters on the membrane surface by implementing a membrane with positive charge. If this were to be the case, fouling could still result to gypsum particles to agglomerate and stick to the membrane surface after formation. At the current degree of gypsum formation during water recovery, no significant fouling was observed. The particulates did not appear to adhere to the membrane surface, instead being carried by the convective cross-flow. Further experiments must be done to determine if indeed gypsum particle formation can be inhibited at the membrane surface and the magnitude fouling is reduced when particles are formed in bulk solution compared to the membrane surface.
3.8. Retentate and Overall Permeate Concentration during Water Recovery.
The concentration of retentate and permeate during water recovery is shown in Figure 10 and Figure 11, respectively. Na+ has been omitted due to low concentration. It was also assumed that precipitation would initially occur at the same product of [Ca2+] and [SO42−] in the retentate. This was done to account for the effect that the presence of Cl− and Mg2+ had on the solubility of gypsum. The formation of gypsum reduces the rate of increase of Ca2+ in the retentate. As MgSO4 is soluble, Mg2+ does not precipitate and continues to become concentrated in the permeate. The concentration of Cl− was determined by charge balance. The concentration of TSS has been plotted in Figure 10 to compare the concentration of gypsum crystals to Ca2+ and SO42− concentrations during water recovery.
Figure 10.
Retentate concentration during feed and bleed recovery of Plant Bowen scrubber water. TSS designates the concentration of suspended solids as water is recovered assuming precipitation began as water recovery occurred. Assume ΔP = 13.8 bar and cross-flow is maintained at 11.4 L/min. Feed pH = 4.5.
Figure 11.
Overall permeate concentration during feed and bleed recovery of Plant Bowen scrubber water. Assume ΔP = 13.8 bar and cross-flow is maintained at 11.4 L/min. Feed pH = 4.5.
3.9. Long-Term Module Stability.
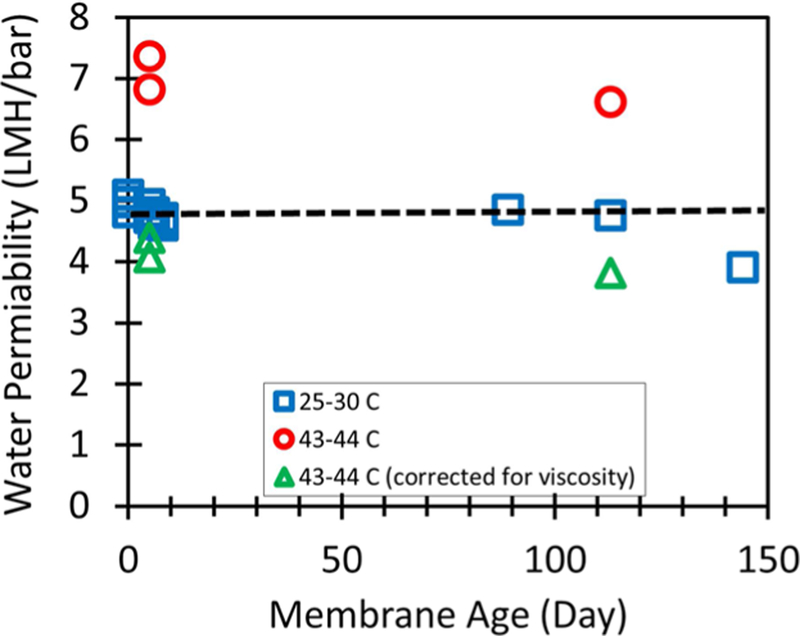
The spiral wound membrane module was tested over the course of 144 days. Figure 12 shows the water permeability of the membrane during the course of testing. A wide range of feed concentrations and temperatures was tested, including feed solutions containing over 10 000 mg/L TDS. Water permeability is dependent on the viscosity of water. Viscosity normalized permeability was calculated by the following equation.
Figure 12.
PNF2A stability over the course of testing. Temperature varied throughout testing. Outlying values of high permeability were observed during high temperature runs (~44 °C). Viscosity and osmotic pressure were used to correct experimental data for comparison.
| (6) |
Viscosity of water at a given temperature was interpolated from data from Kestin et al.27 As can be seen water permeability of the membrane remained stable over the course of testing, decreasing at most 20% after a time period of 144 days of on and off testing. The flux stability of the spiral wound membrane elements over a long span gives confidence for comparing membrane behavior over the course of testing. The packaging of the membrane inside the spiral wound element and pressure cell prevented damage from factors outside of the testing, such as the physical damage that can result from mounting or removing the flat sheet membranes from testing cells.
4. CONCLUSIONS
The rejection phenomenon for complex mixed salt solutions has been studied at multiple concentrations and mixtures using charged thin film composite nanofiltration membranes. For single salt solutions, the rejection of divalent ions was greater than the rejection of monovalent ions, consistent with the literature. For mixed salt solutions present in equal concentrations by mass, the presence of monovalent ions did not affect the rejection of divalent ions. It was also shown that the effects of charge shielding causes the loss of rejection for monovalent ions to be significantly less than for divalent ions. The selective rejections observed are consistent with literature. Effective desalination of scrubber wastewater containing various ions exceeding 10 000 mg/L TDS was performed using the PNF2A membrane, resulting in high rejections of divalent ions and trace metals. During water recovery operation, 80% of the original feed was recovered as permeate with over 60% reduction in all major ion species. Gypsum formation was found to occur beyond the predicted saturation point due to the presence of Mg2+ and Cl− as counterions. The gypsum precipitation helped maintain high SO42− rejection even at high water recovery. Over the course of several different tests over a 144 day span the spiral wound membrane module appeared to remain flux-stable.
NF membranes showed that NF desalination remained successful for recovering the scrubber water, as the water was not too highly pure to be reused in the process. Gypsum precipitation was shown to aid rejection and decrease the rate of osmotic pressure increase with recovery after the onset of precipitation. No fouling was observed at the concentrations of gypsum present during water recovery, but further tests incorporating higher gypsum concentrations are necessary to more conclusively test fouling
ACKNOWLEDGMENTS
The author acknowledges the support of the Southern Company in funding and collaboration, and additional funding from the National Science Foundation EPSCoR for funding, and from the National Institute of Environmental Health Sciences (P42ES007380). Nanostone Membrane of Oceanside, CA, provided support and collaboration in the development of membranes and spiral wound membrane modules.
NOMENCLATURE
- A
membrane water permeability
- aw
activity of water
- Ci,b
bulk concentration of component i
- Ci,p
permeate concentration of component i
- Jw
volumetric flux
- Rg
gas constant
- Ri
rejection of component i
- SA
surface area of membrane
- T
temperature
- TDS
total dissolved solids
- TSS
total suspended solids
- V
molar volume of water
- ΔP
applied pressure
- Π
osmotic pressure
Footnotes
The authors declare no competing financial interest.
REFERENCES
- (1).Cheng S; Oatley DL; Williams PM; Wright CJ Characterisation and application of a novel positively charged nanofiltration membrane for the treatment of textile industry wastewaters. Water Res 2012, 46 (1), 33–42. [DOI] [PubMed] [Google Scholar]
- (2).Aydiner C; Sen U; Topcu S; Ekinci D; Altinay AD; Koseoglu-Imer DY; Keskinler B Techno-economic viability of innovative membrane systems in water and mass recovery from dairy wastewater. J. Membr. Sci 2014, 458 (0), 66–75. [Google Scholar]
- (3).Gur-Reznik S; Koren-Menashe I; Heller-Grossman L; Rufel O; Dosoretz CG Influence of seasonal and operating conditions on the rejection of pharmaceutical active compounds by RO and NF membranes. Desalination 2011, 277 (1–3), 250–256. [Google Scholar]
- (4).(a) Çakmakce M; Kayaalp N; Koyuncu I Desalination of produced water from oil production fields by membrane processes. Desalination 2008, 222 (1–3), 176–186. [Google Scholar]; (b) Alzahrani S; Mohammad AW Challenges and trends in membrane technology implementation for produced water treatment: A review. Journal of Water Process Engineering 2014, 4 (0), 107–133. [Google Scholar]
- (5).Freger V Swelling and Morphology of the Skin Layer of Polyamide Composite Membranes: An Atomic Force Microscopy Study. Environ. Sci. Technol 2004, 38 (11), 3168–3175. [DOI] [PubMed] [Google Scholar]
- (6).Yaroschchuk AE Non-steric mechanisms of nanofiltration: superposition of Donnan and dielectric exclusion. Sep. Purif. Technol 2001, 22–23, 143–158. [Google Scholar]
- (7).(a) Ernst M; Bismarck A; Springer J; Jekel M Zeta-potential and rejection rates of a polyethersulfone nanofiltration membrane in single salt solutions. J. Membr. Sci 2000, 165 (2), 251–259. [Google Scholar]; (b) Hagmeyer G; Gimbel R Modelling the rejection of nanofiltration membranes using zeta potential measurements. Sep. Purif. Technol 1999, 15 (1), 19–30. [Google Scholar]
- (8).Yaroshchuk AE Dielectric exclusion of ions from membranes. Adv. Colloid Interface Sci 2000, 85 (2–3), 193–230. [DOI] [PubMed] [Google Scholar]
- (9).(a) Hagmeyer G; Gimbel R Modelling the salt rejection of nanofiltration membranes for ternary ion mixtures and for single salts at different pH values. Desalination 1998, 117 (1–3), 247–256. [Google Scholar]; (b) Van der Bruggen B; Koninckx A; Vandecasteele C Separation of monovalent and divalent ions from aqueous solution by electrodialysis and nanofiltration. Water Res 2004, 38 (5), 1347–1353. [DOI] [PubMed] [Google Scholar]
- (10).(a) Fang W; Shi L; Wang R Mixed polyamide-based composite nanofiltration hollow fiber membranes with improved low-pressure water softening capability. J. Membr. Sci 2014, 468 (0), 52–61. [Google Scholar]; (b) Setiawan L; Shi L; Wang R Dual layer composite nanofiltration hollow fiber membranes for low-pressure water softening. Polymer 2014, 55 (6), 1367–1374. [Google Scholar]; (c) Fang W; Shi L; Wang R Interfacially polymerized composite nanofiltration hollow fiber membranes for low-pressure water softening. J. Membr. Sci 2013, 430 (0), 129–139. [Google Scholar]
- (11).(a) Pérez-González A; Ibáñez R; Gómez P; Urtiaga AM; Ortiz I; Irabien JA Nanofiltration separation of polyvalent and monovalent anions in desalination brines. J. Membr. Sci 2015, 473 (0), 16–27. [Google Scholar]; (b) Cavaco Morão AI; Szymczyk A; Fievet P; Brites Alves AM Modelling the separation by nanofiltration of a multi-ionic solution relevant to an industrial process. J. Membr. Sci 2008, 322 (2), 320–330. [Google Scholar]
- (12).Déon S; Dutournié P; Fievet P; Limousy L; Bourseau P Concentration polarization phenomenon during the nanofiltration of multi-ionic solutions: Influence of the filtrated solution and operating conditions. Water Res 2013, 47 (7), 2260–2272. [DOI] [PubMed] [Google Scholar]
- (13).Sharma RR; Chellam S Solute rejection by porous thin film composite nanofiltration membranes at high feed water recoveries. J. Colloid Interface Sci 2008, 328 (2), 353–366. [DOI] [PubMed] [Google Scholar]
- (14).Mondal S; Wickramasinghe SR Produced water treatment by nanofiltration and reverse osmosis membranes. J. Membr. Sci 2008, 322 (1), 162–170. [Google Scholar]
- (15).Tanninen J; Platt S; Weis A; Nyström M Long-term acid resistance and selectivity of NF membranes in very acidic conditions. J. Membr. Sci 2004, 240 (1–2), 11–18. [Google Scholar]
- (16).Boussu K; Zhang Y; Cocquyt J; Van der Meeren P; Volodin A; Van Haesendonck C; Martens JA; Van der Bruggen B Characterization of polymeric nanofiltration membranes for systematic analysis of membrane performance. J. Membr. Sci 2006, 278 (1–2), 418–427. [Google Scholar]
- (17).Nightingale ER Phenomenological Theory of Ion Solvation. Effective Radii of Hydrated Ions. J. Phys. Chem 1959, 63 (9), 1381–1387. [Google Scholar]
- (18).Salgin S; Salgin U Streaming Potential Measurements of Polyethersulfon Ultrafiltration membranes to Determine Salt Effects on Membrane Zeta Potential. Int. J. Electrochem. Sci 2013, 2013 (8), 4073–4084. [Google Scholar]
- (19).Garcia-Aleman J; Dickson JM Permeation of mixed-salt solutions with commercial and pore-filled nanofiltration membranes: membrane charge inversion phenomena. J. Membr. Sci 2004, 239 (2), 163–172. [Google Scholar]
- (20).Coday BD; Luxbacher T; Childress AE; Almaraz N; Xu P; Cath TY Indirect determination of zeta potential at high ionic strength: Specific application to semipermeable polymeric membranes. J. Membr. Sci 2015, 478, 58–64. [Google Scholar]
- (21).Simons R Trace element removal from ash dam waters by nanofiltration and diffusion dialysis. Desalination 1993, 89 (3), 325–341. [Google Scholar]
- (22).McCool BC; Rahardianto A; Faria JI; Cohen Y Evaluation of chemically-enhanced seeded precipitation of RO concentrate for high recovery desalting of high salinity brackish water. Desalination 2013, 317 (0), 116–126. [Google Scholar]
- (23).Azimi G; Papangelakis VG; Dutrizac JE Modelling of calcium sulphate solubility in concentrated multi-component sulphate solutions. Fluid Phase Equilib 2007, 260 (2), 300–315. [Google Scholar]
- (24).Haynes WM CRC Handbook of Chemistry and Physics, 95th ed.; CRC Press: Boca Raton, Fla., 2014. [Google Scholar]
- (25).Le Gouellec YA; Elimelech M Calcium sulfate (gypsum) scaling in nanofiltration of agricultural drainage water. J. Membr. Sci 2002, 205 (1–2), 279–291. [Google Scholar]
- (26).Mi B; Elimelech M Gypsum Scaling and Cleaning in Forward Osmosis: Measurements and Mechanisms. Environ. Sci. Technol 2010, 44 (6), 2022–2028. [DOI] [PubMed] [Google Scholar]
- (27).Kestin J; Sokolov M; Wakeham W Viscosity of Liquid Water in the Range −8 to 150 °C. J. Phys. Chem. Ref. Data 1978, 7 (3), 941–948. [Google Scholar]


