Abstract
This research deals with the modeling and experimental verification of polychlorinated biphenyl (PCB) dechlorination using a porous membrane reactor embedded with Fe/Pd nanoparticles. We synthesized core/shell Fe/Pd nanoparticles in polyvinylidene fluoride (PVDF) microfiltration membranes functionalized with poly(acrylic acid) (PAA). PAA functionalization was achieved by in situ free radical polymerization of acrylic acid in microfiltration membrane pores. Target ferrous ions were then introduced into the membranes by the ion exchange process. Subsequent reduction resulted in the in situ formation of 20–40 nm Fe nanoparticles. Bimetallic nanoparticles can be formed by post-deposition of Pd. The membranes and Fe/Pd nanoparticles were characterized by thermogravimetric analyzer (TGA), FTIR, scanning electron microscopy (SEM), and transmission electron microscopy (TEM). 2,2′-Dichlorobiphenyl (PCB4) and 3,3′,4,4′-tertrachlorobiphenyl (PCB77) were chosen as the model compounds to investigate the catalytic properties of bimetallic nanoparticles, the reaction mechanism, and the intrinsic kinetics. A two-dimensional steady-state model was developed to correlate and simulate mass transfer and reaction in the membrane pores under pressure-driven convective flow conditions. The 2D model equations were solved by a finite element technique. The influence of changing parameters such as reactor geometry (i.e., membrane pore size) and Pd coating composition were evaluated by the model and compared well with the experimental data.
Introduction
The creation and development of nanosized metal particles have brought important and promising techniques into the area of catalytic reaction. The extraordinary performance of the nanoscale particles was attributed to their high surface area to volume ratio as well as their unique physical and chemical properties. However, nanosized metals usually form aggregates during synthesis because of the high surface energy without the addition of appropriate additives (such as surfactants, polymers, etc.). Therefore, immobilization of metal nanoparticles is important from the point of view of reactor design, preventing loss of nanoparticles, and reduction of surface passivation. Considerable attention has been given to the preparation of metal nanoparticles embedded in metal oxides,1 zeolites,2 and polymer films.3 However, immobilization of nanoparticles in solid dense matrixes may cause a diffusion resistance during the catalytic reaction. To overcome this problem, it is advantageous to synthesize and immobilize nanoparticles in a porous matrix, such as membranes.
Porous microfiltration (MF) membranes are of great interest for this purpose because of their open structure and large pore size (50–200 nm). This is essential for attaining highly efficient utilization of available sites as well as the easy accessibility to the nanoparticles immobilized inside the membrane matrix. The traditional size-exclusion-based MF membrane process does not require the pore surface be active in the separation. It is promising to utilize and modify the membrane pores with functional groups to obtain special separation and reaction functions. Many studies have been reported on functionalizing the MF membrane pores with -OH, -NH2, -SO3H, -COOH, or -CONH2 groups byusing chemical modification,4 polymerization,5,6 and layer-by-layer assembly (LBL) methods.7,8 The functionalized membrane has been studied for various applications such as NF-type separation,9 heavy-metal removal,4,10,11 protein recovery,12 bioreaction,8 and catalysis.13 The advantages of using functionalized porous membranes are high mass-transfer capacity and low operating pressure due to the open structure.
MF membranes supported with nanoparticles are a new type of functionalized membrane. It has been reported14–19 that various metal nanoparticles can be immobilized in MF membranes for different catalytic reactions. Previously,16 our group has investigated the synthesis of Fe/Ni nanoparticles in cellulose acetate (CA) membrane by phase inversion and the reduction method. Batch reaction modeling of trichloroethylene degradation was studied using Fe/Ni nanoparticles in CA membranes. However, the reaction and transport model for convective flow inside an MF membrane reactor functionalized with metal nanoparticles has not been studied. This paper presents the convective flow experimental and modeling studies of reductive dechlorination of polychlorinated biphenyl (PCB) as an environmentally important model compound with membrane-supported Fe/Pd bimetallic nanoparticles. The Fe/Pd nanoparticles were synthesized in a poly(acrylic acid)-modified MF membrane using ion-exchange followed by an in situ reduction method. PCBs are highly toxic even at low concentration levels. The conventional PCB degradation methods are microbial transformations and20 carbon adsorption21 followed by incineration22 and chemical reduction at elevated temperatures. However, these traditional methods are usually inefficient (biodegradation), or require high temperature and long reaction times. For example, dechlorination of PCBs by zerovalent irons requires temperatures of 400 °C.23 Thus, it is important to develop effective methods for degradation of chlorinated organics at ambient conditions.
Our previous studies17 have discussed the synthesis and characterization of Fe/Pd nanoparticles in the porous membrane functionalized with ion exchange groups. The PCB reaction kinetics by membrane-based bimetallic nanoparticles at room temperature in batch mode has been investigated in our previous studies. In this paper, the main objective is to understand and quantify the PCBs mass transfer and reaction properties in the functionalized membrane pore. A two-dimensional mathematical model is developed to describe and predict the membrane reactor performance at steady-state conditions. The 2D model considers convection, diffusion, the role of dopant metal, and reaction kinetics in the membrane reactor module. The purpose of this model is to provide comprehensive analysis for the design and operation of the membrane reactor and to simulate and predict the reactor performance under various system parameters and operating conditions. The influence of Pd loading, membrane pore size, reaction rate, and PCB diffusivity was evaluated and compared with the experimental data.
Experimental Methods
Materials.
Acrylic acid (AA), benzoyl peroxide, 1,1,1-trimethylolpropane triacrylate (TMPTA), toluene anhydrous, ferrous chloride tetrahydrate (FeCl2 · 4H2O), potassium tetrachloropalladate (K2PdCl4), sodium borohydride (NaBH4), ethanol anhydrous, and hexane were purchased from Aldrich. Naphthalene-d8 (5000 mg L−1 in methyl chloride), decachlorobiphenyl (PCB209), 3,3′,4,4′-tetrachlorobiphenyl (PCB77), 3,4,4′-trichlorobiphenyl(PCB37),3,3′,4-trichlorobiphenyl(PCB35), 4,4′-dichlorobiphenyl (PCB15), 3,4′-dichlorobiphenyl (PCB13), 3,4-dichlorobiphenyl (PCB12), 3,3′-dichlorobiphenyl (PCB11), 2, 2′-dichlorobiphenyl (PCB4, DiCB), 4-chlorobiphenyl (PCB3), 3-chlorobiphenyl (PCB2), 2-chlorobiphenyl (PCB1), and biphenyl were obtained from Ultra Scientific. Dextran (MW 144 000, 482 000, 670 000, 1 400 000, and 2 000 000) was obtained from Sigma. Commercial PVDF microfiltration membrane (0.22 μm pore size, 4.7 cm diameter, 125 μm thickness, and 75% porosity) chosen as the substrate for the PAA functionalization was obtained from Millipore.
Preparation of Fe/Pd Nanoparticles in Membrane.
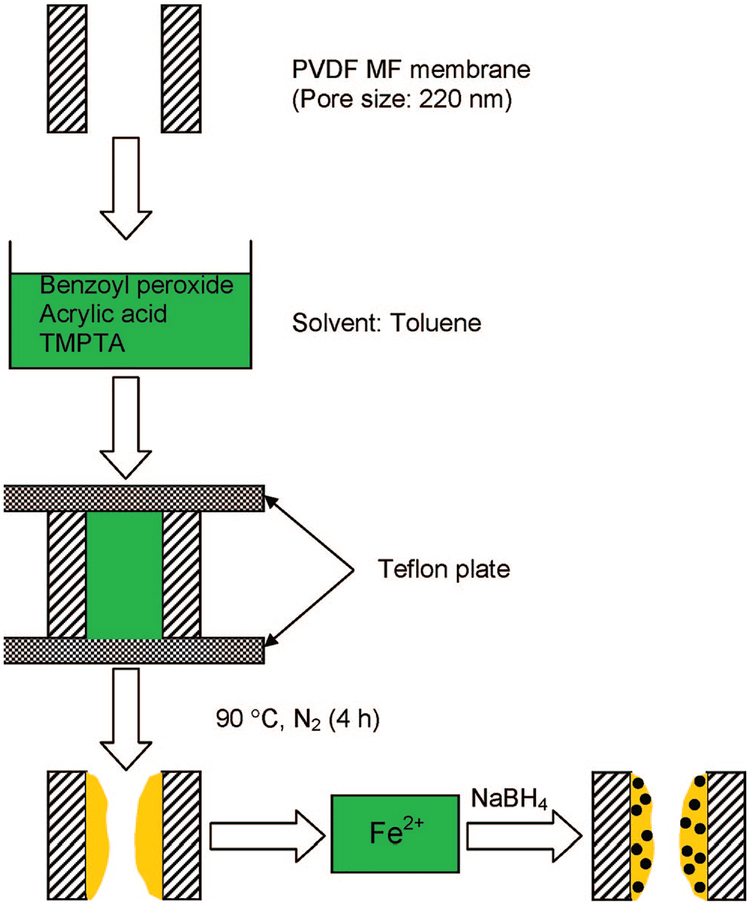
The details about the membrane-based Fe/Pd nanoparticle synthesis procedure has been described previously.17 Briefly, the membrane-supported Fe/Pd nanoparticles were prepared in three steps: polymerization of acrylic acid (AA) in polyvinylidene fluoride (PVDF) microfiltration membrane pores, subsequent ion exchange of Fe2+, and chemical reduction (by borohydride) of ferrous ions bound to the carboxylic acid groups. Fe/Pd bimetallic nanoparticles were formed by partial reduction of Pd2+ with Fe0 nanoparticles. The typical procedure for the PVDF MF membrane functionalization with PAA is presented in Figure 1. The AA monomer solution was prepared by mixing acrylic acid (30 wt %), benzoyl peroxide (0.5 wt %, initiator), and trimethylolpropane triacrylate (TMPTA) (1 wt %, cross-linking agent) in toluene. Benzoyl peroxide was used as the initiator. The polymerization was carried out at 90 ± 2 °C for 4 h. Fe2+ was captured by PAA-functionalized PVDF membranes by ion-exchange with Na+ at pH 5.5. Subsequent reduction with NaBH4 (0.07 M) resulted in the formation of Fe0 nanoparticles inside the membrane. The membrane-supported iron nanoparticles were then soaked in 50 mL of a solution (90/10 vol % ethanol/water) of K2PdCl4 (0.12 mM) for 30 min. This resulted in the deposition of Pd on the Fe surface. The Pd coating can be varied easily.
Figure 1.
Preparation Fe0 nanoparticles in PAA functionalized PVDF MF membranes by in situ polymerization of acrylic acid.
Characterization of Membrane and Fe/Pd Nanoparticles.
The structure and composition of the nanoscale metal particles were studied using transmission electron microscopy (TEM). A JEOL 2010F with a field-emission gun (FEG) and accelerating voltage of 200 kV was employed. In the present study, the EELS (electron energy loss spectroscopy) and STEM-EDS (scanning TEM energy dispersive X-ray spectroscopy) techniques were performed for two-dimensional element analyses of iron and palladium at the nanoscale level. The iron-L edge at ~708 eV and the palladium-M edge at ~335 eV were selected for the EELS mapping. The size of the focused electron beam for STEM-EDS mapping was about 0.5 nm in diameter. The X-rays induced by the electron beam from the specimen were detected simultaneously with the scanning of the electron beam and form EDS mapping images of selected elements. The dwelling time was chosen as 500 ms. The tilt angle was increased to 15°, which increased our count rate significantly. To obtain a thin film for TEM imaging, the membrane samples for TEM observation were prepared by ultrasectioning into about 50-nm-thick slices using a conventional microtome technique with a diamond knife. The cut slices were loaded on a copper TEM grid coated with lacey carbon film.
The thermal stability of the pore-modified PAA/PVDF membranes was examined using a TGA 2050 thermogravimetric analyzer (TA Instrument, USA). About 15 mg of sample was used. The scanning temperature range for the TG analysis was between 25 and 1000 °C with a heating rate of 10 °C/min under nitrogen atmosphere.
The Fourier transform infrared (FT-IR) spectra of the pore-modified PAA/PVDF membranes were obtained on a Nicolet Magna IR 860 Instrument in the range of 4000–500 cm−1.
Measurement of PCB Diffusivity through PAA/PVDF Membrane.
The PAA/PVDF membrane was immersed into the DIUF (Deionized Ultrafiltered) water and purged with O2 for 12 h to deactivate the iron nanoparticles. Then the membrane was mounted in the middle of a stainless-steel diffusion cell to separate the two compartments (feed side and permeation side). Each compartment in the diffusion cell has a volume of 500 mL. The membrane area separating the two compartments has an area of 3.5 cm2. Each compartment was stirred vigorously during the experiment. A solution of 0.6 mM DiCB (PCB4) was added into the feed-side compartment, and the same amount of solution without DiCB was placed in the permeation-side compartment. The DiCB concentration in the permeation side was measured versus time by GC-MS. To obtain the sample for GC analysis, 2 mL of solution was drawn from each compartment and extracted with 2 mL of hexane for 2 h, respectively. Because the change of DiCB concentration in the feed compartment is negligible, the DiCB concentration in the feed side (C10) is assumed to be constant. The DiCB concentration in the permeation compartment (C1) is always much less than that in the feed side (C10). The data can be analyzed by the following equation developed by Yang et al.24 to determine the diffusion and partitioning coefficient of DiCB in the membrane
| (E1) |
where A is the membrane area (m2); L is the membrane thickness (m); V is the volume of the permeation side (m3); and t is time (s); H is the DiCB partitioning coefficient through the membrane; Dm is the DiCB diffusivity through the membrane (m2 s−1).
TOC Analysis.
Neutral dextran (MW 144 000, 482 000, 670 000, 1 400 000, and 2 000 000) rejection was monitored via total organic carbon (TOC) measurements of the feed and permeate solutions (experimental error <2%) to determine the effective pore size of the pore-modified PAA/PVDF membranes.
Dechlorination Reactions.
The batch dechlorination reaction DiCB and PCB77 was conducted in 24.5-mL serum glass vials. In each batch vial, one piece of PAA/PVDF membrane (47 cm diam) embedded with 16 mg Fe/Pd nanoparticles was loaded into 20 mL of solution of PCBs. All of the serum glass vials were sealed with Teflon-lined silicon septa and placed on a wrist-action shaker throughout the duration of the experiment. At predetermined time intervals, a 2 mL of aqueous solution was withdrawn from the selected reaction vial and transferred to a 4-mL vial containing 2 mL of hexane for the extraction of PCBs. After removing all of the residual solution, 10 mL of hexane was added into the reaction vial for membrane phase extraction. The 4 mL and reaction vials were placed on a wrist-action shaker and mixed for 2 h to achieve extraction equilibrium. Duplicated experiments were conducted at each sampling time. Dechlorination of DiCB by the Fe/Pd nanoparticle immobilized PAA/PVDF membrane under convective flow was investigated using a dead-end filtration module supplied by Osmonics. This apparatus has a membrane area of 13.5 cm2 and contains a stirring device placed in close contact to the feed solution–membrane interface to minimize the effects of concentration polarization. Prior to the dechlorination study, pure water permeation at various pressures were measured to determine the membrane permeability.
PCB Analysis.
The details about analysis procedure for DiCB, PCB1, and biphenyl have been described previously.17 Briefly, the analysis was conducted by gas chromatography (GC: Varian-2800) equipped with mass spectrometry (MS: Varian-6100). From each extraction vial, a 1 mL aliquot of the extraction solvent layer was transferred to a 1 mL GC autosampler vial. Ten microliters of naphthalene (5000 mg L−1 in methyl chloride) was added into the GC sample vial as an internal standard. External standards of DiCB, PCB1, and biphenyl in hexane (Ultra Scientific) were used to prepare calibration curves. The calibration curves were linear over the concentration range of 0.5~20 mg L−1 ((R2 > 0.999, regressions were based on the 7-point calibration). According to known sample analysis each time, the maximum error was determined to be less than 10%. The detection limit for all of the PCBs was 0.1 mg L−1.
PCB77 and degradation products were analyzed by gas chromatography (GC: Agilent-6890) equipped with an inert mass-selective detector (MSD: Agilent-5975). Analyses for PCB77 dechlorination experiments were conducted by transferring a 100-μL aliquot of the extraction solvent to a 100-μL glass insert with a polymer bottom spring in a 1-mL GC autosampler vial. Ten microliters of decachlorobiphenyl (PCB209) (1 mg L−1 in hexane) were added into the 100-μL glass inert as the internal standard (IS). External standards of PCB77, PCB37, PCB35, PCB15, PCB13, PCB12, PCB11, PCB3, PCB2, and biphenyl in hexane were used to prepare calibration curves. The calibration curves for all of the PCBs were linear over the concentration range of 0.1~5 mg L−1 (R2 > 0.999, regressions were based on the 7-point calibration). It should be noted that PCB12 and PCB13 were unresolved under the chromatographic conditions. PCB12 and PCB13 were analyzed together as the total amount. The detection limit for all of the PCBs was 0.1 mg L−1. According to known sample analysis each time, the maximum error was determined to be less than 10%.
Model Development.
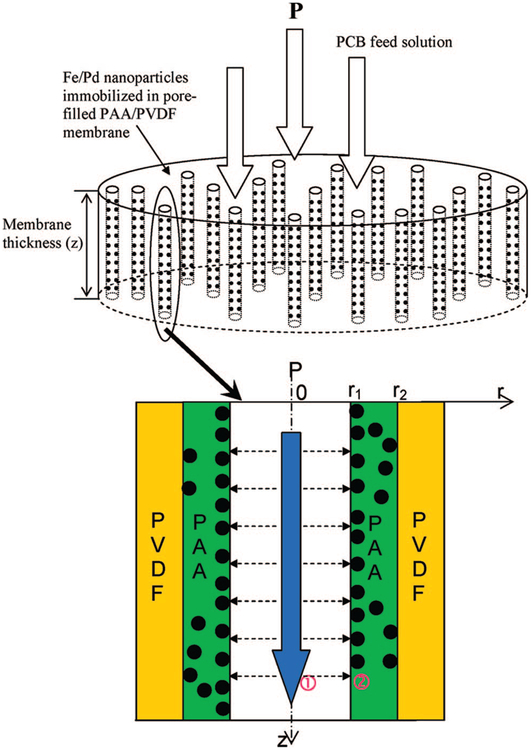
The dechlorination reaction of PCBs inside the pore-filled PAA/PVDF membrane containing Fe/Pd nanoparticles under convective flow mode was described by a two-dimensional reactor model. Figure 2 presents a schematic diagram showing the mass-transfer and reaction phenomenon of PCBs inside the PAA/PVDF membrane pores. The PCB solutions are transferred through the membrane by applied pressure, diffused, and reacted with Fe/Pd nanoparticles immobilized inside the PAA layer. The following assumptions are adopted for the model development.
Figure 2.
Schematic diagram showing the mass transfer and reaction taking place inside the membrane pores. P = applied pressure.
The membrane pores are assumed to be cylindrical and uniform in size.
Fully developed laminar flow is assumed for the liquid inside the membrane pores.
The model assumes homogeneous distribution of Fe/Pd nanoparticles in the PAA layer.
PCBs are transferred through membrane pores by convection and diffusion, and transferred into the PAA layer containing nanoparticles only by radial diffusion.
On the basis of the above the assumptions, the mathematical equations for the mass transfer and reaction inside the membrane pore and the reactive PAA region can be described as follows (Figure 2).
①Membrane pore region
| (E2) |
with the boundary conditions
| (E2a) |
| (E2b) |
The model eq E2 includes the expression for the convective flux and diffusion in axial and radial direction. Because the nanoparticles are assumed to be in the PAA region, there is no reaction term in E2. C is the concentration of PCB (mM), and C0 is the initial PCB concentration (mM). Ds is the diffusion coefficient of the bulk PCB in the membrane pores (m2 s−1). Ds is calculated from the Wilke and Chang equation:25
| (E2c) |
MB is the molecular weight of solvent (g mol−1); T is the temperature (K); μ is the viscosity of solvent (kg m−1 s−1); νA is the molar volume of PCB (m3 kmol−1, νA for DiCB is 0.161 m3 kmol−1).ϕ is the association factor for solvent (2.26 for water as the solvent and 1.5 for ethanol as solvent). On the basis of the calculation, Ds for DiCB is 8.50 × 10⁻¹⁰ m2 s−1 in water and 6.53 × 10⁻¹⁰ m2 s−1 in ethanol. Because the solvent matrix contains 50% vol ethanol and 50% vol water, an average Ds of 7.5 × 10⁻¹⁰ m2 s−1 was used in the model calculation.
Uz is the velocity along the z axis (m · s−1), and this can be changed by varying the transmembrane pressure. The fully developed laminar flow profile along the z axis is described by
| (E2d) |
where U0 is the mean velocity (m s−1) and r and z are the radial and axial coordinates (m). r1 is the mean pore radius after the PAA modification (m). r1 is calculated from the observed membrane rejection of various dextran by using the Ferry–Faxen equation:26,27
| (E2e) |
R is the rejection of dextran. rs is the hydraulic radius of the dextran molecule (m), which can be determined from the following correlation with the molecular weight of dextran:27,28
| (E2f) |
M is the molecular weight of dextran (g mol−1).
②PAA layer containing Fe/Pd nanoparticles
| (E3) |
with the boundary conditions
| (E3a) |
| (E3b) |
The model eq E3 describes the dechlorination reaction and axial and radial diffusion in the PAA region. C1 is the concentration of PCB (mM) in the pore region at the pore/PAA layer interface, and C2 is the concentration of PCB (mM) in the PAA layer. kin is the surface-area-normalized reaction rate at convective flow mode (L · m−2 · s−1). It has been discussed previously17 that kin can be expressed as the product of k2 and Γ (kin) k2 · Γ). k2 is the second-order rate constant at the Pd (reactive) site (L s−1 mol−1), and Γ is the surface concentration of reactive (Pd) sites (mol · m−2). ρ is the density of Fe/Pd (g · L−1). as is the surface area per unit mass of Fe/Pd (m2 g−1). H is the PCB partitioning coefficient. Dm is the PCB diffusion coefficient through the PAA layer (m2 s−1). r2 is the initial PVDF membrane pore radius (110 × 10−9 m). H and Dm are determined from the PCB diffusion experiments, which will be discussed later. km is the mass transfer coefficient (m s−1) determined from Sherwood number (Sh) correlations for the membrane filtration system at laminar flow conditions.29,30 Wiley et al.31 and van den Berg et al.32 used the following correlation for membrane filtration systems operating under fully developed laminar flow conditions (Re < 2000):
| (E3c) |
d is the membrane pore diameter after PAA modification (m). Re is the Reynolds number (Re = ρU0d/μ); Sc is the Schmidt number (Sc = μ/ρDs); L is the membrane thickness (125 × 10−6 m). The Peclet (Pe) number is another dimensionless number relating the rate of convection of a flow to its rate of diffusion. Pe is defined by the ratio of characteristic diffusion time over residence time. There are two Pe numbers in the system: Per (radial) and Pez (axial).
| (E3d) |
| (E3e) |
Per is a measure of radial diffusion resistance, and Pez is a measure of the axial diffusion resistance at certain conditions (flow rates).
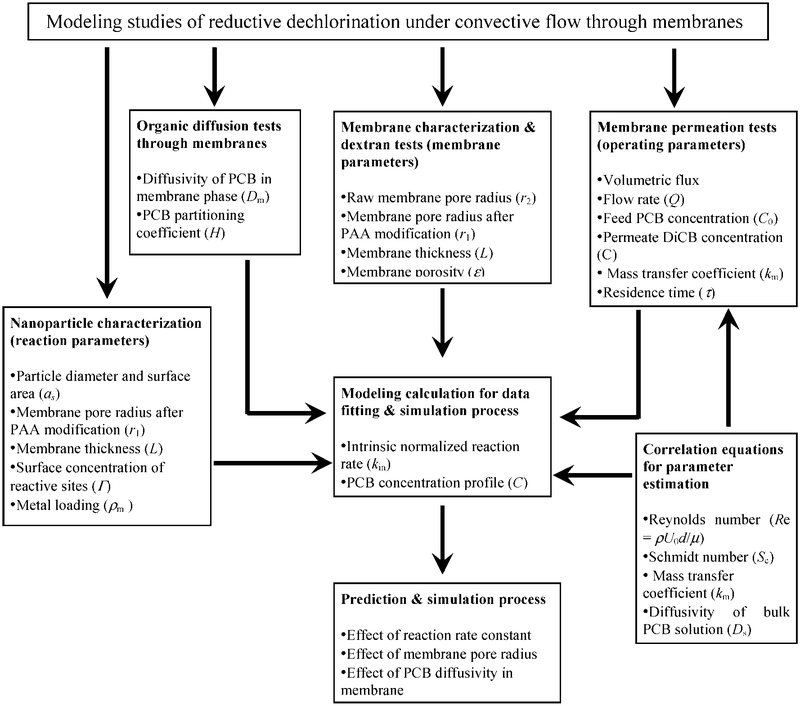
The modeling protocol developed in this work is summarized in Figure 3. In this model, the convective flow membrane reactor can be characterized by the following membrane parameters: pore size, porosity, and thickness; system parameters: PCB solution density and viscosity, PCB diffusivity, and partitioning coefficient; reaction parameters: nanoparticle surface area, Pd composition, metal loading, and intrinsic reaction rate constant; operating parameters: volumetric flux and initial PCB concentration. Because the reaction rate constant from the batch reaction is the observed rate that includes the effect of diffusion, the observed batch rate constant is not suitable for the convective flow model calculation. The intrinsic rate constant could be obtained from the batch reaction with Fe/Pd nanoparticles without a membrane. However, it is quite difficult to prepare the same Fe/Pd nanoparticles in solution without the support of a membrane. Therefore, the intrinsic rate constant (kin) has been determined by fitting the model with the experimental data. kin is the only parameter that was taken as a fitting parameter for model validation and simulation. All other parameters were determined by independent calculations or experiments.
Figure 3.
Protocol for modeling studies of reductive dechlorination under convective flow.
The two steady-state partial differential equations (eqs E2 and E3) were integrated together to obtain the PCB concentration profiles along the z axis of the membrane. Direct formation of biphenyl for the degradation of DiCB (2,2′-dichlorobiphenyl) is assumed because the chlorinated intermediate (2-chlorobiphenyl) was detected at trace levels. The concentration profile for biphenyl was calculated from the mass balance (neglecting the formation of 2-chlorobiphenyl). Femlab™ (COMSOL, version 3.0a) was used to solve the two sets of partial differential equations (eqs E2 and E3). Multiphysics axial symmetry modules of convection-diffusion were applied to the two-phase regions. The membrane pore and PAA region were partitioned into about 57 000 finite element cells to ensure accurate calculation of the concentration profile along the membrane pore axis. This model provides a useful and convenient method to study and simulate the effect of designing and operating parameters such as membrane properties, catalyst properties and loading, and flow rate on the performance of the reactor.
Results and Discussions
Membrane Characterization.
The chemical structure of PVDF membranes functionalized with PAA by in situ polymerization of AA was studied using FT-IR. The characteristic absorption band that appeared (not shown) at 1730 cm−1 is the ester (-COO-) bond,33,34 which comes from the carboxylic acid group of PAA. The strong intensity of the -C=O- in the ester bond confirms the successful PAA modification. The characteristic absorption band for CF2 of PVDF appears at 1120–1280 cm−1.34
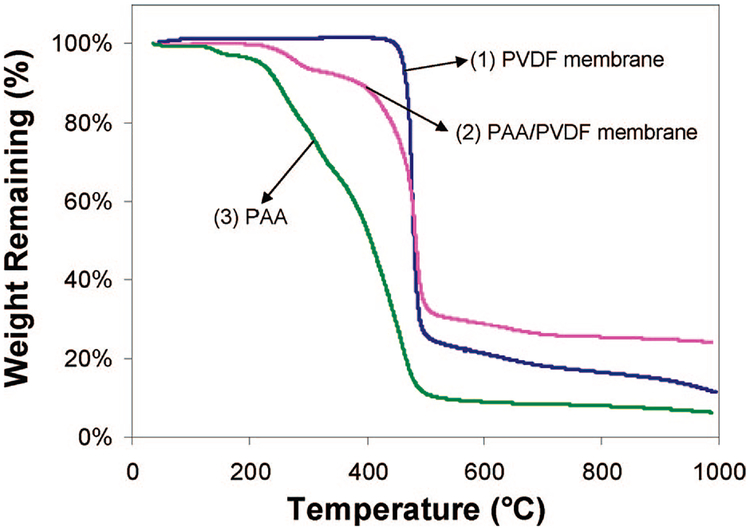
The thermal stability of the pore-filled PAA/PVDF membranes (containing Fe/Pd nanoparticle) was investigated by TG analysis. By monitoring the sample weight change with temperature, the TG analysis can provide important information on membrane thermal stability, PAA decomposing temperature, and PAA content. Figure 4 shows the TG analysis curves for the unmodified PVDF membrane, the pore-filled PAA/PVDF membrane (PAA in -COOH form), and the PAA powder. The unmodified PVDF membrane shows only one-step weight loss at 455 °C, which corresponds to the degradation of the CF2 chain (Ying et al., 2004). The PAA/PVDF membrane (-COOH form) exhibits a distinct three-step degradation process. The first weight loss is at the temperature range of 225~301 °C because of the formation of anhydride.35 The second weight loss is observed at the temperature range from 301~441 °C, corresponding to further decomposition of polyacrylic anhydride.35 The last weight loss occurs at 455 °C, which is attributed to the decomposition of the PVDF side chains.
Figure 4.
TG analysis curves of (1) the unmodified PVDF membrane, (2) the pore-filled PAA/PVDF membrane, and (3) PAA. The heating rate is 10 °C/min.
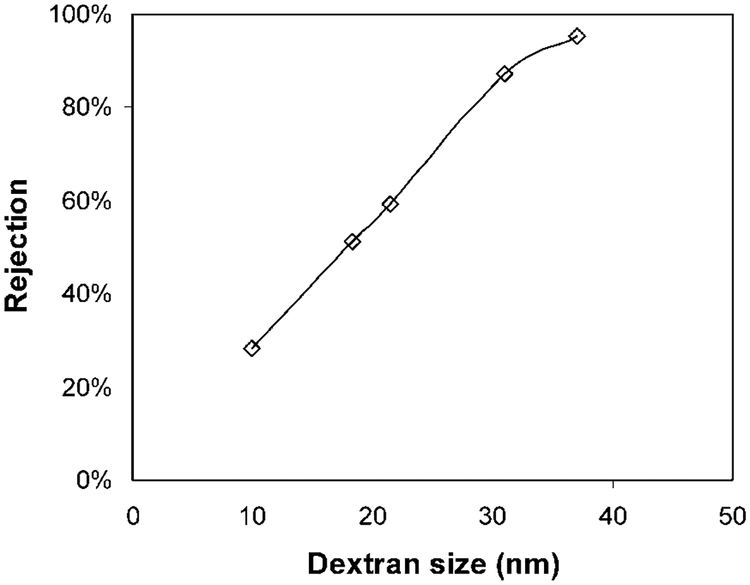
The mean pore radius was determined by measuring the retention of various molecular weights of dextran using the Ferry–Faxen equation (eq E2e). The dextran rejection result is shown in Figure 5. The pH of the dextran solution (800 mg L−1) was kept at ~7 to keep the PAA chain in extended form. As expected, with the increase of dextran molecular weight, we observe the increase of rejection. The rejection is 95% for the dextran with a molecular weight of 2 000 000. The mean pore size is determined to be 64 nm by using the Ferry–Faxen equation (E2e). Therefore, the thickness of the PAA layer is calculated to be 46 nm based on the initial 220-nm pore diameter. Initially, the unmodified PVDF membrane has a porosity of 75%. The porosity after modification is determined based on the assumption that the membrane pores are all cylindrical and uniform and PAA is homogeneously coated on the pore surface. The calculated membrane porosity after PAA modification is 25.4%. The residence time (τ) then can be obtained by dividing the membrane pore volume by the flow rate. And the mean velocity U0 can be determined from the membrane thickness and the residence time.
Figure 5.
Rejection of different molecular weights of dextran by the pore-filled PAA/PVDF membrane containing Fe/Pd nanoparticles.
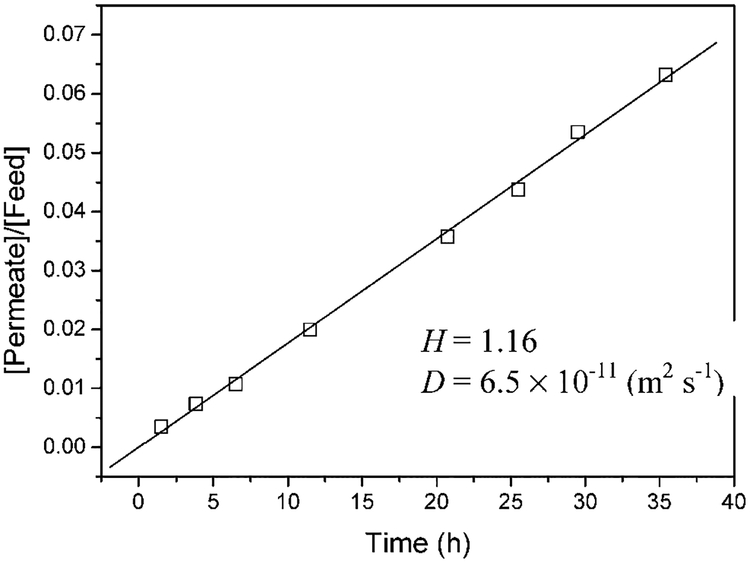
The experimental results for DiCB diffusion through the PAA/PVDF membrane containing deactivated Fe nanoparticles are shown in Figure 6. DiCB concentration in the permeation cell (C1) increases linearly with time. By fitting the data with eq E1, and from lag-time information, the partitioning coefficient (H) was determined to be 1.16. This is very close to 1 because the PAA is swollen with water. The diffusion coefficient (Dm) was found to be 6.5 × 10⁻¹¹ m2 s−1. This value is less than that in water (7.5 × 10⁻¹⁰ calculated from eq E2c). The lower number is expected because the polymer chain should restrain the diffusion of DiCB.
Figure 6.
Experimental values of DiCB diffusion through the PAA/PVDF membrane containing deactivated Fe nanoparticles. Membrane thickness: 125 × 10−6 m. Membrane area: 3.5 cm2.
Fe/Pd Nanoparticle Characterization.
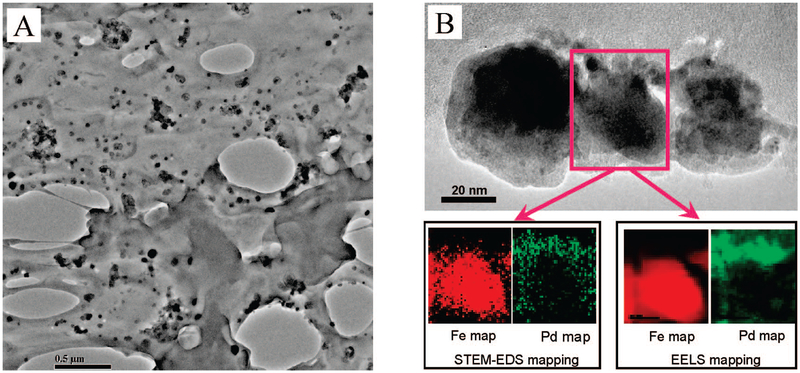
TEM analysis was performed to verify the formation and distribution of Fe/Pd nanoparticles inside the PAA/PVDF membranes. As shown in Figure 7A, spherical-shaped Fe/Pd nanoparticles were homogeneously dispersed in the membrane cross-section, indicating uniform PAA functionalization and Fe/Pd nanoparticle formation over the entire membrane. A statistical analysis of the image yielded an average particle size of 30 nm diam, with a standard deviation of 5.7 nm. Using a mean diameter of 30 nm, the external surface area for the nanoparticles was calculated to be 25 m2 g−1. EDS analysis (not shown) was also conducted to determine the elements present in the nanoparticles. The composition of the nanoparticles identified in the TEM image was also quantified by EDS and ICP analysis. The Pd content was determined to be 2.3 wt %.
Figure 7.
Characterization of Fe/Pd nanoparticles: (A) TEM image of the PAA/PVDF membrane cross section containing Fe/Pd nanoparticles, (B) STEM EDS and EELS mapping image of Fe/Pd nanoparticles (Pd = 2.3 wt %).
Next, the nanostructures and element distribution of the Fe/Pd nanoparticles were observed by STEM-EDS and EELS mapping. Figure 7B shows the mapping images of the corresponding area for Fe and Pd. The STEM-EDS mapping images17 clearly demonstrate a core/shell structure for the Fe/Pd nano-particle with Fe in the core region and Pd in the shell region. This is expected because Pd was post-reduced by Fe0 and deposited on the iron surface. The EELS mapping also showed a good qualitative agreement with the STEM-EDS mapping result. It can be seen that the shell region where palladium is enriched has a low iron concentration, whereas iron is enriched in the core region where no palladium is observed.
Dechlorination in Batch Reactor.
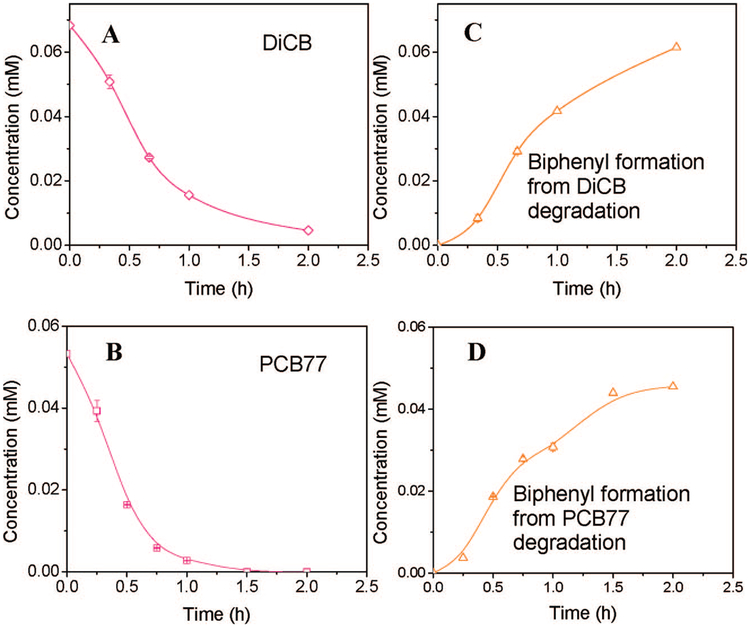
The reactivity of membrane-supported Fe/Pd nanoparticles was investigated in the reaction with DiCB and PCB77 as the model compounds. DiCB (non coplanar PCB) has two ortho-chlorines only, whereas PCB77 (coplanar PCB) has both meta- and para-chlorines but no ortho-chlorines. Figure 8 shows the dechlorination of DiCB and PCB77 with the Fe/Pd nanoparticles immobilized inside the PVDF/PAA membrane. Fe/Pd nanoparticles exhibit a high dechlorination rate for both DiCB and PCB77. After 2 h, complete degradation for PCB77 was achieved while about 90% degradation was achieved for PCB 4. Biphenyl was formed as the main dechlorination product in both cases. It has been proven in the literature36 that non-ortho-chlorinated PCB congeners dechlorinate faster than the ortho-chlorinated isomers. The reactivity of the chlorine substituents decreases in the order para ≈ meta > ortho.36 This explains the higher degradation rate for PCB77, which has no ortho-chlorines. The degradation for PCB77 showed all eight intermediates, which can occur in theory by reductive pathway. All of the intermediates appeared at very low concentration levels. This can be explained by the small difference in reactivity between para- and meta-chlorine substitutents.
Figure 8.
Batch reaction of PCB77 with Fe/Pd (Pd = 2.3 wt %) in PAA/PVDF membrane: (A) DiCB degradation; (B) PCB77 degradation; (C) biphenyl formation from DiCB degradation; (D) biphenyl formation from PCB 77 degradation. Metal loading: 0.8 g L−1.
It has been established that the PCBs dechlorination with Fe/Pd nanoparticles can be described by the following pseudo-first-order reaction kinetics:17,37,38
| (1) |
where C is the PCB77 concentration (mg L−1) at time (h), aS is the specific surface area of the nanoparticles (m2 g−1), ρm is the loading of the nanoparticles, kobs is the observed rate constant (h−1), and kSA is the surface-area-normalized rate constant (L h−1 m−2). The kSA values for DiCB and PCB77 were determined to be 0.141 and 0.067 L h−1 m−2, respectively.
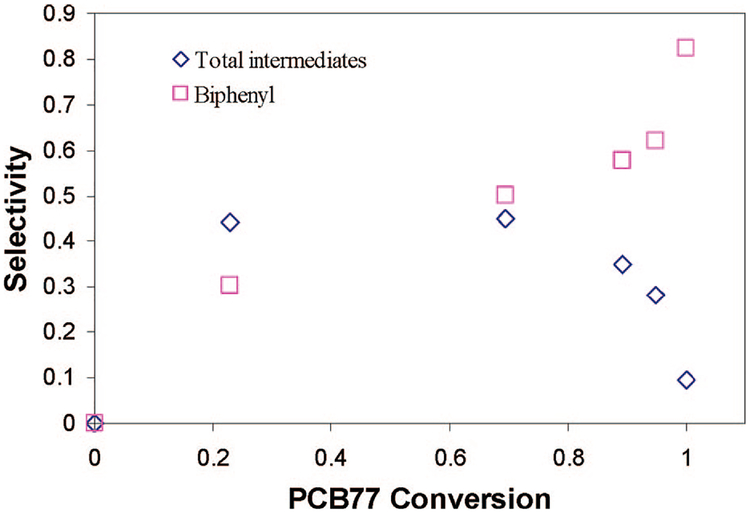
To obtain a better understanding and quantification of PCB 77 dechlorination, we plotted in Figure 9 the selectivity for biphenyl and the intermediates as a function of PCB 77 conversion. The eight different intermediates were added together as the total intermediates. The conversion and selectivity were calculated based on the following equations:
| (E4a) |
| (E4b) |
| (E4c) |
where X is the conversion, S is the selectivity, and C is the concentration (mM). It can be seen that although each single intermediate was observed in low levels compared to the biphenyl formation the selectivity of the total intermediates is almost equal to the biphenyl selectivity. The selectivity of the total intermediates remained unchanged when the PCB 77 conversion was increased from 20% to 70%, whereas the biphenyl selectivity increased from 30% to 50%. After 70% conversion, the intermediate selectivity decreases rapidly. This indicates that the degradation of PCB 77 does not result in a correspondingly equal amount of biphenyl. Before 70% PCB 77 degradation, the main dechlorination reactions are the conversion of PCB 77, tri- and dichlorobiphenyls to monochlorobiophenyl and the formation of biphenyl. After 70% conversion, the main reactions are the conversion of monochlorobiphenyl to biphenyl.
Figure 9.
Selectivity for biphenyl and the intermediates as a function of PCB 77 conversion.
DiCB Degradation under Convective Flow Mode.
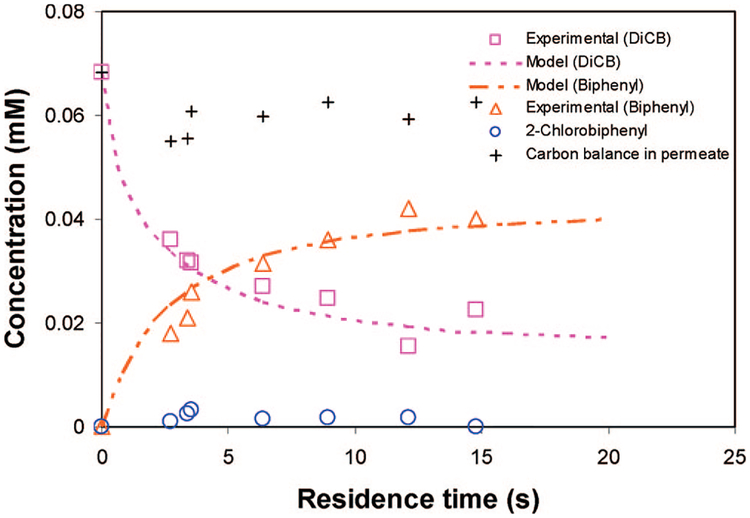
Figure 10 shows the degradation of DiCB as a function of residence time (τ) for the PAA/PVDF membrane reactor containing Fe/Pd nanoparticles under convective flow mode. The membrane had 0.15 g Fe–Pd/cm3 (Pd = 2.3 wt %) of loading evenly in the PAA layer. The membrane area is 13.2 cm−2 and 125 μm thickness. The plots in the figure correlated the model equation with the experimental data to obtain the intrinsic reaction rate. The intrinsic surface area normalized reaction rate (kin) was adjusted to minimize the sum of squares between the model and experimental values. On the basis of the model fitting (R2 = 0.97), kin is determined to be 0.11 L m−2 h−2, which is about 1.6 times higher than that in batch mode (0.068 L m−2 h−1). This value seems reasonable because the rate we obtained in batch mode is the observed reaction rate, which contains both the reaction and mass transfer (diffusion) term. However, the mass transfer and reaction are separate in the convective flow membrane reactor model, which results in the intrinsic reaction rate. As shown in the figure, the concentration of DiCB at the membrane outlet decrease with the increase of the residence time. This is as expected, longer residence means longer reaction time and higher DiCB conversion.
Figure 10.
Degradation of DiCB by membrane-supported Fe/Pd nanoparticles under convective flow mode. Plot of the molar concentration of DiCB, 2-chlorobiphenyl, and biphenyl in the PAA/PVDF membrane reactor outlet at difference residence time. Fe/Pd (Pd = 2.3 wt %) loading in the PAA layer: 0.15 g cm−3.
Figure 10 also plots the experimental data and model prediction for the dechlorination product’s formation (biphenyl and intermediate) at different residence times. Biphenyl was the dominating product, and 2-chlorobiphenyl was detected only in trace levels. Because only trace amounts of 2-chlorobiphenyl were observed, direct formation of biphenyl by replacing two chlorines simultaneously is assumed for the model calculation.
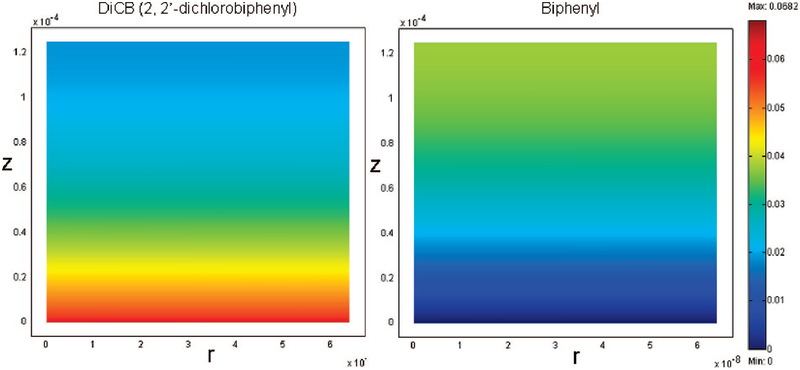
The model equations and boundary conditions for biphenyl are similar to those for the DiCB calculation. The diffusivity for biphenyl is assumed to be same as that for DiCB for simplification. kin is determined to be 0.11 L m−2 h−2 based on the DiCB data fitting. As shown in Figure 10, the biphenyl model prediction matches the experimental data very well. This also verifies the previous model and data fitting. Because the partitioning of PCBs in the membrane, the carbon balance in the permeate solution is about 85%~90%. Figure 11 shows the simulation results of the concentration profile for DiCB degradation and biphenyl formation inside membrane pores at a residence time of 12.1 s.
Figure 11.
Concentration profile for DiCB and biphenyl in the PAA/PVDF membrane reactor at a residence time of 12.1 s (flow rate = 10−5 m s−1).
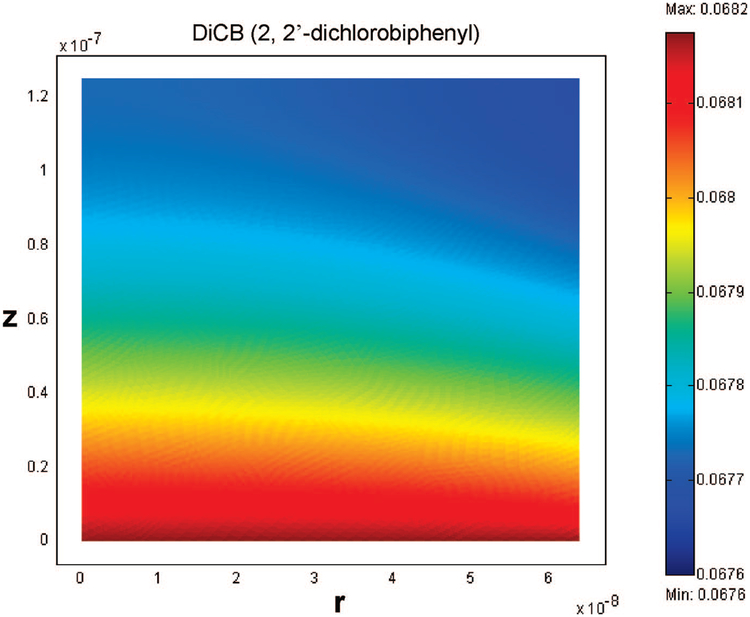
Because of the large ratio of membrane thickness (125 μm) over pore radius (64 nm), radial variation inside the membrane pores is negligible. It is important to point out that Per is determined to be 10−6~10−7, whereas Pez is in the range of 1–25. This also confirms that radial variation can be neglected when Pez ≫ Per. In order to show the radial variation effect, we deliberately decreased the membrane thickness to 125 nm to give the similar Per and Pez. When the thickness is changed to 125 nm (all other parameters are kept the same), the Per is determined to be 2 × 10⁻⁴ ~ 6 × 10⁻³, while Pez is in the range of 1 × 10⁻³ ~ 2.5 × 10⁻². Because the membrane is extremely thin, the DiCB conversion is very low at the low residence time. But the radial effect can be seen clearly in Figure 12.
Figure 12.
Plot of DiCB concentration variance in the radial direction. The membrane thickness was deliberately decreased to 125 nm (Per = 4.4 × 10⁻⁴, Pez = 1.7 × 10⁻³). The flow rate (10−5 m s−1) is the same as that in Figure 11.
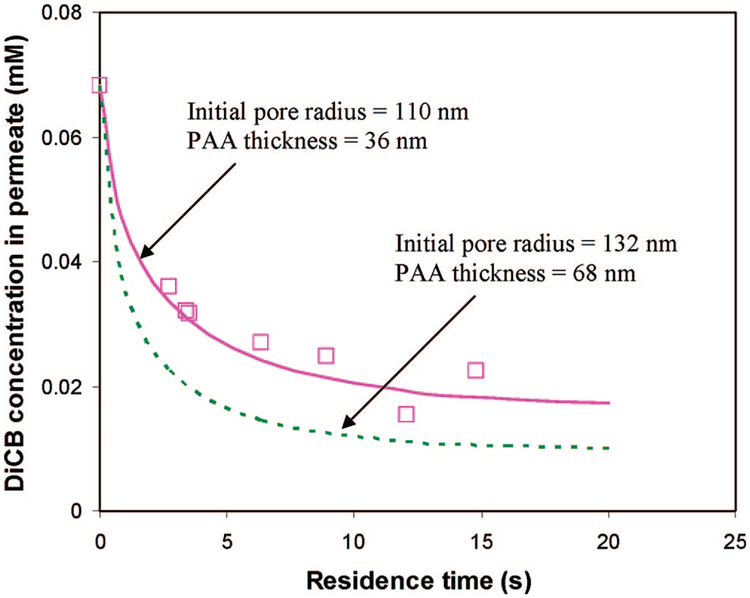
The initial PVDF membrane pore radius of 110 nm was obtained from the manufacturer. The effective pore radius of the membrane after PAA modification was determined to be 64 nm based on the dextran rejection. Previously, the membrane pores were assumed to be uniform and cylindrical for the calculation. However, the actual membrane may not be the case. It is important to study the error of the initial pore deviation in the calculation. The variance of initial pore size could result in the variation of the thickness of the PAA layer and thus affect the results of simulation.
Figure 13 shows the effect of the PAA layer thickness layer variation due to the initial pore radius deviation (+20%). It is assumed that in the simulation the initial pore radius variations only affect the PAA thickness; both of the final pore radii were 64 nm. As shown in the figure, if the initial pore size is increased by 20%, then there is no significant variation caused by this deviation in the modeling results. The error between the model and experimental results is also well matched within the modeling deviation.
Figure 13.
Influence of initial PVDF membrane pore radius on the model prediction. Variation of molar concentration of DiCB in the PAA/PVDF membrane reactor outlet due to the deviation of initial pore size.
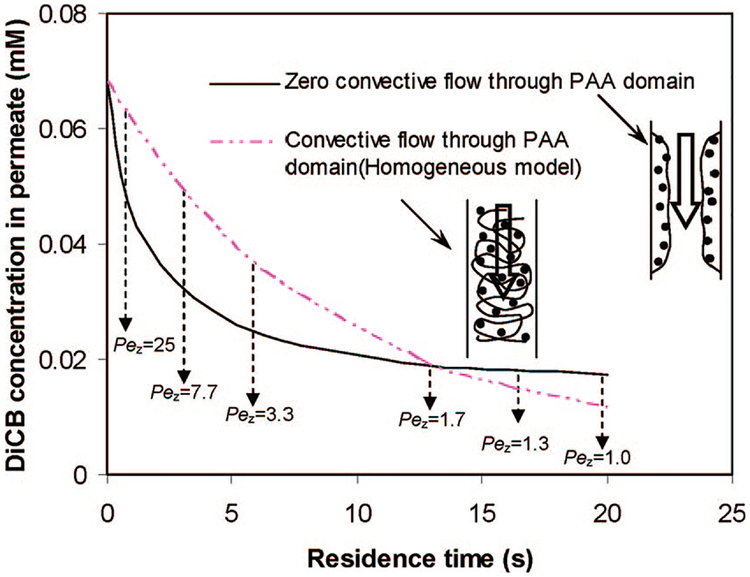
Previously, we assumed that there was no convective flow in the PAA layer for the model development and PCBs can enter into PAA layer only by diffusion. This assumption is reasonable because flow is preferentially through the pores at low operating pressure. However, the actual flow may not be zero although it is much lower than the pore region because PAA is a highly hydrophilic and the PAA layer is not completely dense. In order to study the influence of the flow through the PAA layer, we performed the model calculation based on flow through the PAA layer. In this case, it becomes a homogeneous model where PAA and the membrane pore are not in the separate domain. PAA containing Fe/Pd nanoparticles and membrane pore channel can be considered as one homogeneous domain. One equation including convection, diffusion, and reaction can be used to describe this homogeneous model.
The simulation result for the homogeneous model is shown in Figure 14. The homogeneous model considers 100% convective flow pass through the PAA. The overall residence time is defined by the membrane pore volume/volumetric flux. In the zero flow through PAA domain, the residence time is for flow through pores, but the actual reaction time is the diffusion time in the PAA layer, which is much longer than the overall residence time. However, in the convective flow through PAA mode (homogeneous model), the residence time is the actual reaction time. So, as can be seen in the figure, at high flow rate, the DiCB degradation in convective flow mode is less than zero flow through the PAA mode. This is because the reaction is the rate-controlling step at high flow rate (short reaction time results in less conversion). The insignificant diffusion resistance can be confirmed by the high peclet number (Pez = 3 ~ 25) at high flow rate. But at low flow rate, diffusion becomes the rate-controlling step (low peclet number (Pez < 2) also indicates the high diffusion resistance) and convective flow through PAA shows a higher DiCB conversion rate than zero flow through PAA because of less diffusion resistance. Therefore, although convective flow cannot increase the intrinsic reaction rate, the advantage of applying convective flow is important for the diffusion-limiting (fast reaction) system. The diffusion resistance can be minimized under convective flow to enhance the overall reaction efficiency.
Figure 14.
Modeling comparison for zero flow (diffusion only) and convective flow through the PAA domain.
Influence of Pd Composition.
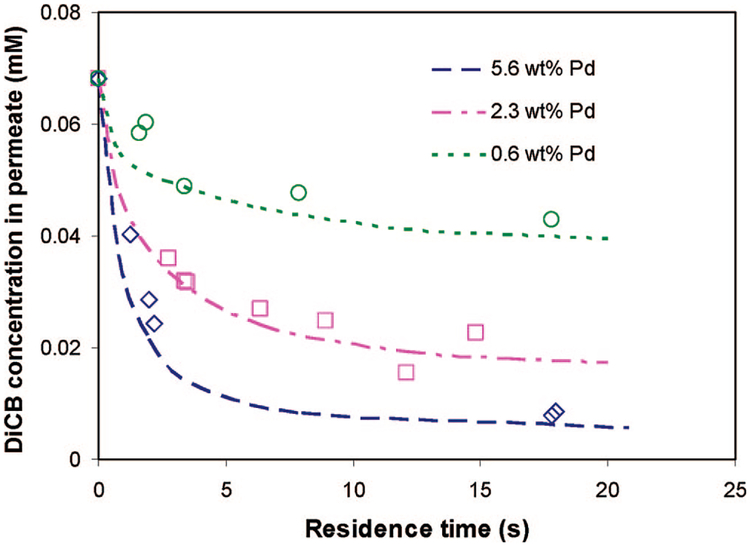
After solving the 2D mass transfer and reaction equation for the membrane reactor, we start to use the model to simulate and predict the reaction under different conditions and parameters. First, we can get a faster reaction by changing the reaction rate. Increasing the nanoparticle loading is the obvious way to obtain a higher reaction rate. Previously, we have studied the effect of three different Pd coating compositions (0.6, 2.3, and 5.6 wt%) on the reactivity of Fe/Pd nanoparticles in batch reactions.17 We found that the surface-normalized reaction rate (kSA) was enhanced with the increase of Pd coating. kSA can be expressed by k2 · Γ, and Γ has been quantified in ref 17. k2 is the same for the three different Pd coating systems, and the increased reaction rate is only due to the increase of Γ (Pd sites). Thus, we can change the reaction rate by changing the Pd coating composition (Γ). By comparing the Γ and kin (Pd = 2.3 wt %), we can easily determine the kin at a Pd coating of 0.6 and 5.6 wt % to be 0.268 and 0.0275 L m−2 h−1, respectively.
Figure 15 shows the modeling and experimental results of DiCB degradation at different Pd coating compositions under convective flow mode. The figure shows a significant increase of DiCB degradation at the higher Pd coating as well as a significant decrease of reaction at the lower Pd coating. About 90% conversion of DiCB was achieved at a residence time of 15 s for the Pd coating composition of 5.6 wt %. Again, biphenyl was the dominating product, and 2-chlorobiphenyl was only detected in trace levels. It can be seen that there is good agreement between the model prediction and experimental data. It is important to point out that the new reaction rate constants at higher Pd loading and lower Pd loading were obtained by the previous correlation between k2 and Γ, not by model fitting. The new rate constants were used to predict the reaction and compare it with the experimental data.
Figure 15.
Modeling and experimental results of the effect of Pd coating composition on the dechlorination under convective flow. Plot of the molar concentration of DiCB in the PAA/PVDF membrane reactor outlet with different Pd coatings at difference residence times. Nanoparticle loading in the PAA layer is the same for different Pd coating systems: 0.15 g cm−3. Note: the symbols represent the experimental data, while the lines represent model prediction.
Influence of Membrane Pore Size.
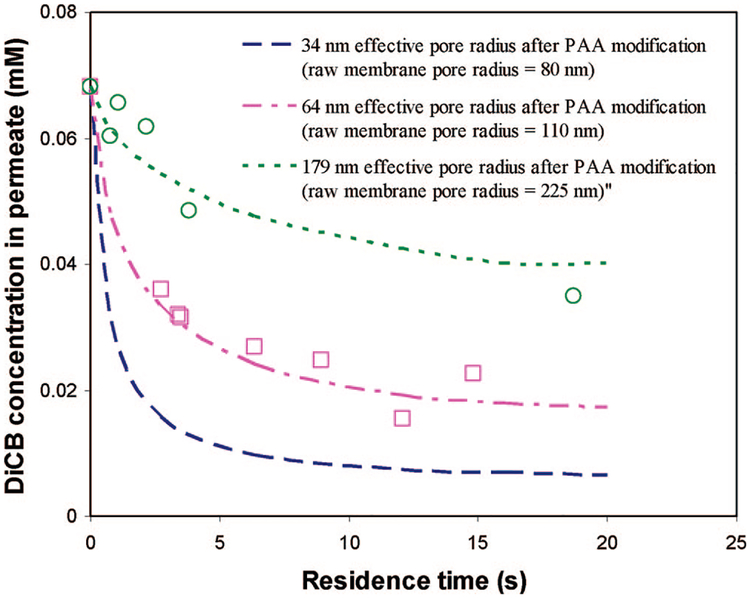
The membrane pore size is another important parameter in the design of the membrane reactor. In theory, the membrane pore size can be varied by either using different pore size support membranes (keeping the same amount of PAA functionalization) or changing the thickness of PAA layer. In this study, different sizes of PVDF support membranes were used to vary the pore size. Figure 16 shows the simulation results of DiCB degradation at different residence times for different membrane pore sizes. The experimental data for the 179-nm membrane pore were also plotted in the figure for comparison with the model prediction. As shown in the figure, there is a good agreement between the model prediction and experimental data, considering the simplification of uniform membrane pore distribution and experimental error. It can be seen that higher DiCB conversion was achieved in narrower membrane pores, whereas the wider membrane pore would result in the lower DiCB conversion. This is due to the larger metal loading per unit pore volume in the narrower membrane pore size even though the metal loading per membrane is kept the same. The narrower pore channel also shortens the DiCB diffusion length and thus benefits the reaction.
Figure 16.
Modeling and experimental results of the effect of membrane pore size on the dechlorination under convective flow. Plot of the molar concentration of DiCB in the PAA/PVDF membrane reactor outlet with different membrane pore sizes at difference residence times. Fe/Pd (Pd = 2.3 wt %) nanoparticle loading in the PAA layer is the same: 0.15 g cm−3. Note: the symbols represent the experimental data, while the lines represent model prediction.
Effect of PCB Diffusivity through Membrane.
The diffusion coefficient (Dm) of PCB in the membrane is determined by the property of the polymer and the degree of cross-linking. Dm is one of the system parameters that affects the PCB dechlorination results. Because PAA has been used as the functional polymer to immobilized bimetallic nanoparticles, Dm is a function of the density of PAA cross-linking. It is known that Dm usually decreases significantly as the cross-linking density increases. The main purpose of this paper is to synthesize bimetallic nanoparticles in the PAA-functionalized membrane and study the catalytic dechlorination reactivity. Although the PAA cross-linking density was not varied by experiment, we still can use the model to simulate the dechlorination reaction at different diffusion coefficients.
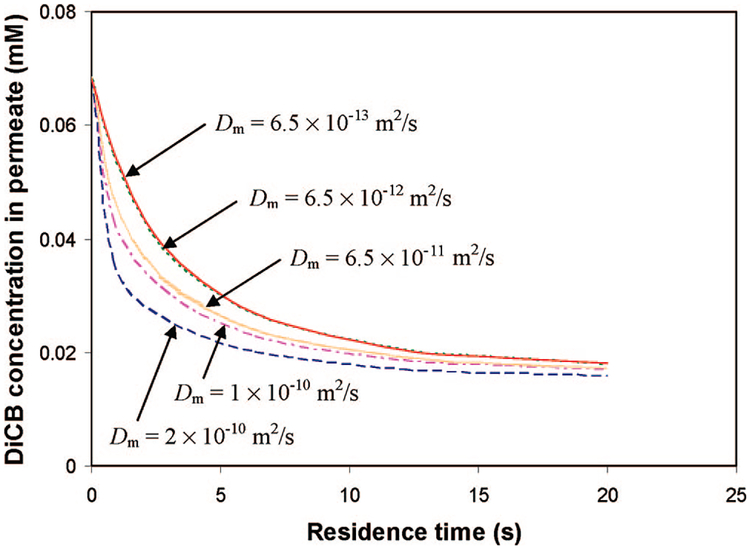
Figure 17 shows the modeling prediction of the effect of the Dm on the DiCB dechlorination under convective flow. Because PCBs must diffuse through the PAA layer before they can be adsorbed and then dechlorinated on the Fe/Pd nanoparticle surface, lower PCB diffusivity results in the higher diffusion resistance and thus decreases the reaction efficiency. As expected, the decrease of diffusivity led to a negative effect on the overall membrane reactor performance. As shown in the figure, when Dm > 6.5 × 10⁻¹² m2 s−1, the effect of Dm is significant whereas when Dm < 6.5 × 10⁻¹² m2 s−1, the effect is much less sensitive to the variation of Dm.
Figure 17.
Effect of DiCB diffusivty through the membrane on the dechlorination under convective flow from the model simulation. Plot of the molar concentration of DiCB in the PVDF/PAA membrane reactor outlet with different DiCB diffusivities in the membrane at difference residence times. Fe/Pd nanoparticle (Pd = 2.3 wt %) loading in the PAA layer is the same: 0.15 g cm−3.
It is important to point out that Dm obtained from E1 is the apparent PCB diffusivity through PAA. The intrinsic PCB diffusion coefficient in PAA is difficult to obtain in the present experimental conditions. PAA is a highly hydrophilic polymer and swells extensively in the aqueous solution. It is reasonable to assume that the PCB diffusivity in PAA is close to that in bulk solution. As shown in the figure, when Dm is 2 orders of magnitude lower than 6.5 × 10⁻¹¹ m2 s−1, the error in simulation is insignificant.
Conclusions
This work has demonstrated successful in situ synthesis of highly reactive core/shell Fe/Pd nanoparticles in the functionalized membrane matrix. The membrane immobilized nano-structured Fe/Pd particles exhibited fast and complete reduction capability toward both selected coplanar and noncoplanar PCBs. We have developed and applied a 2D mathematical model for the PCB degradation by membrane-supported Fe/Pd nanoparticles under convective flow mode. This model incorporates convection, diffusion, and reaction kinetics to describe mass transfer and reaction in the membrane reactor module. In this model, the membrane reactor was characterized by the following four types of parameters: (1) membrane parameters: membrane pore size and porosity and membrane thickness; (2) system parameters: PCB solution density and viscosity, PCB diffusivity, PCB diffusivity, and partitioning coefficient; (3) reaction parameters: nanoparticle surface area, Pd composition (Γ, reactive sites), metal loading, and intrinsic reaction rate constant; and (4) operating parameters: volumetric flux and initial PCB concentration. The intrinsic rate constant (kin) has been determined by fitting the model with the experimental data. kin is the only parameter that was taken as a fitting parameter for model validation and simulation. All other parameters were determined by independent calculations or experiments. We have demonstrated the effects of varying the membrane pore size, the reaction rate constant, and the diffusivity by both the proposed model calculation and performed experiments. A good fitting of the experimental data has been obtained with the modeling simulation results. This model is a useful tool for the prediction and evaluation of chloro-organic degradation at various conditions, and for the optimization of nanoparticle loading. The PCB degradation rate under pressure-driven convective flow conditions benefited form narrow pore size, high intrinsic reaction rate, and high diffusivity.
Acknowledgment.
This study was supported by the NIEHSSBRP program (P42ES007380) and by DOE-KRCEE (DEFG05–03OR23032). We thank Dr. Alan Dozier for the assistance with TEM, STEM EDS, and EELS mapping analysis.
References and Notes
- (1).Zheng N; Stucky GD J. Am. Chem. Soc 2006, 128, 14278–14280. [DOI] [PubMed] [Google Scholar]
- (2).Legrand J-C; Diamy A-M; Riahi G; Randriamanantenasoa Z; Polisset-Thfoin M; Fraissard J Catal. Today 2004, 89, 177–182. [Google Scholar]
- (3).Hussain I; Brust M; Papworth AJ; Cooper AI Langmuir 2003, 19, 4831–4835. [Google Scholar]
- (4).Bhattacharyya D; Hestekin JA; Brushaber P; Cullen L; Bachas LG; Sikdar SK J. Membr. Sci 1998, 141, 121–135. [Google Scholar]
- (5).Ulbricht M; Yang H Chem. Mater 2005, 17, 2622–2631. [Google Scholar]
- (6).Geismann C; Ulbricht M Macromol. Chem. Phys 2005, 206, 268–281. [Google Scholar]
- (7).Hong SU; Bruening ML J. Membr. Sci 2006, 280, 1–5. [Google Scholar]
- (8).Smuleac V; Butterfield D,A; Bhattacharyya D Langmuir 2006, 22, 10118–10124. [DOI] [PubMed] [Google Scholar]
- (9).Hong SU; Miller MD; Bruening ML Ind. Eng. Chem. Res 2006, 45, 6284–6288. [Google Scholar]
- (10).Ritchie SMC; Kissick KE; Bachas LG; Sikdar SK; Parikh C; Bhattacharyya D Environ. Sci. Technol 2001, 35, 3252–3258. [DOI] [PubMed] [Google Scholar]
- (11).Hestekin JA; Bachas LG; Bhattacharyya D Ind. Eng. Chem. Res 2001, 40, 2668–2678. [Google Scholar]
- (12).Avramescu ME; Sager WFC; Wessling MJ Membr. Sci 2003, 216, 177–193. [Google Scholar]
- (13).Shah TN; Ritchie SMC Appl. Catal., A 2005, 296, 12–20. [Google Scholar]
- (14).Kiadambi S; Bruening ML Chem. Mater 2005, 17, 301–307. [Google Scholar]
- (15).Dotzauer DM; Dai J; Sun L; Bruening ML Nano Lett 2006, 6, 2268–2272. [DOI] [PubMed] [Google Scholar]
- (16).Meyer DE; Bhattacharyya DJ Phys. Chem. B 2007, 111, 7142–7154. [DOI] [PubMed] [Google Scholar]
- (17).Xu J; Bhattacharyya D Ind. Eng. Chem. Res 2007, 46, 2348–2359. [Google Scholar]
- (18).Xu J; Bhattacharyya D Environ. Prog 2005, 24, 358–366. [Google Scholar]
- (19).Xu J; Dozier A; Bhattacharyya DJ Nanopart. Res 2005, 7, 449–467. [Google Scholar]
- (20).Zanaroli G; Perez-Jimenez JR; Young LY; Marchetti L; Fava F Biodegradation 2006, 17, 19–27. [DOI] [PubMed] [Google Scholar]
- (21).Nakano Y; Okawa K; Nishijima W; Okada M, Water Res 2003, 37, 2595–2598. [DOI] [PubMed] [Google Scholar]
- (22).Shaub WM; Tsang W Environ. Sci. Technol 1983, 17, 721–730. [DOI] [PubMed] [Google Scholar]
- (23).Chuang F; Larson RA; Wessman MS Environ. Sci. Technol 1995, 29, 2460–2463. [DOI] [PubMed] [Google Scholar]
- (24).Yang C; Nuxoll EE; Cussler EL AIChE J 2001, 47, 295–302. [Google Scholar]
- (25).Wilke CR; Chang P AIChE J 1955, 1, 264. [Google Scholar]
- (26).Ferry JD J. Gen. Physiol 1936, 20, 95–104. [DOI] [PMC free article] [PubMed] [Google Scholar]
- (27).Lindau J; Jönsson; Bottino A J. Membr. Sci 1998, 149, 11–20. [Google Scholar]
- (28).Hagel LJ Chrom. Library 1988, 40, 119–155. [Google Scholar]
- (29).Tu SC; Ravindran V; Den W; Pirbazari M AIChE J 2001, 47, 1346–1362. [Google Scholar]
- (30).Tu SC; Ravindran V; Pirbazari MJ Membr. Sci 2005, 265, 29–50. [Google Scholar]
- (31).Wiley DE; Fell CJD; Fane AG Desalination 1985, 52, 249. [Google Scholar]
- (32).van den Berg GB; Racz IG; Smolders CA J. Membr. Sci 1989, 47, 25. [Google Scholar]
- (33).Rhim JW; Park HB; Lee CS; Jun JH; Kim DS; Lee YM J. Membr. Sci 2004, 238, 143–151. [Google Scholar]
- (34).Ying L; Yu WH; Kang ET; Neoh KG Langmuir 2004, 20, 6032–6040. [DOI] [PubMed] [Google Scholar]
- (35).Moharram MA; Khafagi MG J. Appl. Polym. Sci 2006, 102, 4049–4057. [Google Scholar]
- (36).Noma Y; Ohno M; Sakai S Fresenius Environ. Bull 2003, 12, 302–308. [Google Scholar]
- (37).He F; Zhao D Environ. Sci. Technol 2005, 39, 3314–3320. [DOI] [PubMed] [Google Scholar]
- (38).Lowry GV; Johnson KM Environ. Sci. Technol 2004, 38, 5208–5216. [DOI] [PubMed] [Google Scholar]


