
Figure 1. Properties of the DNAJ-PKAc fusion enzyme.
(A) Structure of the DNAJ-PKAc fusion protein (PDB ID 4WB77). The DNAJ (orange) and PKAc domains (blue) are indicated. (B) Immunoblots of paired tumor and normal adjacent liver from FLC patients probed with antibodies to PKAc (top panels) and actin loading controls (bottom panels). DNAJ-PKAc (upper band) migrates with a slower mobility than the native C subunit in SDS-PAGE. (C–D) Immunofluorescence images of normal liver (left, C) and FLC (right, D) stained with antibodies against PKAc (green), RIIα (red) and DAPI (blue). Scale bar represents 50 μm. (E–F) Phosphoproteomic profiling of FLC. Statistical significance was calculated Significant differences in phosphopeptide expression between experiments were quantified with a two-tailed two sample t-test with unequal variances and Benjamini-Hochberg correction for multiple comparisons was applied (FDR ≤ 0.05), log2 ratio >1. (E) Volcano plot showing phosphosites upregulated (orange) and downregulated (black) in FLC as compared to normal adjacent liver. (F) Pie chart of putative kinase substrates (predicted by NetworKIN) increased in FLC. 82.8% of sites identified were in the NetworKIN platform. Percentages of sites ascribed to particular kinase are listed. ‘Other’ kinases include: CK1, TTK, GRK, RSK, MAK, JNK, ROCK, P70S6K, AMPK, CLK, HIPK2, PDHK, ACTR2, ATM, DMPK, IKK, MOK, NEK4, PKD1, PKG, TGFBR2, and p38-MAPK. (G) Schematic of DNAJ-PKAc in complex with heat shock protein 70 (Hsp70, red). (H) Immunoblot detection of Hsp70 in PKAc immune complexes from FLC and normal adjacent liver lysates (top). Loading controls indicate the levels of Hsp70 (middle) and both forms of PKA (bottom). (I–J) Proximity Ligation (PLA) detection of DNAJ-PKAc/Hsp70 complexes in (I) normal liver and J) FLC sections. Yellow puncta identify Hsp70-kinase sub-complexes, DAPI (blue) marks nuclei. Scale bar represents 20 μm. (K) Amalgamated data (PLA puncta/μm2) from eight normal (black) and 9 FLC (orange) sections. Data are shown as mean ±s.d., p<0.0001 by Student’s t-test (t = 10.98, df = 15).

Figure 1—figure supplement 1. Altered PKA signaling in FLC.

Figure 1—figure supplement 2. Kinase network rewiring in FLC.
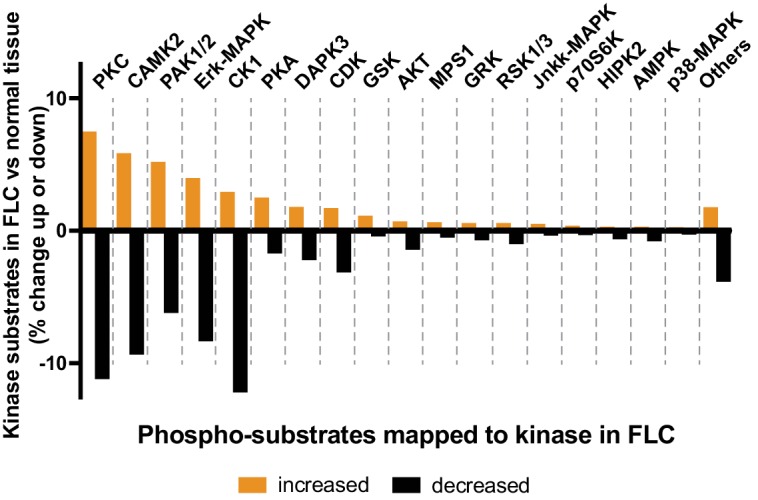
Figure 1—figure supplement 3. Additional Proximity Ligation (PLA) detection of Hsp70 and PKAc in patient tissue.
