. 2019 May 13;8:e41586. doi: 10.7554/eLife.41586

Figure 3. The profile of STP is not determined by the target cell.

(A) Post-hoc reconstruction of 2 recorded MLI using a two-photon microscope. SCs were identified by the absence of neuronal process reaching the PCL (left MLI) and by the absence of cut processes (transection of neuronal processes could be clearly identified by swelling at the tip end portion of processes). At the opposite, BCs were identified by the presence of processes entering in the PCL (right MLI). (B) Circular diagrams of the relative proportion of each category of input (determined by k-means clustering analysis during ten minimal stimulation of GC unitary inputs at 100 Hz) contacting BCs and SCs.

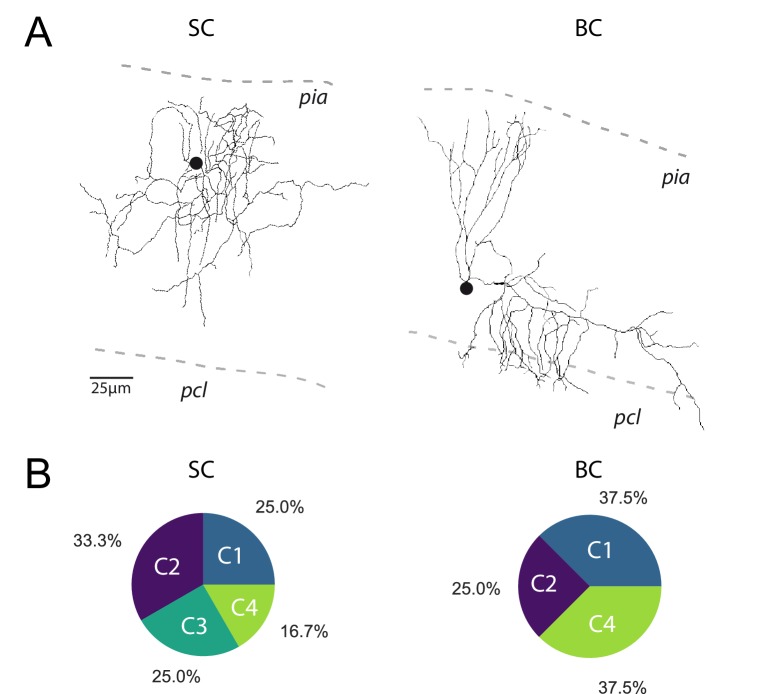
Figure 3.

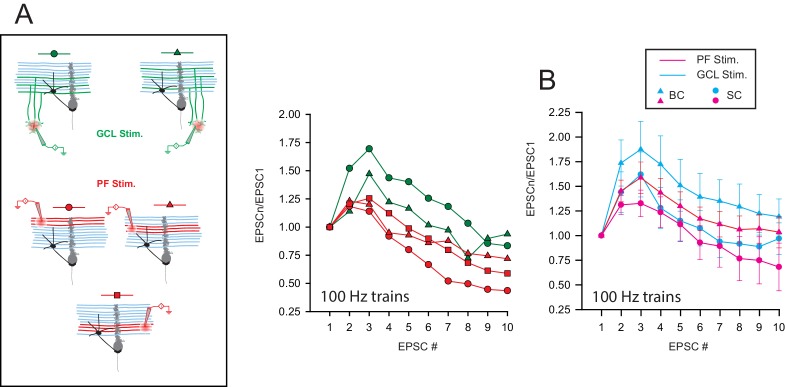
Figure 3—figure supplement 1. STP profile at compound GC-MLI synapses is not determined by the target cell upon.

Figure 3—figure supplement 1.

(A) Right, schematic of the experimental design used to probe STP profiles on a single MLI following compound stimulations of GC-MLI synapses. In this example, synaptic responses in a BC were recorded upon stimulations (10 pulses at 100 Hz) of three different clusters of GCs (stimulation in GCL, green symbols) and two different beams of PFs (red symbols). Left, Corresponding compound EPSC responses recorded in the BC following stimulations of the five different locations showed on the schematic. Depending of the location of the stimulation pipette, compound EPSC responses either facilitated or depressed. (B) Mean EPSC responses recorded in BC (triangles) or in SC (circles) following compound stimulations of beams of PFs (pink triangle for BCs, n = 9 and pink circles for SCs, n = 6) or clusters of GC soma (blue triangles for BCs, n = 11 and blue circles for SCs, n = 9).
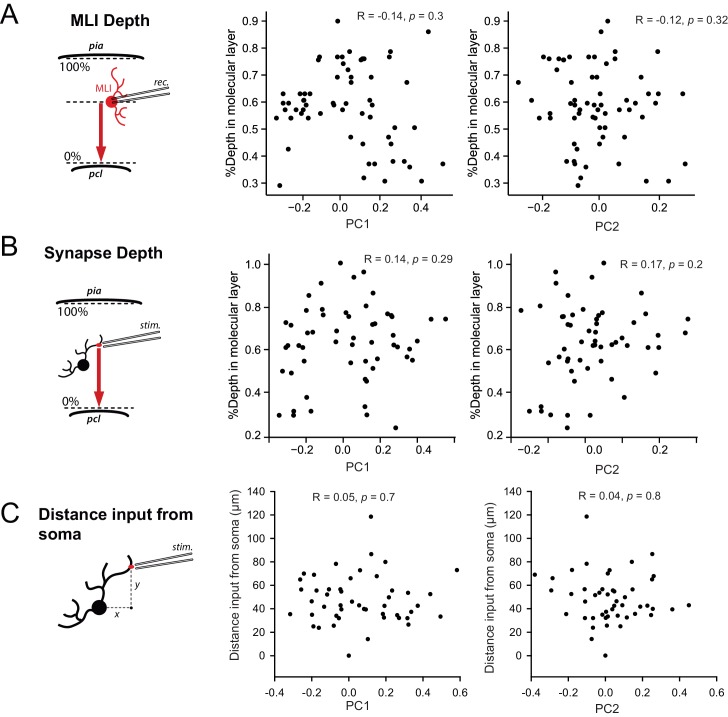
Figure 3—figure supplement 2. STP is not determined by the position of MLI in the molecular layer or by the position of inputs in MLI dendritic trees.

Figure 3—figure supplement 2.

(A) Left panel, schematic showing how the relative depth of cell’s soma in the molecular layer was measured. Right panels, scatter plots showing the lack of correlation between PC1 or PC2 with the relative depth of cell’s soma for all recorded MLIs. (B) Left panel, schematic showing how the relative depth of stimulated inputs in the molecular layer was measured. Right panels, scatter plots showing the lack of correlation between PC1 or PC2 with the relative depth of inputs. (C) Left panel, schematic showing how the distance of stimulated inputs from MLI soma was measured. Right panels, scatter plots showing the lack of correlation between PC1 with distance of stimulated inputs from the soma.