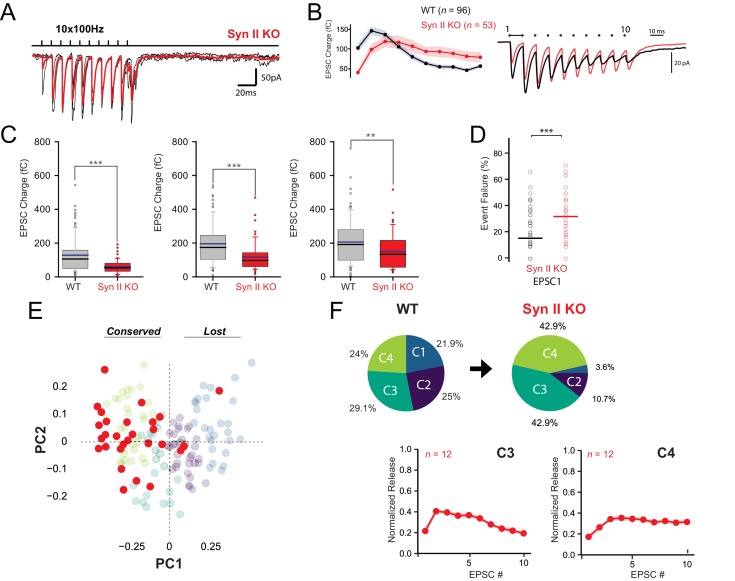
Figure 5. Genetic deletion of Syn II induces a partial loss of functional variability at GC-MLI synapses.
(A) Representative traces of EPSCs from 10 successive trains at 100 Hz recorded at unitary GC-MLI synapse from Syn II KO mice (black traces). Averaged trace is in red. Unitary synapses were stimulated using minimal electrical stimulation. (B) left, Mean values of EPSC1, charges elicited by train of stimulation at 100 Hz recorded in WT and Syn II KO mice (grey and red points, respectively). Right, Corresponding traces recorded during these 100 Hz train in WT mice (black trace, mean trace from 102 recordings) and in Syn II KO mice (red trace, averaging from 33 recordings). The mean EPSC charges of the first responses was strongly reduced in Syn II KO mice (mean EPSC1 charge for WT: 128.11 fC ± 10.51 fC, n = 96, mean EPSC1 charge for Syn II KO mice: 60.03 fC ± 5.55 fC, n = 53, p<0.001, MWRST). (C) Box plots showing the values of EPSC charges at the first, second and third stimulus of 100 Hz train (left, middle and right graph respectively) in WT and Syn II KO mice. (D) Box plots showing the number of failures at the first stimulus in WT and Syn II KO mice. The percentage of failures at the first stimuli was increased in Syn II KO mice (mean failure rate EPSC1 in WT: 15.6% ± 1.6, Syn II KO mice: 32.3% ± 3.8). (E) Scatter plot of PCA1 and PCA2 obtained by analyzing EPSC properties during 100 Hz train in WT mice (gray point, same dataset as in Figure 2A) and Syn II KO mice (red points). (F) Pie chart of k-means clustering analysis clusters obtained in WT (same dataset than in Figure 2C) and Syn II KO mice. Note the near complete disappearance of C1 and C2 connections in Syn II KO mice. The profiles of EPSC charges during 100 Hz train for C3 and C4 connections were identical between WT and Syn II KO mice (bottom graphs), indicating that the genetic deletion of Syn II did not impair the functioning of these two classes of GC-MLI synapses.

