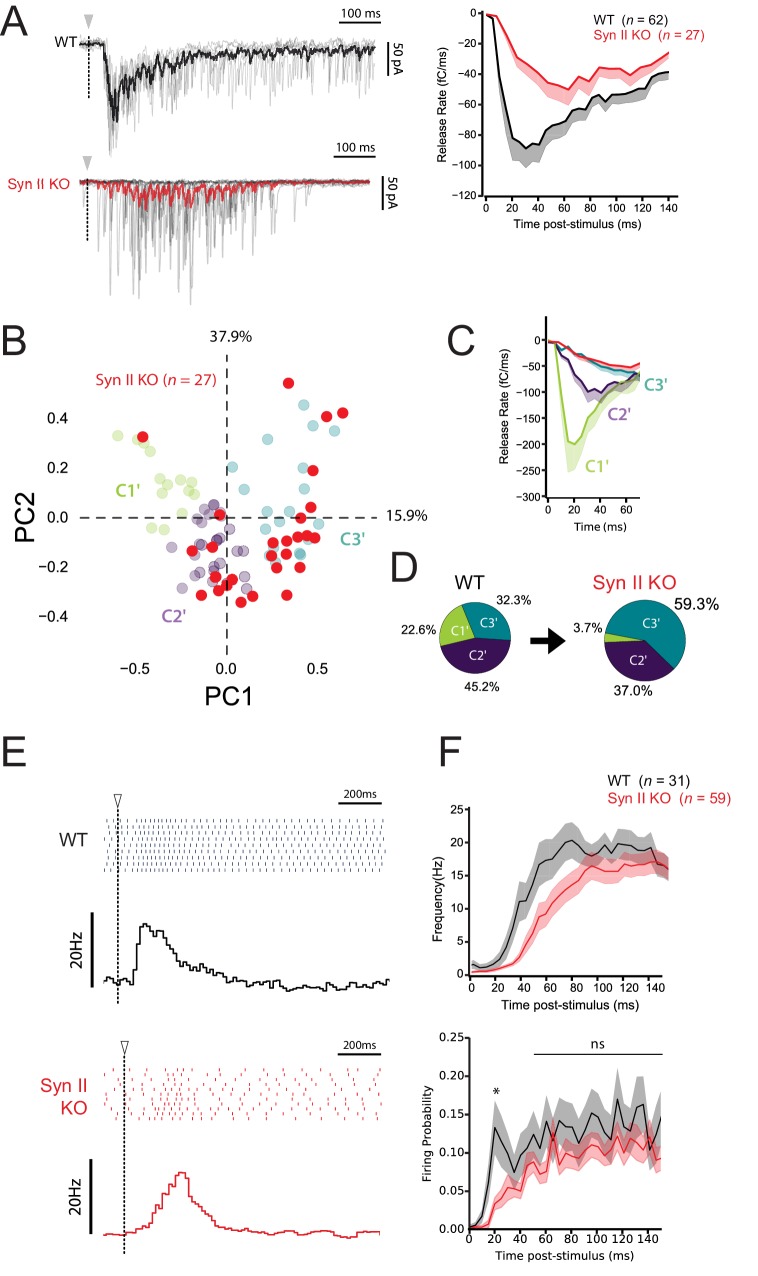
Figure 8. Synapse-specific expression of Syn II diversifies the profile of excitatory drives on MLIs and expands the coding range of MLIs.
(A) Left panels, representative traces of superimposed EPSCs recorded in WT and Syn II KO mice after photostimulations in the GCL (same experimental design than in Figure 7A). Right panel, averaged values of EPSC charges versus the time following photorelease of RuBi-glutamate recorded in WT and Syn II KO mice (black and red traces respectively). Note the strong reduction in the peak of charge in Syn II KO mice. (B) PCA transformation of EPSC properties obtained in WT (green, purple and blue points, same dataset than in Figure 7B) and Syn II KO mice (red points). (C) Line plots display the normalized release time course from GC-MLI synapses belonging to clusters C1’, C2’, C3’ (WT mice, same color code as in B) and GC-MLI synapses from Syn II KO mice (red line). (D) The pie chart shows a partial reduction of STP heterogeneity in Syn II KO condition with a strong reduction of phasic profiles (C1’). (E) Typical raster plots and peristimulus time histogram obtained in WT and Syn II KO mice following photostimulation of unitary GC-MLI synapses. The onsets of photostimulation are represented with white arrowheads and dashed lines. (F) Means values of the firing frequency (upper graph) and the firing probability (lower graph) of MLIs following photostimulation of unitary GC-MLI synapses in WT and Syn II KO mice (black and red lines, respectively).

