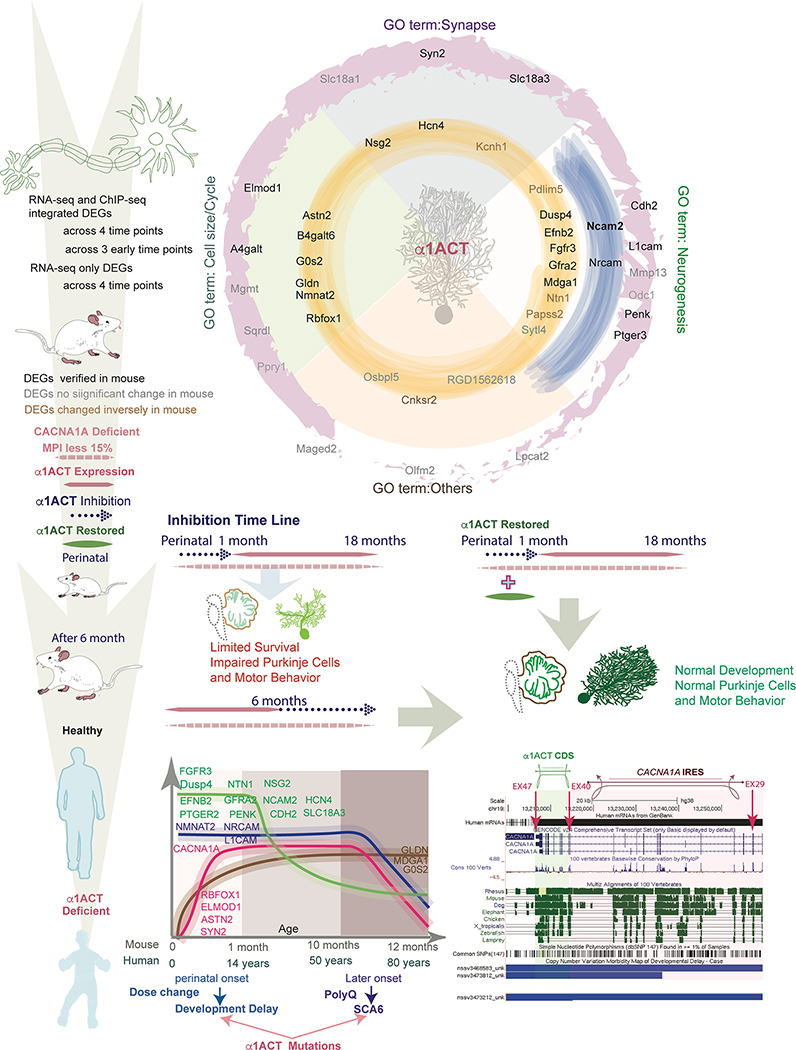
Figure 7. Summary of α1ACT-regulated DEGs temporal expression profile from pc12 cells to mouse and human cerebellum.
Top. Graphical representation of α1ACT DEGs with associated GO terms. RNA-seq only DEGs across 4 time points (outer ring, pink), RNA-seq and ChIP-seq integrated DEGs across 3 early time points (middle ring, blue) and 4 time points (inner ring, yellow) were divided into four GO term categories: Synapse, Cell Size/Cycle, Neurogenesis, Other. DEG gene names are labeled according to persistence across time points and whether they were verified in mice. Bottom. Left. Temporal expression pattern of persistent DEGs in mice and humans. Four general patterns of expression: high early expression with exponential decrease, stable middle expression with decrease, initial increase with plateau and subsequent decrease later in life, and initial increase with stable middle plateau. Right. Graphic of portion of CACNA1A cDNA showing location of α1ACT coding region and the CACNA1A IRES. The locations of several large CACNA1A deletions associated with developmental delay are depicted below.

