

Summary
Norepinephrine (NE) is a key biogenic monoamine neurotransmitter involved in a wide range of physiological processes. However, its precise dynamics and regulation remain poorly characterized, in part due to limitations of available techniques for measuring NE in vivo. Here, we developed a family of GPCR Activation-Based NE (GRABNE) sensors with a 230% peak ΔF/F0 response to NE, good photostability, nanomolar-to-micromolar sensitivities, sub-second kinetics, and high specificity. Viral- or transgenic- mediated expression of GRABNE sensors were able to detect electrical stimulation-evoked NE release in the locus coeruleus (LC) of mouse brain slices, looming-evoked NE release in the midbrain of live zebrafish, as well as optogenetically and behaviorally triggered NE release in the LC and hypothalamus of freely moving mice. Thus, GRABNE sensors are robust tools for rapid and specific monitoring of in vivo NE transmission in both physiological and pathological processes.
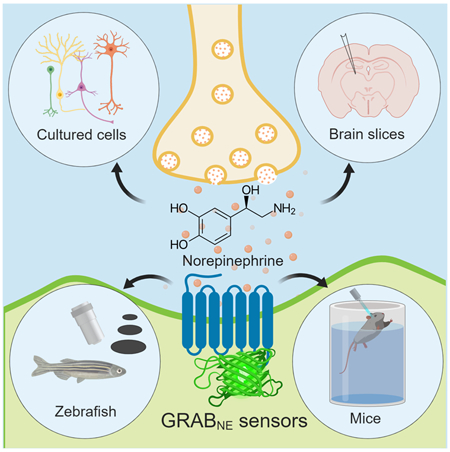
Graphical Abstract
Introduction
Norepinephrine (NE) is a key monoamine neurotransmitter in the central nervous systems and peripheral organs of vertebrate organisms. It plays important roles in a plethora of physiological processes, allowing the organism to cope with its ever-changing internal and external environments. In the brain, NE is synthesized primarily in neurons of the locus coeruleus (LC), a small yet powerful nucleus located in the pons. Noradrenergic LC neurons project throughout the brain and exert a wide range of effects, including processing sensory information (Berridge and Waterhouse, 2003), regulating the sleep-wake/arousal state (Berridge et al., 2012), and mediating attentional function (Bast et al., 2018). Blocking noradrenergic transmission causes impaired cognition and arousal and is closely correlated with a variety of psychiatric conditions and neurodegenerative diseases, including stress (Chrousos, 2009), anxiety (Goddard et al., 2010), depression (Moret and Briley, 2011), attention-deficit hyperactivity disorder (ADHD) (Berridge and Spencer, 2016), and Parkinson's disease (PD) (Espay et al., 2014). In the sympathetic nervous system, NE plays critical roles such as regulating heart function (Brodde et al., 2001) and blood pressure (Zimmerman, 1981).
Despite its clear importance in a wide range of physiological processes, the spatial and temporal dynamics of NE in complex organs (e.g. the vertebrate brain) are poorly understood at the in vivo level due to limitations associated with current detection methods. Classic detection methods such as microdialysis-coupled biochemical analysis (Bito et al., 1966; Justice, 1993; Watson et al., 2006) have low temporal resolution (typically 5 min/collection) and complex sampling procedures, limiting the ability to accurately measure the dynamics of noradrenergic activity in the physiological state (Cheferet al., 2009). Recent improvements in microdialysis—in particular, the introduction of the nano-LC-microdialysis method (Lee et al., 2008; Olive et al., 2000)—have significantly increased detection sensitivity; however, the sampling rate is still on the order of minutes. Electrochemical detection techniques including fast-scan cyclic voltammetry (FSCV) based on measuring currents generated by the oxidation of NE (Bruns, 2004; Park et al., 2009; Robinson et al., 2008; Zhou and Misler, 1995) provide nanomolar sensitivity and millisecond temporal resolution; however, their inability to distinguish NE from other monoamine neurotransmitters—particularly dopamine (Robinson et al., 2003)—presents a significant physiological limitation for measuring noradrenergic transmission both in ex vivo tissue preparations and in vivo. Both microdialysis-based and electrochemical techniques detect volume-averaged NE levels in the extracellular fluid and therefore cannot provide cell type–specific orsubcellular information.
Real-time imaging of NE dynamics would provide an ideal means to non-invasively track NE with high spatiotemporal resolution. A recent innovation in real-time imaging, the cell-based reporters known as CNiFERs (Muller et al., 2014), convert an extracellular NE signal into an intracellular calcium signal that can be measured using fluorescence imaging. However, CNiFERs require implantation of exogenous tumor cell lines and can report only volume transmission of NE. By contrast, genetically encoded sensors could, in theory, circumvent the above-mentioned limitations to provide fast, clear, non-invasive, and cell type–specific reporting of NE dynamics. In practice, genetically encoded NE sensors developed to date either have poor signal-to-noise ratio and narrow dynamic range (e.g., a <10% change in FRET ratio under optimal conditions) or lack in vivo characterization (Nakanishi et al., 2006; Patriarchi et al., 2018; Vilardaga et al., 2003; Wang et al., 2018b), thus limiting their applicability in vivo.
To overcome these limitations, we developed a series of genetically encoded single-wavelength fluorescent GRABNE sensors with rapid kinetics, a ΔF/F0 dynamic range of ~200%, and EGFP-comparable spectra, brightness, and photostability. Here, we showcase the wide applicability of our GRABNE sensors using a number of in vitro and in vivo preparations. In every application tested, the GRABNE sensors readily reported robust, and chemical-specific NE signals. Thus, our GRABNE sensors provide a powerful imaging-based probe for measuring the cell-specific regulation of noradrenergic transmission under a wide range of physiological and pathological conditions.
Results
Development and characterization of GRABNE sensors
Inspired by the structure (Rasmussen et al., 2011a; Rasmussen et al., 2011b) and working mechanism (Chung et al., 2011; Manglik et al., 2015; Nygaard et al., 2013) of the β2 adrenergic G protein–coupled receptor (GPCR), we exploited the conformational change between the fifth and sixth transmembrane domains (TM5 and TM6, respectively) upon ligand binding to modulate the brightness of an attached fluorescent protein. Building upon the successful strategy of generating GPCR activation-based sensors for acetylcholine (GACh) (Jing et al., 2018) and dopamine (dLight and GRABDA) (Patriarchi et al., 2018; Sun et al., 2018), we first screened human adrenergic receptors for a potential scaffold. We inserted circular permutated EGFP (cpEGFP) into the third intracellular loop domain (ICL3) of three α-adrenergic receptors (α1DR, α2AR, and α2BR) and two β-adrenergic receptors β2R and β3R) (Fig. 1A). Among these five constructs, α2AR-cpEGFP had the best membrane trafficking, indicated by its high colocalization ratio with membrane-targeted RFP (Fig. S1); we therefore selected this receptor as the scaffold for further development.
Figure 1. Design and optimization of genetically encoded NE sensors. See also Figure S1.

(A) Selection of a candidate sensor scaffold by screening several NE-binding GPCRs. Shown at the right are example images of the indicated chimeric GPCR-cpEGFP candidates expressed in HEK293T cells. Yellow arrows indicate robust membrane trafficking, and red arrows indicate impaired membrane trafficking. See also Fig. S1.
(B) Identification of the most responsive NE sensor, NE0.5m (indicated by the black square) by screening the cpEGFP insertion site in ICL3 of the α2AR. ΔF/F0 refers to the peak change in fluorescence intensity in response to 100 μM NE.
(C) Optimizing the GRABNE sensors by mutational screening of the insertion linker. NE0.5m was used as a template, and the indicated amino acids on N-terminal and C-terminal sides of the cpEGFP insert were mutated individually. Sensor GRABNE1m (indicated by the pink squares) was identified due to having the strongest response (ΔF/F0) and brightness relative to the original NE0.5m sensor (indicated by the dashed line at 1.0).
(D) Tuning the sensor’s affinity for NE by introducing mutations in the GPCR. Magnified views of the ligand-binding pocket view from the cytosol are shown; key residues involved in ligand binding and inducing a conformational change upon ligand binding are indicated. The middle panel shows example images of HEK293T cells expressing the indicated GRABNE sensors; EGFP fluorescence is shown in the left column, and the fluorescence response in the presence of 100 μM NE is shown in the right column. Shown at the right are the normalized dose-response curves for the three GRABNE sensors, with C50 values (top), and the average fluorescence change in response to 100 μM NE (bottom); n = 21-67 cells from 3-5 cultures for each sensor.
The scale bars in (A) and (D) represent 10 μm.
Unless noted, values with error bars indicate mean ± SEM.
***p < 0.001 (Student’s t-test).
The length and amino acid composition of the linkers surrounding the cpEGFP moiety inserted in G-GECO (Zhao et al., 2011), GCaMP (Akerboom et al., 2012), GACh (Jing et al., 2018), and GRABDA (Sun et al., 2018) affects the fluorescence response of cpEGFP-based indicators. Thus, we systematically truncated the linker which starts with the entire flexible ICL3 of α2AR surrounding cpEGFP (Fig. 1B). We initially screened 275 linker-length variant proteins and identified a sensor (GRABNE0.5m) truncated at the S295 and R360 sites of α2AR with a modest response to NE (Fig. 1B, right). From this prototype, we screened random mutations of seven amino acids close to the cpEGFP moiety; two (GG) on the N-terminal and five (GGAAA) on the C-terminal side of cpEGFP (Fig. 1C). Among approximately 200 mutant candidates generated from GRABNE0.5m, we found GRABNE1m, which contains a glycine-to-threonine mutation at position C1, and exhibited the best performance with respect to ΔF/F0and brightness (Fig. 1C, middle and right). We hypothesize that GRABNE shares a similar mechanism of fluorescence modulation as GCaMP sensors (Akerboom et al., 2012; Akerboom et al., 2009). Namely, ligand binding induces a conformational change of the binding protein (i.e. CaM in GCaMP) which alters the chemical environment, causing de-protonation of the cpEGFP chromophore and the resulting increase in fluorescence.
We expressed GRABNE1m in HEK293T cells and applied NE at different concentrations. NE induced a fluorescence change in GRABNE1m-expressing cells in a dose-dependent manner, with an EC50 of 930 nM and a maximum ΔF/F0 of approximately 230% in response to a saturating concentration of NE (100 μM) (Fig. 1D, middle and right). We also introduced mutations in α2AR in order to increase its NE detection sensitivity. We found that a single T6.34K point mutation (Ren et al., 1993)—which is close to the highly conserved E6.30 site—resulted in a 10-fold increase in sensitivity (EC50 ~83 nM) to NE compared with GRABNE1m. This sensor, which we call GRABNE1h (following the naming convention of GRABDA (Sun et al., 2018)—“m” means medium and “h” means high affinity), had a maximum ΔF/F0 of ~130% in response to 100 μM NE. As a control, we also generated GRABNEmut, which has the mutation S5.46A at the putative ligand-binding pocket and therefore is unable to bind NE (Fig. 1D); this control sensor has similar brightness and membrane trafficking (Figs. S1 and S2A), but does not respond to NE even at 100 μM (Fig. 1D, middle and right).
We examined whether our GRABNE sensors can capture the rapid dynamic properties of NE signaling, including its release, recycling, and degradation. We bathed GRABNE1h-expressing HEK293T cells in a solution containing NPEC-caged NE. A focused spot of 405-nm light was applied to locally uncage NE by photolysis (Fig. 2A). Transient photolysis induced a robust increase in fluorescence in GRABNE1h-expressing cells (mean on time constant 137 ms, single exponential fit), which was blocked by application of the α2-adrenergic receptor antagonist yohimbine (Figs. 2B,C). To characterize both the on and off rates (τon and τoff, respectively) of the GRABNE sensors, we locally and subsequentlly applied NE and yohimbine to GRABNE-expressing cells using rapid perfusion and measured the fluorescence response using high-speed line scanning (Figs. 2D,E). The average delay of the perfusion system itself (measured by fitting the fluorescence increase in the co-applied red fluorescent dye Alexa 568) was 34 ms (Fig. 2F). Fitting the fluorescence change in each sensor with a single exponential function yielded an average τon of 72 and 36 ms for GRABNE1m and GRABNE1h, respectively, and an average τoff of 680 and 1890 ms for GRABNE1m and GRABNE1h, respectively (Figs. 2E,F). The faster on-rate and slower off-rate of GRABNE1h compared to GRABNE1m are consistent with its relatively higher affinity for NE.
Figure 2. Characterization of GRABNE sensors in cultured cells. See also Figure S2.

(A-C) HEK293T cells were loaded with NPEC-NE, which was uncaged by photolysis with a pulse of 405-nm light. Uncaging caused a rapid increase in GRABNE1h fluorescence, which was blocked in the presence of 10 μM yohimbine (YO). The data in B represent 3 trials each, and the data in C represent 7 cells from 3 cultures. The white dotted square indicates the image region and the purple square indicates the illumination region.
(D-F) NE was applied to HEK293T cells expressing GRABNE1m or GRABNE1h to measure Ton. Yohimbine (YO) was then applied in order to measure Toff; The white dotted line indicates the line-scanning region. n ≥ 6 cells from 6 cultures.
(G) The indicated compounds were applied to GRABNE1m and GRABNE1h, and the change in fluorescence relative to NE is plotted.
(H)Dose-response curves for GRABNE1m, GRABNE1h, and wild-type α2AR for NE and DA, with EC50 values shown; n ≥ 3 wells with 100-300 cells each.
(I) Fast-scan cyclic voltammetry measurements in response to increasing concentrations of NE and DA. The insets show exemplar cyclic voltammograms of NE and DA at 100 μM, with peak current occurring at ~0.6 V.
(J) Time course of ΔF/F0 for GRABNE sensors measured over a 2-h time frame; note that the fluorescent signal remained at the cell surface even after 180 min, indicating no measurable internalization or desensitization, n = 2 wells with 100-300 cells each.
(K) A TANGO assay was performed in order to measure β-arrestinμmediated signaling by GRABNE1m, GRABNE1h, and wild-type α2AR in the presence of increasing concentrations of NE; n = 4 wells with ≥105 cells each.
(L,M) GRABNE sensors do not couple to downstream G protein signaling pathways. Wild-type α2AR, but not GRABNE1m or GRABNE1h, drives Gμi signaling measured using a luciferase complementation assay (L). Disrupting of G protein activation with pertussis toxin does not affect the NE-induced fluorescence change in GRABNE1m or GRABNE1h (M). n = 3 wells with ≥105 cells each.
The scale bars in (A), (D), and (J) represent 10 μm.
*p < 0.05, **p < 0.01, and ***p < 0.001; n.s., not significant (Student’s t-test).
High ligand specificity is an essential requirement for tools designed to detect structurally similar monoamine-based molecules. Importantly, our GRABNE sensors, based on α2AR, responded to both NE and epinephrine (Epi), but not other neurotransmitters around physiological concentrations (Fig. 2G). The sensors also responded to the α2AR agonist brimonidine but not the β2-adrenergic receptor agonist isoprenaline, indicating receptor-subtype specificity. Moreover, the NE-induced fluorescence increase in GRABNE-expressing cells was blocked by the α-adrenergic receptor antagonist yohimbine, but not the β-adrenergic receptor antagonist ICI 118,551. Because NE and DA are structurally similar yet functionally distinct, we characterized how our GRABNE sensors respond to various concentrations of DA and NE. Wild-type α2AR has an 85-fold higher affinity for NE versus DA (Fig. 2H, right). Our GRABs bracketed this selectivity, with GRABNE1m at 350-fold higher affinity for NE, whereas GRABNE1h had a 37-fold higher affinity for NE (Fig. 2H). In contrast, FSCV was unable to differentiate between NE and DA, producing nearly identical responses to similar concentrations of NE and DA (Fig. 2I, S2D) (Robinson et al., 2003). To test photostability, we continuously illuminated GRABNE-expressing HEK293T cells using either 1-photon (confocal) or 2-photon laser microscopy and found that GRABNE sensors were more photostable than EGFP under both conditions (Fig. S2C). Taken together, these data suggest that the GRABNE sensors can be used to measure the dynamic properties of noradrenergic activity with high specificity for NE over other neurotransmitters.
Next, we examined whether our GRABNE sensors trigger GPCR-mediated downstream signaling pathways. Bathing GRABNE1m-expressing cells in a saturating concentration of NE for 2 h resulted in no internalization of GRABNE1m (Fig. 2J). Consistent with this, both GRABNE1mand GRABNE1h induced little β-arrestin–mediated signaling in a TANGO assay, even at the highest concentration of NE tested (Fig. 2K), suggesting no coupling to β-arrestin signaling. In addition, GRABNE1m and GRABNE1h had drastically reduced downstream Gi coupling compared to wild-type α2AR, which was measured using a Gi-coupling–dependent luciferase complementation assay (Fig. 2L) (Wan et al., 2018). We also found that G protein activation by GRABNE1m measured by the highly sensitive TGFα shedding assay was reduced by about 100-fold compared to the wild-type receptor α2AR (Fig. S2B) (Inoue et al., 2012). Finally, blocking G protein activation by treating cells with pertussis toxin (Fig. 2M) had no effect on the fluorescence response of either GRABNE1m or GRABNE1h, indicating that the fluorescence response of GRABNE sensors did not require G protein coupling (Rasmussen et al., 2011a). Taken together, these data indicate that GRABNE sensors can be used to report NE dynamics without inadvertently engaging GPCR downstream signaling.
Characterization of GRABNE sensors in cultured neurons
The expression, trafficking, and response of proteins can differ considerably between neurons and cell lines (Marvin et al., 2013; Zou et al., 2014). To characterize the performance of GRABNE sensors in neurons, we co-expressed GRABNE together with several neuronal markers in cultured cortical neurons. Both GRABNE1m and GRABNEmut trafficked to the cell membrane and co-localized with the membrane-targeted marker RFP-CAAX (Figs. 3A,B). Upon bath-application of a saturating concentration of NE, GRABNE1m and GRABNE1h had a peak ΔF/F0 of approximately 230% and 150%, respectively, whereas GRABNEmut had no response (Figs. 3D,E), similar to our results obtained with HEK293T cells. Moreover, the NE-induced responses in GRABNE1m-expressing cells were similar among various subcellular compartments identified by co-expressing GRABNE1m with either the axonal marker synaptophysin (SYP) or the dendritic marker PSD95, suggesting that GRABNE sensors enabled the detection of NE throughout the neurons (Fig. 3C). Both GRABNE1m- and GRABNE1h-expressing neurons had a dose-dependent fluorescence increase in response to NE, with mean EC50 values of 1.9 μM and 93 nM, respectively (Fig. 3F). Consistent with high selectivity for NE, GRABNE1m and GRABNE1h had a 1000-fold and 7-fold higher affinity, respectively, for NE versus DA (Fig. 3F). Moreover, GRABNEim responded specifically to NE and Epi, but not to several other neurotransmitters and ligands, including isoprenaline, histamine, dopamine, and serotonin (Fig. 3G). Similar to our results in HEK293T cells, inhibiting G protein activation with pertussis toxin did not affect the NE-induced fluorescence change in GRABNE1m in cultured neurons (Fig. S2E), suggesting G protein coupling was not involved in the fluorescence change of GRABNE1m. Finally, bathing GRABNE1m-expressing neurons in 100 μM NE for two hours did not cause detectable internalization of the sensor. The fluorescence increase was stable for the entire period and blocked completely by yohimbine (Figs. 3H,I). Thus, our GRABNE sensors have the necessary affinity and specificity to faithfully measure noradrenergic signaling in neurons.
Figure 3. Characterization of GRABNE sensors in cultured neurons. See also Figure S2.

(A-C) GRABNE1m is expressed in various plasma membrane compartment of cultured neurons. Cultured cortical neurons were co-transfected with GRABNE1m and RFP-CAAX to label the plasma membrane, and the fluorescence response induced by bath application of NE was measured in the cell body, dendritic shaft and spine, and axon (C). n > 10 neurons from 4 cultures.
(D,E) Cultured cortical neurons expressing GRABNE1m and GRABNE1h, but not GRABNEmut, respond to application of NE (10 μM). EGFP fluorescence and pseudocolor images depicting the response to NE are shown in (D), and the time course and summary of peak ΔF/F0 are shown in (E). n > 15 neurons from 3 cultures.
(F) Dose-response curve for GRABNE sensors expressed in cultured cortical neurons in response to NE and DA. n > 10 neurons from 3 cultures.
(G) Example trace (top) and summary (bottom) of cultured neurons transfected with GRABNE1m and treated with the indicated compounds at 10 μM each. n = 9 neurons from 3 cultures.
(H,I) The fluorescence change in GRABNE1m induced by 100 μM NE is stable for up to 2 h. Representative images taken at the indicated times are shown in (H). An example trace and summary data are shown in (I). Where indicated, 10 μM yohimbine (YO) was added. n = 5 neurons from 3 cultures.
The scale bars in (A), (B) and (H) represent 10 μm; the scale bars in (D) represents 25 μm.
***p < 0.001; n.s., not significant (Student’s t-test).
Characterization of GRABNE sensors in both cultured and acute brain slices
To further test the performance of GRABNE sensors in vitro, we expressed GRABNE1m and GRABNE1h in cultured hippocampal slices using a Sindbis virus expression system (Fig. S3A). In both GRABNE1m- and GRABNE1h-expressing CA1 neurons, exogenous application of NE in ACSF—but not ACSF alone—evoked a robust increase in fluorescence (Figs. S3B-D). In contrast, NE had no detectable effect on GRABNEmurexpressing neurons (Figs. S3C,D). Application of several α-adrenergic receptor agonists, including epinephrine and brimonidine, also generated fluorescence increases in GRABNE1m-expressing neurons (Figs. S3C,F), consistent with data in cultured cells. The rise and decay kinetics of the change in fluorescence were second-order, which reflects the integration of the time required to puff the drugs onto the cells and the sensor’s response kinetics (Figs. S3E,G). To test whether overexpression of NE sensors may affect endogenous NE receptors, we made simultaneous dual patch-clamp recordings and fluorescence imaging from pairs of neighboring GRABNE1m-expressing and control non-expressing CA1 neurons (Fig. S3H). Brief 10-ms NE puff applications evoked a large outward current in GRABNE1m-expressing and non-expressing neurons, as well as a concurrent fluorescence signal in GRABNE1m-expressing neurons, but not in control non-expressing neurons (Figs. S3I-L). The NE receptor-mediated outward currents had the same amplitude, latency, signal-to-noise ratio, desensitization, rise time and decay time constant in GRABNE1m-expressing and control non-expressing neurons (Figs. S3I-L and M-O), suggesting no effect of overexpression of GRABNE1m on endogenous NE receptor function. Notably, GRABNE1m detected faster NE signals prior to the electrophysiologically recorded NE-activated outward currents.
We also prepared acute hippocampal slices in which GRABNE1h was expressed using an adeno-associated virus (AAV); in this acute slice preparation, GRABNE1h-expressing hippocampal neurons are innervated by noradrenergic fibers, which was confirmed by post-hoc staining using an antibody against dopamine beta hydroxylase (Figs. S4A,B). Application of electrical stimuli at 20 Hz for 1 s elicited a robust increase in GRABNE1h fluorescence, and this increase was blocked by the application of yohimbine (Fig. S4C). Consistent with our results obtained using cultured slices, exogenous application of various α-adrenergic receptor agonists, including NE, Epi, and brimonidine—but not the β-adrenergic receptor agonist isoprenaline—evoked a fluorescence increase in GRABNE1h-expressing neurons, and this response was blocked by yohimbine, but not by the β-adrenergic receptor antagonist ICI 118,551 (Fig. S4D). To examine whether expression of GRABNE sensors would alter neurons’ physiology, we also compared the calcium signals between GRABNE1h-expressing neurons and control non-expressing neurons in acute hippocampus slices (Figs. S4E-I). Overexpression of a high affinity version of GRABNE sensor (GRABNE1h) did not alter the high potassium-induced calcium signals (Figs. S4G-I), indicating no apparent perturbation on the excitability of neurons when overexpressing GRABNE.
We examined whether our GRABNE sensors can be used to monitor the dynamics of endogenous NE. We expressed GRABNE1m in the locus coeruleus (LC) (Fig. 4A), which contains the majority of adrenergic neurons within the brain, and activation of LC neurons by salient stimuli including physiological stress, looming, and electrical stimulation, concomitantly releases NE throughout many brain regions (Berridge and Waterhouse, 2003; Dugast et al., 2002; Schwarz and Luo, 2015). Two weeks after AAV injection, we prepared acute brain slices and observed GRABNE1m expression in the membrane of LC neurons using two-photon microscopy (Fig. 4A). We then used electrical stimuli at 20 Hz to evoke the release of endogenous NE in the LC in the acute slices. Increasing the number of stimuli caused progressively stronger responses (Fig. 4B). To estimate the concentration of NE after electrical stimulation, we also perfused the same slices with different concentrations of exogenous NE. Based on the calibration curve, we estimated that the volume-averaged NE concentration (NEVol) was 0.17 ± 0.04 μM and 0.56 ± 0.13 μM when stimulated with 2 or 20 pulses at 20 Hz, respectively (Figs. S4J-M). Application of the voltage-activated potassium channel blocker 4-aminopyridine, which increases Ca2+ influx during action potentials, significantly increased the fluorescence response, whereas application of Cd2+ to block calcium channels abolished the stimulation-induced fluorescence increase (Fig. 4C), consistent with presynaptic NE release being mediated by Ca2+ influx. We also performed line-scanning experiments in order to track the kinetics of endogenous NE release (Fig. 4D, left). A brief electrical stimulation induced a rapid fluorescence response with a mean τon and τoff of 37 ms and 600 ms, respectively (Fig. 4D, middle and right). Taken together, these data indicate that GRABNE1m can be used to monitor the release of endogenous NE in real time.
Figure 4. Release of endogenous NE measured in mouse brain slices. See also Figure S4.

(A) Left, schematic illustration of the slice experiments. An AAV expressing hSyn-GRABNE1m was injected into the LC; two weeks later, acute brain slices were prepared and used for electric stimulation experiments. Right, exemplar 2-photon microscopy images showing the distribution of GRABNE1m in the plasma membrane of LC neurons.
(B) Left and middle, representative pseudocolor images and corresponding fluorescence changes in GRABNE1m-expressing neurons in response to 2, 20, and 100 pulses delivered at 20 Hz. The ROI (50-μm diameter) for data analysis is indicated in the images. Right, summary of the peak fluorescence change in slices stimulated as indicated; n = 5 slices from 5 mice.
(C) Exemplar traces and summary data of GRABNE1m-expressing neurons in response to 20 electrical stimuli delivered at 20 Hz in ACSF, 4-AP (100 μM), or 4-AP with Cd2+ (100μM); n = 4 slices from 4 mice.
(D) Kinetic properties of the electrically evoked fluorescence responses in GRABNE1m-expressing LC neurons. Left, image showing a GRABNE1m-expressing LC neuron for line scan analysis (red dashed line). Middle and right, example trace and summary of the responses elicited in GRABNE1m-expressing neurons before, and after 10 pulses delivered at 100Hz; n = 4 slices from 4 mice.
(E) The norepinephrine transporter blocker desipramine (Desi, 10 μM; red) increases the effect of electrical stimuli (20 pulses at 20 Hz) or two trains of stimuli with a 1-s interval compared to ACSF (black traces). n = 5 slices from 5 mice.
(F) The fluorescence response in GRABNE1m-expressing neurons is stable. Eight stimuli (20 pulses at 20 Hz) were applied at 5-min intervals, and the response (normalized to the first train) is plotted against time. n = 5 slices from 5 mice.
(G) Traces and summary data of the fluorescence response measured in neurons expressing GRABNE1m (the same plot in (E, left, gray curve)), GRABNEmut, or GRABDA1m in response to 20 pulses delivered at 20 Hz in the presence of ACSF or 20 μM YO; n = 3-7 slices from 3-7 mice.
(H) Traces and summary data of the fluorescence response measured in neurons expressing GRABNE1m or GRABDA1m. Where indicated, 50 μM NE, 50 μM DA, 20 μM yohimbine (YO), and/or 20 μM haloperidol (Halo) was applied to the cells. n = 3-5 slices from 3-5 mice.
The scale bars represent 10 μm.
*p < 0.05, **p < 0.01, and ***p < 0.001; n.s., not significant (Student’s t-test).
NE released into the synaptic cleft is recycled back into the presynaptic terminal by the norepinephrine transporter (NET). We therefore tested the sensitivity of GRABNE1m to NET blockade using desipramine in acute brain slices. In the presence of desipramine, electrical stimuli caused larger fluorescence responses in GRABNE1m-expressing neurons compared with ACSF alone (Fig. 4E). Moreover, desipramine significantly slowed down the decay kinetics of fluorescence signals, consistent with reduced reuptake of extracellular NE into the presynaptic terminal. To rule out the possibility that the change in the fluorescence response was caused by synaptic modulation over time, we applied repetitive electrical stimuli at 5-min intervals to GRABNE1m-expressing neurons and found that the stimulation-evoked response was stable for at least 40 min (Fig. 4F). Finally, we examined the specificity of the stimulation-induced response. Compared with a robust response in control conditions, the α-adrenergic antagonist yohimbine blocked the response; moreover, no response was elicited in LC neurons expressing GRABNEmut or in LC neurons expressing a dopamine sensor (GRABDA1m) (Fig. 4G). In contrast, cells expressing GRABDA1m responded robustly to the application of DA, and the GRABNE1m and GRABDA1m responses were abolished by yohimbine or the dopamine receptor antagonist haloperidol, respectively (Fig. 4H). Taken together, these data indicate that GRABNE sensors are both sensitive and specific for detecting endogenous noradrenergic activity in LC neurons.
GRABNE sensors detect both exogenous NE application and endogenous NE release in awake zebrafish
Zebrafish is a genetically accessible vertebrate species and optically transparent during development, thus serving as a suitable model for in vivo imaging. We generated the transgenic zebrafish line Tg(HuC:GRABNE1m), which pan-neuronally expressed the GRABNE1m sensor. Pan-neuronal expression was confirmed by GRABNE1m basal fluorescence on the cell membrane of neurons throughout the brain (Fig. 5A). Bath application of 50 μM NE—but not DA at the same concentration—elicited a robust increase in fluorescence intensity that was blocked completely by the subsequent application of 50 μM yohimbine (Figs. 5B-D). In addition, a separate zebrafish line expressing GRABNEmut did not respond to NE (Figs. 5C,D).
Figure 5. GRABNEcan be used to measure noradrenergic activity in vivo in transgenic zebrafish. See also Figure S5.

(A) In vivo confocal image of a Tg(HuC:GRABNE1m) zebrafish expressing GRABNE1m in neurons driven by the HuC promoter. Larvae at 6 days post-fertilization were used.
(B-D) Bath application of NE (50 μM) but not DA (50 μM) elicits a significant increase in fluorescence in the tectal neuropil of Tg(HuC:GRABNE1m) zebrafish, but not in GRABNEmut zebrafish, and this increase is blocked by YO (50 μM), but not ICI 118,551 (50 μM). n = 7.
(E-H) Visual looming stimuli evoke the release of endogenous NE in the midbrain of GRABNE1m zebrafish, but not in GRABNEmut zebrafish. The looming stimuli paradigm is shown in the left of (E). Where indicated, YO (50 μM) or ICI 118,551 (50 μM) was applied. Desipramine (Desi, 50 μM) application slowed the decay of looming-induced NE release (H). n = 6 for GRABNEmut, and n = 9 for the others.
(I-K) Single-cell labeling of GRABNE1m in the midbrain of zebrafish larva (I), with looming-evoked responses shown in (I and J). The summary data for 6 labeled cells are shown in (K).
(L) Looming-evoked calcium responses of optic tectal neurons reported by jRGECO1a show no difference with or without HuC:GRABNE1m overexpression. Exemplar traces of looming-evoked responses of single tectal neurons (L1, left). Responsive neurons sorted as descending amplitudes (L1, right). 20 s before each stimuli as the baseline. Averaged looming-evoked jRGECO1a responses of every neurons shown as gray lines (L2) and the averaged responses of all neurons (L2, red line and black line, respectively). The responsive ratio and averaged amplitude of every fish are shown in (L2). n = 6.
The scale bar shown in (A, left) represents 10 μm; the scale bars shown in (A, right), (B) and (E) represent 50 μm. The scale bar shown in (I) represents 5 μm.
*p < 0.05, **p < 0.01, ***p < 0.001, and ****p < 0.0001; n.s., not significant (Wilcoxon matched-pairs signed rank test in panel H, all others were analyzed using the paired or unpaired Student’s t-test).
Next, we investigated whether GRABNE1m can be used to measure the dynamics of endogenous noradrenergic activity induced by a salient stimulus. Visual looming triggers a robust escape response in zebrafish (Berridge and Waterhouse, 2003; Li et al., 2018). We applied repeated looming stimuli during confocal imaging to record the fluorescence of GRABNE1m-expressing neurites in the optic tectum (Fig. 5E). Each looming stimulus induced a time-locked increase in GRABNE1m fluorescence, which was blocked by bath application of yohimbine but unaffected by the β-adrenergic receptor antagonist ICI 118,551 (Figs. 5F,G). Similarly, looming stimuli induced a time-locked, repeatable fluorescence increase in GRABNE1h transgenic zebrafish (Figs. S5A,B). In contrast, the same looming stimuli had no effect in zebrafish expressing GRABNEmut (Figs. 5F,G). In addition, adding the NE reuptake inhibitor desipramine slowed the decay of the fluorescence signal (Fig. 5H). By sparsely expressing GRABNE1m in individual neurons in zebrafish larvae via transient transfection, we were also able to record robust signals at single-cell resolution in response to repetitive looming stimuli (Figs. 51-K), confirming that our GRABNE sensors can be used to sense NE release at the single-cell level with high spatiotemporal resolution. Finally, by expressing jRGECO1a, we compared both spontaneous and looming-evoked calcium activities in the optic tectum between zebrafish with- or without GRABNE1m-expression, and observed no significant difference in activity (Fig. S5C1-C3 and Fig. 5L), suggesting no adverse effects when expressing GRABNE sensors in vivo. Taken together, these data indicate that GRABNE sensors are sensitive and specific for detecting in vivo NE release in a common model system.
GRABNE1m detects optogenetically evoked NE release in freely moving mice
Having demonstrated proof-of-concept in a relatively simple in vivo vertebrate system, we next examined whether the GRABNE sensors can be used to monitor noradrenergic activity in the mammalian brain. We virally expressed GRABNE1m (non-Cre dependent) together with the optogenetic actuator C1V1 (Cre-dependent) in the LC of Th-Cre mice (Fig. 6A). Optogenetic stimulation of LC noradrenergic neurons using 561 nm laser pulses reliably evoked an increase in GRABNE1m fluorescence in fiber photometry recording of freely moving mice. Moreover, intraperitoneal (i.p.) injection of desipramine produced a slow progressive increase in basal GRABNE1m fluorescence (consistent with an increase in extracellular NE levels) and caused an increase in the magnitude and decay time of the light-activated responses. I.p. injection of yohimbine abolished both the increase in basal GRABNE1m fluorescence and the light-evoked responses (Figs. 6B-D). In contrast, treating mice with either GBR 12909 (a selective blocker of dopamine transporters) or eticlopiride (a specific D2R antagonist) had no effect on the light-evoked responses in GRABNE1m fluorescence (Figs. 6C-E). To further test the selectivity of GRABNE1m between NE and DA, we co-expressed GRABNE1m and DIO-C1V1 both in the LC and in the substantia nigra pars compacta (SNc) of Th-Cre mice (Fig. 6F). In these mice, optogenetic stimulation of dopaminergic neurons in the SNc did not cause any changes in the GRABNE1m fluorescence in the SNc. In contrast, stimulating NE neurons in the LC produced a robust increase in GRABNE1m fluorescence (Figs. 6F,G). These results confirmed that the increase of GRABNE1m fluorescence reflects the release of endogenous NE from noradrenergic neurons in the LC.
Figure 6. GRABNE1m can be used to measure optogenetically stimulated noradrenergic activity in vivo in freely moving mice.

(A) Schematic illustration depicting the experimental design for recording GRABNE1m and GRABNEmut fluorescence in response to optical stimulation of C1V1 in the locus coeruleus (LC).
(B) Representative traces of optogenetically stimulated GRABNE1m (top) and GRABNEmut (bottom) activity in the LC before (baseline, left), 15 min after an i.p. injection of the NET blocker desipramine (10 mg/kg, middle), and 15 min after an i.p. injection of the α2AR antagonist yohimbine (2 mg/kg, right). The vertical tick marks indicate the optogenetic stimuli. Black arrows represent the timing for grabbing and i.p. injection.
(C-D) Average traces of GRABNE1m fluorescence (C), summary data (D) and the decay time constant (E) in response to optical stimulation in the LC following treatment with the indicated compounds. n = 15 trials from 3 mice for each condition.
(F,G) Schematic illustration (F, left), representative traces (F, right), average fluorescence change (G, left), and summary data (G, right) for GRABNE1m in response to optical stimulation of noradrenergic neurons in the LC and dopaminergic neurons in the SNc.
***p < 0.001 (for D and E, One-Way ANOVA, forG, Student’s t-test).
Using GRABNE1m to track endogenous NE dynamics in the mouse hypothalamus during freely moving behaviors
In the brain, the hypothalamus mediates a variety of innate behaviors essential for survival, including feeding, aggression, mating, parenting, and defense (Hashikawa et al., 2016; Sokolowski and Corbin, 2012; Yang and Shah, 2016). The hypothalamus receives extensive noradrenergic projections (Moore and Bloom, 1979; Schwarz and Luo, 2015; Schwarz et al., 2015) and expresses an abundance of α2-adrenergic receptors (Leibowitz, 1970; Leibowitz et al., 1982). Microdialysis studies found that the hypothalamus is among the brain regions that release the high levels of NE during stress (McQuade and Stanford, 2000; Pacak et al., 1995; Shekhar et al., 2002; Tanaka, 1999). To better understand NE dynamics in the hypothalamus under stress, we virally expressed hSyn-GRABNE1m in the lateral hypothalamus of C57BL/6 mice. Three weeks after virus injection, we performed fiber photometry recordings of GRABNE1m fluorescence during a variety of stressful and non-stressful behaviors in freely moving mice (Fig. 7).
Figure 7. GRABNE1m can be used to measure noradrenergic activity in the hypothalamus during stress, food-related behavior, and social interaction. See also Figure S6.

(A) Schematic diagrams depicting the fiber photometry recording, virus injection, and recording sites.
(B) Histology showing the expression of GRABNE1m (green) and placement of the recording; the nuclei were counterstained with DAPI (blue). Scale bar: 500μm.
(C1-E6) Representative traces (C1-C6), average per-stimulus histograms (D1-D6), and summary data (E1-E6) showing normalized GRABNE1m fluorescence (ΔF/F) before and during the forced swim test (1), and before, between and during the tail suspension test (2), the hand presentation test (3), social interaction with an intruder of the opposite sex (4) and the same sex (5), and presentation of peanut butter (6). n = 3 animals each.
(F) Representative traces of GRABNE1m fluorescence during the tail suspension test 10 minutes after saline injection, 25 minutes after atomoxetine (ATX) or yohimbine (YO) injection, and 15 minutes after GBR 12909 or sulpiride (Sul) injection.
(G-I) Average peri-stimulus histograms (H), peak change in GRABNE1m fluorescence, and post-test decay time measured during the tail suspension test after injection of the indicated compounds. n = 3 each.
The Shapiro-Wilk normality test was performed; if the test revealed it followed a normal distribution, a paired Student’s t-test or one-way repeated measures ANOVA followed by Tukey’s multiple comparisons was performed. If the values did not follow a normal distribution, a non-parametric ANOVA (Friedman’s test) was performed followed by Dunn’s multiple comparisons test. In (C) and (D), the blue dotted lines represent the start of the stimulus, and the red dotted lines represent the end of the trial.
*p < 0.05, **p < 0.01 and ***p<0.001.
During forced swimming and tail suspension tests, both of which were stressful, we observed a significant increase in GRABNE1m fluorescence. During forced swimming, the fluorescence signal increased continuously regardless of the animal’s movements and started to decrease only after the animal was removed from the water (Figs. 7C1-E1). During the 60-s tail suspension test, the signal began to rise when the animal was first pursued by the experimenter’s hand, increased continuously while the animal was suspended by the tail, and decreased rapidly back to baseline after the animal was returned to the ground (Figs. 7C2-E2). Additionally, when a human hand was placed in front of the animal, we observed a small and transient increase in GRABNE1m fluorescence (Figs. 7C3-E3). In contrast, when a conspecific intruder of either the same or the opposite sex was introduced into the test animal’s cage, we observed no change or a decrease in GRABNE1m signals both during the initial introduction and subsequent social interactions, including social approach, being sniffed, or sniffing (Figs. 7C4-E4 and 7C5-E5). Similarly, sniffing or eating palatable food (i.e peanut butter) did not evoke detectable GRABNE1m fluorescence signals (Figs. 7C6-E6). In control animals that expressed GRABNEmutin the lateral hypothalamus, we observed no increase in fluorescence during all examined behavioral tests, including the forced swimming test and the tail suspension test, suggesting that movement artifacts contribute minimally to the detected signal change (Fig. S6). These data altogether provide evidence indicating that noradrenergic activity in the lateral hypothalamus occurs primarily under stressful conditions.
Finally, to confirm the specificity of the GRABNE1m sensor for monitoring NE dynamics over other monoamine neurotransmitters, such as dopamine, we injected mice with a highly specific NET inhibitor atomoxetine (3 mg/kg i.p.) to inhibit the reuptake of NE. Although atomoxetine had no effect on the GRABNE1m peak fluorescence during the tail suspension test, it significantly slowed the return of signal to its baseline after each tail suspension (Figs. 7F1-I1); in contrast, treating mice with the α-adrenergic receptor antagonist yohimbine (2 mg/kg, i.p.) both decreased GRABNE1m peak fluorescence and significantly accelerated the return to baseline (Figs. 7F1-I1). Treating mice with either the selective DAT inhibitor GBR 12909 (10 mg/kg, i.p.) or the D2R antagonist sulpiride (50 mg/kg, i.p.) had no effect on the peak change in GRABNE1m fluorescence or the time to return to baseline (Figs. 7F2-I2). In summary, these data demonstrate that our GRABNE sensors are suitable for monitoring endogenous noradrenergic activity in real time, with high spatiotemporal precision, during freely moving behaviors in mammals.
Discussion
Here, we report the development and validation of GRABNE1m and GRABNE1h, two genetically encoded NE sensors that can be used both in vitro and in vivo to monitor noradrenergic activity with high temporal and spatial resolution, high ligand specificity, and cell-type specificity. In mouse acute brain slices, our GRABNE sensors detected NE release from the LC in response to electrical stimulation. In zebrafish, the GRABNE sensors reported looming-induced NE release with single-cell resolution. In mice, the GRABNE sensors reported time-locked release of NE in the LC triggered by optogenetic stimulation, and in hypothalamic NE levels during a variety of stress-related behaviors.
Compared with the existing methods for measuring NE, our GRABNE sensors have distinct advantages. Our GRABNE sensors have extremely high specificity for NE over most other neurotransmitters and chemical modulators, including DA (Figs. 2H,3F). It has been difficult to distinguish NE from DA in vivo (e.g. by FSCV) (Park et al., 2009; Robinson et al., 2003), largely because of their structural similarities: they differ in only one hydroxyl group. GRABNE1mhas a roughly 1000-fold higher affinity for NE over DA when expressed in neurons, even better than the 85-fold difference of the wild-type α2-adrenergic receptor. Thus, our GRABNE sensors provide new opportunities to probe the dynamics of noradrenergic activity with high specificity, which is particularly valuable when studying the many brain regions that receive overlapping dopaminergic and noradrenergic inputs. A notable property of GRABNE sensors is their similar responses for NE and Epi. Almost all native human adrenergic receptors (α1AR/1BR/1DR, α2AR/2BR/2CR, and β1R/2R/3R) also respond non-discriminately to both NE and Epi (1-10 μM) (Hoffman and Lefkowitz, 1980). So, from the target cells’ perspective, GRABNE sensors provide a general tool to reveal when and where physiologically relevant levels of noradrenergic or adrenergic modulation occur. Discriminating NE versus Epi in the mammalian central nervous system is a relatively minor concern, because the specific enzyme (PNMT transferase) that converts NE to Epi primarily exists in peripheral systems (e.g. adrenal medulla; (Goldstein et al., 1972), except for very small groups of neurons in human brain (Kitahama et al., 1985).
Our GRABNE sensors have extremely high sensitivity for NE. Specifically, their EC50 for NE spans sub-micromolar levels. Their dynamic range is high, 150-230% mean increase in fluorescence intensity upon binding saturating NE. By comparison, recently published FRET-based NE indicators produce a signal change of ≤10% under optimal conditions (Wang et al., 2018a; Wang et al., 2018b). Thus, GRABNE sensors have much improved characteristics for monitoring NE dynamics in vivo. Our sensors have brightness and photostability properties that rival EGFP, which permits stable recordings across extended experimental sessions. In addition, because they provide sub-second response kinetics and are genetically encoded, our GRABNE sensors can non-invasively report noradrenergic activity in vivo with single-cell resolution and high recording rate (~30 Hz). Moreover, because GRABNE sensors traffic to various surface membranes, including the cell body, dendrites, and axons, where they perform equally well, they are promising to provide subcellular spatial resolution, which is essential for understanding compartmental NE signaling in vivo. One caveat is that since GRABNE sensors are engineered from the α2A receptor, they may not be suitable for pharmacological investigation of α2A receptor related regulation.
Ligand binding to endogenous GPCRs drives G-protein activation and receptor internalization. If recapitulated in GRABNE sensors, expression could interfere with endogenous signaling fidelity and disturb normal neuronal activity. We saw little evidence of downstream coupling to both G protein–independent and G protein–dependent pathways. The introduction of the cpEGFP moiety in the GRABNE sensors resulted in undetectable engagement of arrestin-mediated desensitization/internalization, which suggests that the GRABNE sensors do not inadvertently activate arrestin-dependent signaling and ensures more consistent surface expression of the sensors. With respect to G protein–dependent signaling, we found that although physiological levels of NE robustly induce a change in GRABNE fluorescence, they do not significantly engage downstream G protein signaling (Figs. 2J-M).
Noradrenergic projections throughout the brain originate almost exclusively from the LC, and the released NE plays a role in a wide range of behaviors, including cognition and the regulation of arousal, attention, and alertness (Berridge and Waterhouse, 2003; Li et al., 2018; Schwarz et al., 2015). Interestingly, our fiber photometry recordings of GRABNE sensors’ fluorescence in the hypothalamus of freely behaving mice revealed specific changes in noradrenergic activity under stressful but not non-stressful conditions. These data are generally consistent with previous data obtained using microdialysis to measure NE (McQuade and Stanford, 2000; Pacak et al., 1995; Shekhar et al., 2002; Tanaka, 1999). Nevertheless, it is worth noting that hypothalamus is a highly heterogeneous structure containing dozens of nuclei with diverse functions, it remains possible that NE is released during non-stressful conditions in regions outside of lateral hypothalamus. The spatial resolution and potential for cell-type specificity of GRABNE sensors should enable more precise investigation of NE signaling across hypothalamic nuclei in freely moving animals.
NE circuits of the LC receive heterogeneous inputs from a broad range of brain regions and send heterogeneous outputs to many brain regions (Schwarz et al., 2015). Congruously, altered noradrenergic activity is associated with a broad range of psychiatric conditions and neurodegenerative diseases, including ADHD, PD, depression, and anxiety (Marien et al., 2004). The complexity of these disorders may, in part, reflect the complexity of noradrenergic circuits and signals, which cannot be fully dissected by previous tools. Therefore, the GRABNE sensors we present here are more suitable for understanding the regulation and impact of noradrenergic activity during complex behaviors. Deploying these in concert with other cell-specific tools for reporting (Jing et al., 2018; Patriarchi et al., 2018; Sun et al., 2018) and manipulating neurotransmitter levels (Fenno et al., 2011; Urban and Roth, 2015) will increase our understanding of the circuits and mechanisms that underlie brain functions in both health and disease.
STAR METHODS
CONTACT FOR REAGENT AND RESOURCE SHARING
Further information and requests for resources and reagents should be directed to and will be fulfilled by the Lead Contact, Yulong Li (Yulongli@pku.edu.cn).
EXPERIMENTAL MODEL AND SUBJECT DETAILS
Primary cultures
Rat cortical neurons were prepared from postnatal day 0 (P0) Sprague-Dawley rat pups (both male and female, randomly selected; Beijing Vital River). In brief, cortical neurons were dissociated from dissected P0 rat brains in 0.25% Trypsin-EDTA (Gibco), plated on 12-mm glass coverslips coated with poly-D-lysine (Sigma-Aldrich), and cultured at 37°C in 5% C02 in neurobasal medium (Gibco) containing 2% B-27 supplement, 1% GlutaMax, and 1% penicillin-streptomycin (Gibco).
Cell lines
HEK293T cells were obtained from ATCC (CRL-3216) and verified based on their morphology under the microscope and by their growth curve. Stable cell lines expressing the wild-type α2-adrenergic receptor or various GRABNE sensors were constructed by co-transfecting cells with the pPiggyBac plasmid carrying target genes with Tn5 transposase into a stable HEK293T-based cell line expressing chimeric Gαq/i and AP-TGFα (Inoue et al., 2012). Cells that stably expressed the target genes were selected by treating with 2 mg/ml Puromycin (Sigma) after reaching 100% confluence. The HTLA cells used for the TANGO assay stably express a tTA-dependent luciferase reporter and a β-arrestin2-TEV fusion gene and were a gift from Bryan L. Roth (Kroeze et al., 2015). All cell lines were cultured at 37°C in 5% CO 2 in DMEM (Gibco) supplemented with 10% (v/v) fetal bovine serum (Gibco) and 1% penicillin-streptomycin (Gibco).
Mice/Rats
All procedures regarding animals were approved by the respective Animal Care and Use Committees at Peking University, New York University, University of Southern California, University of Virginia and the US National Institutes of Health, and were performed in compliance with the US National Institutes of Health guidelines for the care and use of laboratory animals. Wild-type Sprague-Dawley rat pups (P0) were used to prepare cultured cortical neurons and pups (P6-7) were used to prepare cultured hippocampal slices. Wild-type C57BL/6 and Th-Cre mice (MMRRC_031029-UCD, obtained from MMRRC) were used to prepare the acute brain slices and for the in vivo mouse experiments. Experimental Th-Cre mice were produced by breeding Th-Cre hemizygous BAC transgenic mice with C57BL/6J mice. All animals were housed in the animal facility and were family-housed or pair-housed in a temperature-controlled room with a 12hr-12h light-dark cycle (10 pm to 10 am light) with food and water provided ad libitum. All in vivo mouse experiments were performed using 2-12-month-old mice of both sexes.
Zebrafish
The background strain for these experiments is the albino strain slc45a2b4. To generate transgenic zebrafish, both the pTol2-HuC:GRABNE1m plasmid and Tol2 mRNA were co-injected into single-cell stage zebrafish eggs, and the founders of Tg(HuC:GRABNE1m) were screened at adult stage. Tg(HuC:GRABNE1h) and Tg(HuC:GRABNEmut) were generated as described above by using the pTol2-HuC:GRABNE1h and pTol2-HuC:GRABNEmut plasmid, respectively. Adult fish and larvae were maintained on a 14h-10h light-dark cycle at 28°C. All experimental larvae were raised to 6-8 days post-fertilization (dpf) in 10% Hank’s solution, which consisted of (in mM): 140 NaCl, 5.4 KCl, 0.25 Na2HPO4, 0.44 KH2PO4, 1.3 CaCl2, 1.0 MgSO4, and 4.2 NaHCO3 (pH 7.2). Larval zebrafish do not undergo sex differentiation prior to 1 month post-fertilization (Singleman and Holtzman, 2014).
METHOD DETAILS
Molecular cloning
The molecular clones used in this study were generated by Gibson Assembly (Gibson et al., 2009) using DNA fragments amplified using primers (Thermo Fisher Scientific, Table S1) with 25-bp overlap. The Gibson Assembly cloning enzymes consisted of T5-exonuclease (New England Biolabs), Phusion DNA polymerase (Thermo Fisher Scientific), and Taq ligase (iCloning). Sanger sequencing was performed using the sequencing platform at the School of Life Sciences of Peking University in order to verify the sequence of all clones. All cDNAs encoding the candidate GRABNE sensors were cloned into the pDisplay vector (Invitrogen) with an upstream IgK leader sequence and a downstream IRES-mCherry-CAAX cassette to label the cell membrane. The cDNAs of select adrenergic receptor candidates were amplified from the human GPCR cDNA library (hORFeome database 8.1), and cpEGFP from GCaMP6s was inserted into the third intracellular loop (ICL3). The insertion sites for the GRABNE sensors were screened by truncating the ICL3 of the α2-adrenergic receptor at the 10-amino acid (AA) level, followed by fine-tuning at the 1-AA level. Coupling linkers were randomized by PCR amplification using randomized NNB codons in target sites. Other cDNAs used to express the GRABNE sensors in neurons were cloned into the pAAV vector using the human synapsin promoter (hSyn) or TRE promoter. pAAV-hSyn-tTA was used to drive expression of the TRE promoter. The plasmids carrying compartmental markers were cloned by fusing EGFP-CAAX, RFP-CAAX (mScarlet), KDELR-EGFP, PSD95-RFP, and synaptophysin-RFP into the pDest vector. The sensors were also subcloned into Sindbis viral vector for cultured hippocampal slices expression. To characterize signaling downstream of the GRABNE sensors, we cloned the sensors and the wild-type α2-adrenergic receptor into the pTango and pPiggyBac vector, respectively. A hyperactive piggyBac transposase was generated by introducing two mutations into pCS7-PiggyBAC (VIEWSOLID BIOTECH) (Yusa et al., 2011). GRABNE1m-SmBit and α2AR-SmBit were derived from β2AR-SmBit (Wan et al., 2018) using a BamHI site incorporated upstream of the GGSG linker. LgBit-mGsi was a gift from Nevin A. Lambert.
Expression of GRABNE sensors in cultured cells and in vivo
The GRABNE sensors were characterized in HEK293T cells and cultured rat cortical neurons, with the exception of the TANGO assay and TGFα shedding assay. HEK293T cells were passaged with Trypsin-EDTA (0.25%, phenol red; Gibco) and plated on 12-mm size 0 glass coverslips in 24-well plates and grown to ~70% confluence for transfection. HEK293T cells were transfected by incubating cells with a mixture containing 1 μg of DNA and 3 μg of PEI for 6 h. Imaging was performed 24-48 h after transfection. Cells expressing GRABNE sensors for screening were plated on 96-well plates (PerkinElmer).
Cultured neurons were transfected using the calcium phosphate method at 7-9 DIV. In brief, the neurons were incubated for 2 h in a mixture containing 125 mM CaCl2, HBS (pH 7.04), and 1.5 μg DNA. The DNA-Ca3(P04)2 precipitate was then removed from the cells by washing twice with warm HBS (pH 6.80). Cells were imaged 48 h after transfection.
For in vivo expression, the mice were anesthetized by an i.p. injection of 2,2,2-tribromoethanol (Avetin, 500 mg/kg body weight, Sigma-Aldrich) or under isoflurane anesthesia, and then placed in a stereotaxic frame for injection of AAVs using a Nanoliter 2000 Injector (WPI) or Nanoject II (Drummond Scientific) microsyringe pump. For the experiments shown in Fig. 4, Fig. 6, and Fig. S4J-M, the AAVs containing hSyn-GRABNE1mNE1hNEmut/DA1m and Ef1a-DIO-C1V1-YFP (Yizhar et al., 2011) were injected into the LC (AP: −5.45 mm relative to Bregma; ML: ±1.25 mm relative to Bregma; and DV: −2.25 mm from the brain surface) or SNc (AP: −3.1 mm relative to Bregma; ML: ±1.5 mm relative to Bregma; and DV: −3.8 mm from the brain surface) of wild-type or Th-Cre mice. For experiments shown in Fig. S4A-I, AAVs containing hSyn-tTA and TRE-GRABNE1h were injected into the dentate gyrus (AP: −1.8 mm relative to Bregma; ML: ±0.8 mm relative to Bregma; and DV: −2.0 mm from the brain surface) of wild-type mice. For the experiments shown in Fig. 7 and Fig. S6, 100 nl of AAV9-hSyn-GRABNE1m or AAV9-hSyn-GRABNEmut (Vigene, 1×10¹³ titer genomic copies per ml) were unilaterally into the hypothalamus (AP: −1.7 mm relative to Bregma; ML: 0.90 mm relative to Bregma; and DV: −6.05 mm from the brain surface) of wild-type (C57BL/6) mice at a rate of 10 nl/min.
Fluorescence imaging of HEK293T cells and cultured neurons
HEK293T cells and cultured neurons expressing GRABNE sensors were screened using an Opera Phenix high-content imaging system (PerkinElmer) and imaged using an inverted Ti-E A1 confocal microscope (Nikon). A 60x/1.15 NA water-immersion objective was mounted on the Opera Phenix and used to screen GRABNE sensors with a 488-nm laser and a 561-nm laser. A 525/50 nm and a 600/30 nm emission filter were used to collect the GFP and RFP signals, respectively. HEK293T cells expressing GRABNE sensors were first bathed in Tyrode’s solution and imaged before and after addition of the indicated drugs at the indicated concentrations. The change in fluorescence intensity of the GRABNE sensors was calculated using the change in the GFP/RFP ratio. For confocal microscopy, the microscope was equipped with a 40x/1.35 NA oil-immersion objective, a 488-nm laser, and a 561-nm laser. A 525/50 nm and a 595/50 nm emission filter were used to collect the GFP and RFP signals, respectively. GRABNE-expressing HEK293T cells and neurons were perfused with Tyrode’s solutions containing the drug of interest in the imaging chamber. The photostability of GRABNE sensors and EGFP was measured using a confocal microscope (for 1-photon illumination) equipped with a 488-nm laser at a power setting of ~350 μW, and using a FV1000MPE 2-photon microscope (Olympus, 2-photon illumination) equipped with a 920-nm laser at a power setting of ~27.5 mW. The illuminated region was the entire HEK293T cell expressing the target protein, with an area of ~200 μm2. Photolysis of 100 μM NPEC-caged-NE (Santa Cruz) was performed by combining fast scanning with a 76-ms pulse of 405-nm laser illumination by a confocal microscope. 10 μM YO was used to specific block the NE-induced fluorescence response. 100 μM NE and 200 μM yohimbine were used in determination of on or off kinetics in rapid perfusion experiments.
TANGO assay
NE at various concentrations (ranging from 0.1 nM to 100 μM) was applied to α2AR-expressing or GRABNE1m-/ GRABNE1h-expressing HTLA cells (Kroeze et al., 2015). The cells were then cultured for 12 hours to allow expression of the luciferase gene. Furimazine (NanoLuc Luciferase Assay, Promega) was then applied to a final concentration of 5 μM, and luminescence was measured using a VICTOR X5 multilabel plate reader (PerkinElmer).
TGFα shedding assay
TGF shedding assay was performed as previously described (Inoue et al., 2012). Stable cell lines expressing Gαi-AP-TGFα together with the wild-type α2AR or GRABNE1m were plated in a 96-well plate and treated by the addition of 10 μl of a 10x solution of NE in each well, yielding a final NE concentration ranging from 0.1 nM to 100 μM. Absorbance at 405 nm was read using a VICTOR X5 multilabel plate reader (PerkinElmer). TGFα release was calculated as described previously (Inoue et al., 2012). Relative levels of G protein activation were calculated as the TGFα release of GRABNE sensors normalized to the release mediated by wild-type α2AR.
FSCV
Fast-scan cyclic voltammetry (FSCV) was performed using 7-μm carbon fiber microelectrodes. Voltammograms were measured with a triangular potential waveform from −0.4 V to +1.1 V at a scan rate of 400 V/s with a 100-ms interval. The carbon fiber microelectrode was held at −0.4 V between scans. Voltammograms measured in the presence of various different drugs in Tyrode’s solution were generated using the average of 200 scans followed by the subtraction of the average of 200 background scans. Currents were recorded using the Pinnacle tethered FSCV system (Pinnacle Technology). Pseudocolor plots were generated using Pinnacle FSCV software.
Luciferase complementation assay
The luciferase complementation assay was performed as previously described (Wan et al., 2018). In brief, ~48h after transfection the cells were washed with PBS, harvested by trituration, and transferred to opaque 96-well plates containing diluted NE solutions from 1 nM to 100 μM. Furimazine (NanoLuc Luciferase Assay, Promega) was added to each well immediately prior to performing the measurements with Nluc.
Fluorescence imaging of GRABNE sensors in brain slices
Fluorescence imaging of acute brain slices was performed as previously described (Sun et al., 2018). In brief, the animals were anesthetized with Avertin, and acute brain slices containing the LC region or the hippocampus region were prepared in cold slicing buffer containing (in mM): 110 choline-Cl, 2.5 KCl, 1.25 NaH2PO4, 25 NaHC03, 7 MgCl2, 25 glucose, and 2 CaCl2. Slices were allowed to recover at 35°C in oxygena ted Ringers solution containing (in mM): 125 NaCl, 2.5 KCl, 1.25 NaH2PO4, 25 NaHC03, 1.3 MgCl2, 25 glucose, and 2 CaCl2 for at least 40 minutes before experiments. An Olympus FV1000MPE two-photon microscope equipped with a 40x/0.80 NA water-immersion objective and a mode-locked Mai Tai Ti:Sapphire laser (Spectra-Physics) tuned to 920 nm were used for imaging the slices. For electrical stimulation, a concentric electrode (model #CBAEC75, FHC) was positioned near the LC region, and the imaging and stimuli were synchronized using an Arduino board controlled using a custom-written program. The imaging speed was set at 0.148 s/frame with 128 × 96 pixels in each frame. The stimulation voltage was set at ~6 V, and the duration of each stimulation was typically 1 ms. Drugs were either delivered via the perfusion system or directly bath-applied in the imaging chamber. For the calcium imaging experiments, the acute brain slices expressing GRABNE1h were prepared and bath loaded with red calcium dye Cal590 (20 μM, AAT Bioquest Inc., Sunnyvale, CA) for 1h, and subsequently washed in ACSF for 30 mins before conducting two-photon imaging. Cal590 dye was excited with two-photon laser at 920 nm, and 90 mM KCl was perfused to stimulate calcium signals.
For immunostaining of brain sections, GRABNE-expressing mice were anesthetized with Avetin, and the heart was perfused with 0.9% NaCl followed by 4% paraformaldehyde (PFA). The brain was then removed, placed in 4% PFA for4 h, and then cryoprotected in 30% (w/v) sucrose for 24 h. The brain was embedded in tissue-freezing medium, and 50-μm thick coronal sections were cut using a Leica CM1900 cryostat (Leica, Germany). A chicken anti-GFP antibody (1:500, Abcam, #ab13970) was used to label GRABNE, and a rabbit anti-DBH antibody (1:50, Abcam, #ab209487) was used to label adrenergic terminals in the hippocampus. Alexa-488-conjugated goat-anti-chicken and Alexa-555-conjugated goat-anti-rabbit secondary antibodies were used, and the nuclei were counterstained with DAPI. The sections were imaged using a confocal microscope (Nikon).
Electrophysiology
Cultured slices were prepared from P6–7 rats following the previous studies (Wang et al., 2015; Zhang et al., 2018). In brief, the hippocampus were dissected out in ice-cold HEPES-buffered Hanks’ solution (pH 7.35) under sterile conditions, sectioned into 400 μm slices on a tissue chopper, and explanted onto a Millicell-CM membrane (0.4-μm pore size; Millipore, MA). The membranes were then placed in 750 μl of MEM culture medium, contained (in mM): HEPES 30, heat-inactivated horse serum 20%, glutamine 1.4, D-glucose 16.25, NaHC03 5, CaCl2 1, MgSO4 2, insulin 1 mg/ml, ascorbic acid 0.012% at pH 7.28 and osmolarity 320. Cultured slices were maintained at 35°C, in a humidified incubator (ambient air enriched with 5% C02).
Simultaneous dual whole-cell recordings were obtained from two nearby infected and non-infected hippocampal CA1 pyramidal neurons under visual guidance using fluorescence and transmitted light illumination. The patch recording pipettes (4–7 MΩ) were filled with intracellular solution 120 mM potassium gluconate, 4 mM KCl, 10 mM HEPES, 4 mM MgATP, 0.3 mM Na3GTP, 10 mM sodium phosphocreatine and 0.5% biocytin (pH 7.25) for voltage-clamp recordings. Bath solution (29 ± 1.5°C) contained (in mM): NaCI 119, KCl 2.5, CaCl24, MgCl2 4, NaHCO326, NaH2PO4 1 and glucose 11, at pH 7.4 and gassed with 5% CO2/95% O2. Whole-cell recordings were made with up to two Axopatch-200B patch clamp amplifiers (Molecular Devices, Sunnyvale, CA).
Fluorescence imaging of zebrafish
Tg(HuC:GRABNE1m) and Tg(HuC:GRABNE1h) zebrafish larvae were imaged by using an upright confocal microscope (Olympus FV1000, Japan) equipped with a 20x/0.95 NA water-dipping objective. The larvae were first paralyzed with α-bungarotoxin (100 μg/ml, Sigma), mounted dorsal side up in 1.5% low melting-point agarose (Sigma), and then perfused with an extracellular solution consisting of (in mM) 134 NaCl, 2.9 KCl, 4 CaCl2, 10 HEPES, and 10 glucose (290 mOsmol/L, pH 7.8). Images were acquired at 1-2 Hz with a view field of 800 × 800 pixels and a voxel size was 0.62 × 0.62 × 2.0 μm3 (x × y × z). To detect the sensor’s response to exogenous NE, 50 μM L-(−)-norepinephrine (+)-bitartrate salt monohydrate (Sigma) in 5 μM L-ascorbic acid and 50 μM yohimbine hydrochloride (TOCRIS) were sequentially applied to the bath. To detect endogenous NE release, visual looming stimuli, which mimic approaching objects or predators (Yao et al., 2016) were projected to the larvae under a red background. Each trial lasted 5 s, and 5 trials were performed in a block, with a 90-s interval between trials. To examine the specificity of responses, ICI 118,551 hydrochloride (50 μM, Sigma), yohimbine hydrochloride (50 μM, TOCRIS), and desipramine hydrochloride (50 μM, Sigma) were applied. Looming stimuli in transiently transfected HuC:GRABNE1m zebrafish were measured at single-cell resolution by using the same conditions described above. To examine whether overexpression of GRABNE sensors affect neuronal activities, we performed spontaneous and looming-evoked calcium imaging for tectal neurons in Tg(HuC:NES-jRGECO1a) with or without HuC:GRABNE1m expression. Ten minutes’ spontaneous calcium activities were recorded after 15-min habituation.
Fiber photometry recording in freely moving mice during optical stimulation
In the all-optic experiments shown in Fig. 6, multimode optical fiber probes (105/125 μm core/cladding) were implanted into the LC (AP: −5.45 mm relative to Bregma; ML: ±0.85 mm relative to Bregma; and DV: −3.5 mm from the brain surface) and the SNc (AP: −3.1 mm relative to Bregma; ML: ±1.5 mm relative to Bregma; and DV: −3.85 mm from the brain surface) in mice four weeks after viral injection. Fiber photometry recording in the LC and/or SNc was performed using a 473-nm laser with an output power of 25 μW measured at the end of the fiber. The measured emission spectra were fitted using a linear unmixing algorithm (https://www.niehs.nih.gov/research/atniehs/labs/ln/pi/iv/tools/index.cfm). The coefficients generated by the unmixing algorithm were used to represent the fluorescence intensities of various fluorophores (Meng et al., 2018). To evoke C1V1-mediated NE/DA release, pulse trains (10-ms pulses at 20 Hz for 1 s) were delivered to the LC/SNc using a 561-nm laser with an output power of 9.9 mW measured at the end of the fiber.
Fiber photometry recording in mice during behavioral testing
For the experiments in Fig. 7 and Fig. S6, a fiber photometry recording set-up was generated and used as previously described (Falkner et al., 2016). GRABNE1m was injected into the lateral hypothalamus (Bregma AP: −1,7mm; ML: 0.90 mm; DV: −6.05 mm) of C57BL/6 mice in a volume of 100 nl containing AAV9-hSyn-GRABNE1m (Vigene, 1×10¹³ titer genomic copies per ml) or AAV9-hSyn-GRABNEmut (Vigene, 1×10¹³ titer genomic copies per ml) at 10 nl/min. A 400-μm optic fiber (Thorlabs, BFH48–400) housed in a ceramic ferrule (Thorlabs, SFLC440–10) was implanted 0.2 mm above the injection site. The virus was left to incubate for three weeks. Prior to fiber photometry recording, a ferrule sleeve was used to connect a matching optic fiber to the implanted fiber. For recordings, a 400-Hz sinusoidal blue LED light (30 μW; M470F1 driven by an LEDD1B driver; both from Thorlabs) was bandpass-filtered (passing band: 472 ± 15 nm, Semrock, FF02-472/30-25) and delivered to the brain in order to excite GRABNE1m. The emission light passed through the same optic fiber, through a bandpass filter (passing band: 534 ± 25 nm, Semrock, FF01-535/50), and into a Femtowatt Silicon Photoreceiver, which recorded the GRABNE1m emission using an RZ5 real-time processor (Tucker-Davis Technologies). The 400-Hz signals from the photoreceiver were extracted in real time using a custom-written program (Tucker-Davis Technologies) and used to reflect the intensity of the GRABNE1m fluorescence signal.
Behavioral assays
All behavioral tests were performed at least one hour after the onset of the dark cycle. For the tail suspension test, each mouse was gripped by the tail and lifted off the bottom of its cage six times for 60 s each, with at least one minute between each lift. For the forced swim test, the mouse was gently placed in a 1000-ml conical flask containing lukewarm water and removed after 4-6 minutes. After removal from the water, the mouse was gently dried with paper towels and placed in the home cage on a heating pad. For conspecific assays, an adult C57BL/6 group-housed mouse of either sex was placed inside the test mouse’s cage for 10 minutes. No sexual behavior or aggressive behavior was observed during the interaction. For the food assay, ~4g of peanut butter was placed in the cap of a 15-ml plastic tube and placed inside of the test mouse’s cage for 10 minutes. During that period, the test mouse was free to explore, sniff, and eat the peanut butter. All videos were acquired at 25 frames per second and manually annotated frame-by-frame using a custom MATLAB program (Lin et al., 2011). “Approach” refers to the period in which the subject mouse walks towards the intruder mouse. “Sniff” refers to the time in which the subject mouse sniffs the conspecific intruder. “Being sniffed” refers to the period in which the subject mouse is being sniffed by the conspecific intruder. “Contact” with the social stimulus refers to the period in which the test mouse sniffed or was sniffed by the intruder. “Contact” with the peanut butter refers to the period in which the test mouse sniffed or ate the peanut butter. “Lift” refers to the period in which the experimenter gripped the mouse’s tail and lifted the mouse into the air.
QUANTIFICATION AND STATISTICAL ANALYSIS
For the imaging experiments using cultured HEK293T cells, primary neurons, and brain slices, images were first imported to ImageJ software (National Institutes of Health) for fluorescence intensity readouts, and then analyzed using MATLAB (MathWorks) with a custom-written script or Origin Pro (OriginLab). The fluorescence response traces in the brain slices shown in Fig. 4 were processed with 3x binning and then plotted.
Time-lapse images of the zebrafish were analyzed using Fiji to acquire the fluorescence intensity in the region of interest (ROI) in each frame. A custom-written MATLAB program was then used to calculate the change in fluorescence intensity (ΔF/F0) as (Ft-F0)/F0, where Ft was the fluorescence intensity at time t and F0 was the average fluorescence intensity during the entire time window. Statistical analyses were performed using GraphPad Prism 6 and Origin Pro (OriginLab).
For the fiber photometry data shown in Fig. 7, the MATLAB function “msbackadj” with a moving window of 25% of the total recording duration was first applied to obtain the instantaneous baseline signal(Fbaseline). The instantaneous ΔF/F was calculated as (Fraw–Fbaseline)/Fbaseline, and a peri-stimulus histogram (PSTH) was calculated by aligning the ΔF/F signal of each trial to the onset of the behavior of interest. The response elicited during a behavior was calculated as the average ΔF/F during all trials of a given behavior. The response between behavioral periods was calculated as the average ΔF/F between two behavioral episodes excluding 4 s immediately before the behavior’s onset, as some uncontrolled and/or unintended events (e.g., chasing the animal before the tail suspension test) may have occurred during that period. The baseline signal was calculated as the average ΔF/F 100 s prior to the start of the behavioral test. The peak response after each drug injection was calculated as the average maximum ΔF/F during all tail suspension trials. The decay time was calculated as the average time required to reach half of the peak response.
Except where indicated otherwise, group differences were analyzed using the Student’s t-test, Wilcoxon matched-pairs signed rank test, Shapiro-Wilk normality test, one-way ANOVA test, or Friedman’s test. Except where indicated otherwise, all summary data are presented as the mean ± SEM.
DATA AND SOFTWARE AVAILABILITY
The custom-written MATLAB programs using in this study will be provided upon request to the corresponding author.
Supplementary Material
Table S1. PCR primers, related to STAR Methods.
KEY RESOURCES TABLE
| REAGENT or RESOURCE | SOURCE | IDENTIFIER |
|---|---|---|
| Antibodies | ||
| Chicken polyclonal anti-GFP antibody | Abcam | Cat#ab13970; RRID:AB_300798 |
| Rabbit polyclonal anti-Dopamine beta Hydroxylase (DBH) antibody | Abcam | Cat#ab209487 |
| Alexa-488-conjugated goat-anti-chicken IgG (H+L) | Invitrogen | Cat#A11039; RRID:AB_142924 |
| Alexa-555-conjugated goat-anti-rabbit IgG (H+L) | AAT Bioquest | Cat#16690 |
| DAPI fluoromount-G | SouthernBiotech | Cat#0100-20 |
| Bacterial and Virus Strains | ||
| Sindbis-NE1m | This paper | N/A |
| Sindbis-NE1h | This paper | N/A |
| Sindbis-NEmut | This paper | N/A |
| AAV9-hSyn-NE1m | Vigene Biosciences | N/A |
| AAV9-hSyn-NE1h | Vigene Biosciences | N/A |
| AAV9-Ef1a-DIO-C1V1-YFP | Gift from Karl Deisseroth (Yizhar et al., 2011) | Addgene viral prep # 35497-AAV9; RRID:Addgene_35497 |
| AAV9-hSyn-NEmut | Vigene Biosciences | N/A |
| AAV9-hsyn-tTA | Vigene Biosciences | N/A |
| AAV9-TRE-NE1h | Vigene Biosciences | N/A |
| AAV9-hSyn-DA1m | Vigene Biosciences | N/A |
| Chemicals, Peptides, and Recombinant Proteins | ||
| Norepinephrine bitartrate (NE) | Sigma-Aldrich | Cat#A9512 |
| UK 14,304 tartrate (UK or brimonidine) | Tocris | Cat#2466 |
| Yohimbine hydrochloride (YO) | Tocris | Cat#1127 |
| Epinephrine hydrochloride (Epi) | Sigma-Aldrich | Cat#E4642 |
| Isoprenaline hydrochloride (ISO) | Sigma-Aldrich | Cat#I5627 |
| ICI 118,551 hydrochloride (ICI) | Sigma-Aldrich | Cat#I127 |
| Dopamine hydrochloride (DA) | Sigma-Aldrich | Cat#H8502 |
| Haloperidol hydrochloride (Halo) | Tocris | Cat#0931 |
| Serotonin hydrochloride (5-HT) | Tocris | Cat#3547 |
| Histamine dihydrochloride (His) | Tocris | Cat#3545 |
| L-Glutamic acid (Glu) | Sigma-Aldrich | Cat#V900408 |
| γ-Aminobutyric acid (GABA) | Tocris | Cat#0344 |
| Adenosine (ADO) | Tocris | Cat#3624 |
| Acetylcholine chloride (ACh) | Solarbio | Cat#G8320 |
| Tyramine (TA) | Sigma-Aldrich | Cat#V900670 |
| NPEC-caged-noradrenaline (NPEC-caged-NE) | Santa Cruz | Cat#sc-361279 |
| Desipramine hydrochloride (Desi) | Sigma-Aldrich | Cat#D3900 |
| GBR 12909 (GBR) | Tocris | Cat#0421 |
| Eticlopride hydrochloride (Etic) | Tocris | Cat#1847 |
| Atomoxetine hydrochloride (ATX) | Sigma-Aldrich | Cat#Y0001586 |
| Sulpiride | Sigma-Aldrich | Cat#s8010 |
| 2,2,2-Tribromoethanol (Avetin) | Sigma-Aldrich | Cat#T48402 |
| α-bungarotoxin | Tocris | Cat#2133 |
| Low melting-point agarose | Sigma-Aldrich | Cat#A9414 |
| T5-exonuclease | New England Biolabs | Cat#M0363S |
| Phusion DNA polymerase | Thermo Fisher Scientific | Cat#F530L |
| Taq ligase | iCloning | Cat#TDL-100 |
| Cal590 | AAT Bioquest | Cat#20510 |
| Critical Commercial Assays | ||
| NanoLuc® Luciferase Assay | Promega | Cat#N1110 |
| Experimental Models: Cell Lines | ||
| HEK293T | ATCC | Cat#CRL-3216; RRID:CVCL_0063 |
| HTLA cells for tango assay | Gift from Bryan L. Roth (Kroeze et al., 2015) | N/A |
| HEK293T cell line stably expressing chimeric Gαq/i and AP-TGFα | (Inoue et al., 2012) | N/A |
| HEK293T cell line stably expressing NE1m, chimeric Gαq/i and AP-TGFα | This paper | N/A |
| HEK293T cell line stably expressing wt-α2AR, chimeric Gαq/i and AP-TGFα | This paper | N/A |
| Experimental Models: Organisms/Strains | ||
| Mouse: wild-type Sprague-Dawley rat pups (P0) | Beijing Vital River Laboratory Animal Technology Co., Ltd. | http://www.vitalriver.com/ |
| Mouse: wild-type C57BL/6 | Beijing Vital River Laboratory Animal Technology Co., Ltd. | http://www.vitalriver.com/ |
| Mouse: wild-type C57BL/6 | Charles River Laboratories | https://www.criver.com/ |
| Mouse: B6.FVB(Cg)-Tg(Th-cre)FI172Gsat/Mmucd | MMRRC | RRID:MMRRC_031029-UCD |
| Zebrafish: albino (slc45a2b4) (The background strain) | ZFIN | N/A |
| Zebrafish: Tg(HuC:GRABNE1m) | This paper | N/A |
| Zebrafish: Tg(HuC:GRABNE1h) | This paper | N/A |
| Zebrafish: Tg(HuC:GRABNEmut) | This paper | N/A |
| Zebrafish: Tg(HuC:NES-jRGECO1a) | This paper | N/A |
| Zebrafish: Tg(HuC:NES-jRGECO1a);Tg(HuC:GRABNE1m) | This paper | N/A |
| Oligonucleotides | ||
| PCR primers | This paper | See Table S1 |
| Recombinant DNA | ||
| pDisplay vector | Invitrogen | Cat#V66020 |
| pDisplay-NE1m-IRES-mCherry-CAAX | This paper | N/A |
| pDisplay-NE1h-IRES-mCherry-CAAX | This paper | N/A |
| pDisplay-NEmut-IRES-mCherry-CAAX | This paper | N/A |
| pDisplay-NE0.5m-IRES-mCherry-CAAX | This paper | N/A |
| pAAV-TRE-NE1h | This paper | N/A |
| pAAV-hSyn-tTA | This paper | N/A |
| Full-length human GPCR cDNAs | human ORFeome 8.1 | http://horfdb.dfci.harvard.edu/ |
| pDisplay-α2AR-EGFP(ICL3)-IRES-mCherry-CAAX | This paper | N/A |
| pDisplay-α2AR-cpEGFP(ICL3)-IRES-mCherry-CAAX | This paper | N/A |
| pDisplay-α1DR-cpEGFP(ICL3)-IRES-mCherry-CAAX | This paper | N/A |
| pDisplay-α2BR-cpEGFP(ICL3)-IRES-mCherry-CAAX | This paper | N/A |
| pDisplay-β2R-cpEGFP(ICL3)-IRES-mCherry-CAAX | This paper | N/A |
| pDisplay-β3R-cpEGFP(ICL3)-IRES-mCherry-CAAX | This paper | N/A |
| pDest-mScarlet-CAAX | This paper | N/A |
| pDest-EGFP-CAAX | This paper | N/A |
| pDest-KDELR1-EGFP | This paper | N/A |
| pDest-PSD95-mScarlet | This paper | N/A |
| pDest-Synaptophysin-mScarlet | This paper | N/A |
| pPacific-α2AR (for cell line construction) | This paper | N/A |
| pPacific-NE1m (for cell line construction) | This paper | N/A |
| pTango-α2AR | This paper | N/A |
| pTango-NE1m | This paper | N/A |
| pTango-NE1h | This paper | N/A |
| pCS7-PiggyBAC | VIEWSOLID BIOTECH (Yusa et al., 2011) | N/A |
| pCS7-PiggyBAC (S103P, S509G) | This paper | N/A |
| LgBit-mGsi | Gift from Nevin A. Lambert (Wan et al., 2018) | N/A |
| α2AR-SmBit | This paper | N/A |
| NE1m-SmBit | This paper | N/A |
| NE1h-SmBit | This paper | N/A |
| pTol2-HuC:GRABNE1m | This paper | N/A |
| pTol2-HuC:GRABNE1h | This paper | N/A |
| pTol2-HuC:GRABNEmut | This paper | N/A |
| Tol2 mRNA | This paper | N/A |
| Software and Algorithms | ||
| Image J | NIH | https://imagej.nih.gov/ij/ RRID:SCR_003070 |
| Origin 9.1 | OriginLab | https://www.originlab.com/ |
| MATLAB | MathWorks | https://www.mathworks.com/products/matlab.html RRID:SCR_001622 |
| Arduino | Arduino | https://www.arduino.cc |
| GraphPad Prism 7 | GraphPad Software | RRID:SCR_002798 |
| R | R Core Team, 2016 | RRID:SCR_001905N/A |
| Linear Spectral Unmixing Algorithm v1.1 | NIH | https://www.niehs.nih.gov/research/atniehs/labs/ln/pi/iv/tools/index.cfm |
| Other | ||
| Microsyringe pumps for virus injection | WPI/ Drummond Scientific | Nanoliter 2000 Injector/ Nanoject II |
| Inverted confocal microscope | Nikon | Ti-E A1 |
| Inverted confocal microscope | Olympus | FV3000 |
| Upright confocal microscope | Olympus | FV1000 |
| Opera Phenix high content screening system | PerkinElmer | Cat#HH14000000 |
| Multilabel plate reader | PerkinElmer | VICTOR X5 |
| Tethered FSCV system | Pinnacle Technology | Pinnacle tethered |
| Vibratome | Leica | VT1200 |
| Cryostat | Leica | CM1900 |
| Two-photon microscope | Olympus | FV1000MPE |
| Mai Tai Ti:Sapphire laser | Spectra-Physics | Deepsee |
| Patch clamp amplifier | Molecular Devices | Axopatch-200B |
| Concentric electrode | FHC | #CBAEC75 |
| Optical fibers | Thorlabs | BFH48-400 |
| Ceramic ferrule | Thorlabs | SFLC440-10 |
| Blue LED light | Thorlabs | M470F1 |
| Blue LED driver | Thorlabs | LEDD1B |
| Femtowatt Silicon Photoreceiver | Newport | 2151 |
| BioAmp processor | TDT | RZ5 |
| Slide scanner microscope | Olympus | VS120 |
Acknowledgements
This work was supported by the National Basic Research Program of China (973 Program; grant 2015CB856402), the General Program of National Natural Science Foundation of China (project 31671118), the NIH BRAIN Initiative grant U01NS103558, the Junior Thousand Talents Program of China, the grants from the Peking-Tsinghua Center for Life Sciences, and the State Key Laboratory of Membrane Biology at Peking University School of Life Sciences to Y. L; the Key Research Program of Frontier Sciences (QYZDY-SSW-SMC028) of Chinese Academy of Sciences, and Shanghai Science and Technology Committee (18JC1410100) to J.D.; the NIH grants R01MH101377 and R21HD090563 and an Irma T. Hirschl Career Scientist Award to D.L.; and the Intramural Research Program of the NIH/NIEHS of the United States (1ZIAES103310) to G.C. Peking University Postdoctoral Fellowship to Y.Z., J.J.Z. is the Radboud Professor and Sir Yue-Kong Pao Chair Professor.
We thank Yi Rao for sharing the two-photon microscope and Xiaoguang Lei for the platform support of the Opera Phenix high-content screening system at PKU-CLS. We thank the Core Facilities at the School of Life Sciences, Peking University for assistance with DNA sequencing work and we would be grateful to Dr. Zhi Dong for his help of analyzing data. We thank Bryan Roth and Nevin Lambert for sharing stable cell lines and plasmids. We thank Yue Sun, Sunlei Pan, Lun Yang, Haohong Li for inputs on sensors’ characterization and application. We thank Yanhua Huang, Jianing Yu, Liqun Luo and Mickey London for valuable feedback of the manuscript.
Footnotes
Publisher's Disclaimer: This is a PDF file of an unedited manuscript that has been accepted for publication. As a service to our customers we are providing this early version of the manuscript. The manuscript will undergo copyediting, typesetting, and review of the resulting proof before it is published in its final citable form. Please note that during the production process errors may be discovered which could affect the content, and all legal disclaimers that apply to the journal pertain.
Declaration of Interests
The authors declare competing financial interests. J.F., M.J., H.Wang, and Y. L have filed patent applications whose value might be affected by this publication.
References
- Akerboom J, Chen T-W, Wardill TJ, Tian L, Marvin JS, Mutlu S, Calderón NC, Esposti F, Borghuis BG, Sun XR, et al. (2012). Optimization of a GCaMP Calcium Indicator for Neural Activity Imaging. The Journal of Neuroscience 32, 13819. [DOI] [PMC free article] [PubMed] [Google Scholar]
- Akerboom J, Rivera JDV, Guilbe MMR, Malavé ECA, Hernandez HH, Tian L, Hires SA, Marvin JS, Looger LL, and Schreiter ER (2009). Crystal Structures of the GCaMP Calcium Sensor Reveal the Mechanism of Fluorescence Signal Change and Aid Rational Design. Journal of Biological Chemistry 284, 6455–6464. [DOI] [PMC free article] [PubMed] [Google Scholar]
- Bast N, Poustka L, and Freitag CM (2018). The locus coeruleus-norepinephrine system as pacemaker of attention - a developmental mechanism of derailed attentional function in autism spectrum disorder. Eur J Neurosci 47, 115–125. [DOI] [PubMed] [Google Scholar]
- Berridge CW, Schmeichel BE, and Espana RA (2012). Noradrenergic modulation of wakefulness/arousal. Sleep Med Rev 16, 187–197. [DOI] [PMC free article] [PubMed] [Google Scholar]
- Berridge CW, and Spencer RC (2016). Differential cognitive actions of norepinephrine α2 and a1 receptor signaling in the prefrontal cortex. Brain Res 1641, 189–196. [DOI] [PMC free article] [PubMed] [Google Scholar]
- Berridge CW, and Waterhouse BD (2003). The locus coeruleus–noradrenergic system: modulation of behavioral state and state-dependent cognitive processes. Brain Research Reviews 42, 33–84. [DOI] [PubMed] [Google Scholar]
- Bito L, Davson H, Levin E, Murray M, and Snider N (1966). THE CONCENTRATIONS OF FREE AMINO ACIDS AND OTHER ELECTROLYTES IN CEREBROSPINAL FLUID, IN VIVO DIALYSATE OF BRAIN, AND BLOOD PLASMA OF THE DOG*. Journal of Neurochemistry 13, 1057–1067. [DOI] [PubMed] [Google Scholar]
- Brodde O-E, Bruck H, Leineweber K, and Seyfarth T (2001). Presence, distribution and physiological function of adrenergic and muscarinic receptor subtypes in the human heart. Basic Research in Cardiology 96, 528–538. [DOI] [PubMed] [Google Scholar]
- Bruns D (2004). Detection of transmitter release with carbon fiber electrodes. Methods 33, 312–321. [DOI] [PubMed] [Google Scholar]
- Chefer VI, Thompson AC, Zapata A, and Shippenberg TS (2009). Overview of Brain Microdialysis. Current Protocols in Neuroscience 47, 7.1.1–7.1.28. [DOI] [PMC free article] [PubMed] [Google Scholar]
- Chrousos GP (2009). Stress and disorders of the stress system. Nat Rev Endocrinol 5, 374–381. [DOI] [PubMed] [Google Scholar]
- Chung KY, Rasmussen SG, Liu T, Li S, DeVree BT, Chae PS, Calinski D, Kobilka BK, Woods VL Jr., and Sunahara RK (2011). Conformational changes in the G protein Gs induced by the beta2 adrenergic receptor. Nature 477, 611–615. [DOI] [PMC free article] [PubMed] [Google Scholar]
- Dugast C, Cespuglio R, and Suaud-Chagny MF (2002). In vivo monitoring of evoked noradrenaline release in the rat anteroventral thalamic nucleus by continuous amperometry. Journal of Neurochemistry 82, 529–537. [DOI] [PubMed] [Google Scholar]
- Espay AJ, LeWitt PA, and Kaufmann H (2014). Norepinephrine deficiency in Parkinson's disease: the case for noradrenergic enhancement. Mov Disord 29, 1710–1719. [DOI] [PubMed] [Google Scholar]
- Falkner AL, Grosenick L, Davidson TJ, Deisseroth K, and Lin D (2016). Hypothalamic control of male aggression-seeking behavior. Nature Neuroscience 19, 596. [DOI] [PMC free article] [PubMed] [Google Scholar]
- Fenno L, Yizhar O, and Deisseroth K (2011). The development and application of optogenetics. Annu Rev Neurosci 34, 389–412. [DOI] [PMC free article] [PubMed] [Google Scholar]
- Gibson DG, Young L, Chuang R-Y, Venter JC, Hutchison lii CA, and Smith HO (2009). Enzymatic assembly of DNA molecules up to several hundred kilobases. Nature Methods 6, 343. [DOI] [PubMed] [Google Scholar]
- Goddard AW, Ball SG, Martinez J, Robinson MJ, Yang CR, Russell JM, and Shekhar A (2010). Current perspectives of the roles of the central norepinephrine system in anxiety and depression. Depress Anxiety 27, 339–350. [DOI] [PubMed] [Google Scholar]
- Goldstein M, Fuxe K, and Hökfelt T (1972). Characterization and Tissue Localization of Catecholamine Synthesizing Enzymes. Pharmacological Reviews 24, 293. [PubMed] [Google Scholar]
- Hashikawa K, Hashikawa Y, Falkner A, and Lin D (2016). The neural circuits of mating and fighting in male mice. Current opinion in neurobiology 38, 27–37. [DOI] [PMC free article] [PubMed] [Google Scholar]
- Hoffman BB, and Lefkowitz RJ (1980). Radioligand Binding Studies of Adrenergic Receptors: New Insights into Molecular and Physiological Regulation. Annual Review of Pharmacology and Toxicology 20, 581–608. [DOI] [PubMed] [Google Scholar]
- Inoue A, Ishiguro J, Kitamura H, Arima N, Okutani M, Shuto A, Higashiyama S, Ohwada T, Arai H, Makide K, et al. (2012). TGFα shedding assay: an accurate and versatile method for detecting GPCR activation. Nature Methods 9, 1021. [DOI] [PubMed] [Google Scholar]
- Jing M, Zhang P, Wang G, Feng J, Mesik L, Zeng J, Jiang H, Wang S, Looby JC, Guagliardo NA, et al. (2018). A genetically encoded fluorescent acetylcholine indicator for in vitro and in vivo studies. Nature Biotechnology 36, 726. [DOI] [PMC free article] [PubMed] [Google Scholar]
- Justice JB (1993). Quantitative microdialysis of neurotransmitters. Journal of Neuroscience Methods 48, 263–276. [DOI] [PubMed] [Google Scholar]
- Kitahama K, Pearson J, Denoroy L, Kopp N, Ulrich J, Maeda T, and Jouvet M (1985). Adrenergic neurons in human brain demonstrated by immunohistochemistry with antibodies to phenylethanolamine-N-methyltransferase (PNMT): Discovery of a new group in the nucleus tractus solitarius. Neuroscience Letters 53, 303–308. [DOI] [PubMed] [Google Scholar]
- Kroeze WK, Sassano MF, Huang X-P, Lansu K, McCorvy JD, Giguére PM, Sciaky N, and Roth BL (2015). PRESTO-Tango as an open-source resource for interrogation of the druggable human GPCRome. Nature Structural &Amp; Molecular Biology 22, 362. [DOI] [PMC free article] [PubMed] [Google Scholar]
- Lee GJ, Park JH, and Park HK (2008). Microdialysis applications in neuroscience. Neurological Research 30, 661–668. [DOI] [PubMed] [Google Scholar]
- Leibowitz SF (1970). Reciprocal Hunger-Regulating Circuits Involving Alpha-and Beta-Adrenergic Receptors Located, Respectively, in the Ventromedial and Lateral Hypothalamus. Proceedings of the National Academy of Sciences of the United States of America 67, 1063–1070. [DOI] [PMC free article] [PubMed] [Google Scholar]
- Leibowitz SF, Jhanwar-Uniyal M, Dvorkin B, and Makman MH (1982). Distribution of α-adrenergic, β-adrenergic and dopaminergic receptors in discrete hypothalamic areas of rat. Brain Research 233, 97–114. [DOI] [PubMed] [Google Scholar]
- Li L, Feng X, Zhou Z, Zhang H, Shi Q, Lei Z, Shen P, Yang Q, Zhao B, Chen S, et al. (2018). Stress Accelerates Defensive Responses to Looming in Mice and Involves a Locus Coeruleus-Superior Colliculus Projection. Curr Biol 28, 859–871 e855. [DOI] [PubMed] [Google Scholar]
- Manglik A, Kim TH, Masureel M, Altenbach C, Yang Z, Hilger D, Lerch MT, Kobilka TS, Thian FS, Hubbell WL, et al. (2015). Structural Insights into the Dynamic Process of beta2-Adrenergic Receptor Signaling. Cell 161, 1101–1111. [DOI] [PMC free article] [PubMed] [Google Scholar]
- Marien MR, Colpaert FC, and Rosenquist AC (2004). Noradrenergic mechanisms in neurodegenerative diseases: a theory. Brain Research Reviews 45, 38–78. [DOI] [PubMed] [Google Scholar]
- Marvin JS, Borghuis BG, Tian L, Cichon J, Harnett MT, Akerboom J, Gordus A, Renninger SL, Chen TW, Bargmann CI, et al. (2013). An optimized fluorescent probe for visualizing glutamate neurotransmission. Nat Methods 10, 162–170. [DOI] [PMC free article] [PubMed] [Google Scholar]
- McQuade R, and Stanford SC (2000). A microdialysis study of the noradrenergic response in rat frontal cortex and hypothalamus to a conditioned cue for aversive, naturalistic environmental stimuli. Psychopharmacology 148, 201–208. [DOI] [PubMed] [Google Scholar]
- Meng C, Zhou J, Papaneri A, Peddada T, Xu K, and Cui G (2018). Spectrally Resolved Fiber Photometry for Multi-component Analysis of Brain Circuits. Neuron 98, 707–717.e704. [DOI] [PMC free article] [PubMed] [Google Scholar]
- Moore RY, and Bloom FE (1979). Central Catecholamine Neuron Systems: Anatomy and Physiology of the Norepinephrine and Epinephrine Systems. Annual Review of Neuroscience 2, 113–168. [DOI] [PubMed] [Google Scholar]
- Moret C, and Briley M (2011). The importance of norepinephrine in depression. Neuropsychiatr Dis Treat 7, 9–13. [DOI] [PMC free article] [PubMed] [Google Scholar]
- Muller A, Joseph V, Slesinger PA, and Kleinfeld D (2014). Cell-based reporters reveal in vivo dynamics of dopamine and norepinephrine release in murine cortex. Nature Methods 11, 1245. [DOI] [PMC free article] [PubMed] [Google Scholar]
- Nakanishi J, Takarada T, Yunoki S, Kikuchi Y, and Maeda M (2006). FRET-based monitoring of conformational change of the β2 adrenergic receptor in living cells. Biochemical and Biophysical Research Communications 343, 1191–1196. [DOI] [PubMed] [Google Scholar]
- Nygaard R, Zou Y, Dror RO, Mildorf TJ, Arlow DH, Manglik A, Pan AC, Liu CW, Fung JJ, Bokoch MP, et al. (2013). The dynamic process of beta(2)-adrenergic receptor activation. Cell 152, 532–542. [DOI] [PMC free article] [PubMed] [Google Scholar]
- Olive MF, Mehmert KK, and Hodge CW (2000). Microdialysis in the mouse nucleus accumbens: a method for detection of monoamine and amino acid neurotransmitters with simultaneous assessment of locomotor activity. Brain Research Protocols 5, 16–24. [DOI] [PubMed] [Google Scholar]
- Pacak K, Palkovits M, Kopin IJ, and Goldstein DS (1995). Stress-Induced Norepinephrine Release in the Hypothalamic Paraventricular Nucleus and Pituitary-Adrenocortical and Sympathoadrenal Activity: In Vivo Microdialysis Studies. Frontiers in Neuroendocrinology 16, 89–150. [DOI] [PubMed] [Google Scholar]
- Park J, Kile BM, and Mark Wightman R (2009). In vivo voltammetric monitoring of norepinephrine release in the rat ventral bed nucleus of the stria terminalis and anteroventral thalamic nucleus. European Journal of Neuroscience 30, 2121–2133. [DOI] [PMC free article] [PubMed] [Google Scholar]
- Patriarchi T, Cho JR, Merten K, Howe MW, Marley A, Xiong W-H, Folk RW, Broussard GJ, Liang R, Jang MJ, et al. (2018). Ultrafast neuronal imaging of dopamine dynamics with designed genetically encoded sensors. Science 360. [DOI] [PMC free article] [PubMed] [Google Scholar]
- Rasmussen SG, Choi HJ, Fung JJ, Pardon E, Casarosa P, Chae PS, Devree BT, Rosenbaum DM, Thian FS, Kobilka TS, et al. (2011a). Structure of a nanobody-stabilized active state of the beta(2) adrenoceptor. Nature 469, 175–180. [DOI] [PMC free article] [PubMed] [Google Scholar]
- Rasmussen SG, DeVree BT, Zou Y, Kruse AC, Chung KY, Kobilka TS, Thian FS, Chae PS, Pardon E, Calinski D, et al. (2011b). Crystal structure of the beta2 adrenergic receptor-Gs protein complex. Nature 477, 549–555. [DOI] [PMC free article] [PubMed] [Google Scholar]
- Ren Q, Kurose H, Lefkowitz RJ, and Cotecchia S (1993). Constitutively active mutants of the alpha 2-adrenergic receptor. Journal of Biological Chemistry 268, 16483–16487. [PubMed] [Google Scholar]
- Robinson DL, Hermans A, Seipel AT, and Wightman RM (2008). Monitoring Rapid Chemical Communication in the Brain. Chemical Reviews 108, 2554–2584. [DOI] [PMC free article] [PubMed] [Google Scholar]
- Robinson DL, Venton BJ, Heien MLAV, and Wightman RM (2003). Detecting Subsecond Dopamine Release with Fast-Scan Cyclic Voltammetry in Vivo. Clinical Chemistry 49, 1763. [DOI] [PubMed] [Google Scholar]
- Schwarz LA, and Luo L (2015). Organization of the Locus Coeruleus-Norepinephrine System. Current Biology 25, R1051–R1056. [DOI] [PubMed] [Google Scholar]
- Schwarz LA, Miyamichi K, Gao XJ, Beier KT, Weissbourd B, DeLoach KE, Ren J, Ibanes S, Malenka RC, Kremer EJ, et al. (2015). Viral-genetic tracing of the input-output organization of a central noradrenaline circuit. Nature 524, 88. [DOI] [PMC free article] [PubMed] [Google Scholar]
- Shekhar A, Katner JS, Sajdyk TJ, and Kohl RR (2002). Role of norepinephrine in the dorsomedial hypothalamic panic response: An in vivo microdialysis study. Pharmacology Biochemistry and Behavior 71, 493–500. [DOI] [PubMed] [Google Scholar]
- Singleman C, and Holtzman NG (2014). Growth and Maturation in the Zebrafish, Danio Rerio: A Staging Tool for Teaching and Research. Zebrafish 11, 396–406. [DOI] [PMC free article] [PubMed] [Google Scholar]
- Sokolowski K, and Corbin JG (2012). Wired for behaviors: from development to function of innate limbic system circuitry. Frontiers in Molecular Neuroscience 5, 55. [DOI] [PMC free article] [PubMed] [Google Scholar]
- Sun F, Zeng J, Jing M, Zhou J, Feng J, Owen SF, Luo Y, Li F, Wang H, Yamaguchi T, et al. (2018). A Genetically Encoded Fluorescent Sensor Enables Rapid and Specific Detection of Dopamine in Flies, Fish, and Mice. Cell 174, 481–496.e419. [DOI] [PMC free article] [PubMed] [Google Scholar]
- Tanaka M (1999). Emotional Stress and Characteristics of Brain Noradrenaline Release in the Rat. INDUSTRIAL HEALTH 37, 143–156. [DOI] [PubMed] [Google Scholar]
- Urban DJ, and Roth BL (2015). DREADDs (designer receptors exclusively activated by designer drugs): chemogenetic tools with therapeutic utility. Annu Rev Pharmacol Toxicol 55, 399–417. [DOI] [PubMed] [Google Scholar]
- Vilardaga J-P, Bunemann M, Krasel C, Castro M, and Lohse MJ (2003). Measurement of the millisecond activation switch of G protein–coupled receptors in living cells. Nature Biotechnology 21, 807. [DOI] [PubMed] [Google Scholar]
- Wan Q, Okashah N, Inoue A, Nehmé R, Carpenter B, Tate CG, and Lambert NA (2018). Mini G protein probes for active G protein-coupled receptors (GPCRs) in live cells. Journal of Biological Chemistry. [DOI] [PMC free article] [PubMed] [Google Scholar]
- Wang A, Feng J, Li Y, and Zou P (2018a). Beyond Fluorescent Proteins: Hybrid and Bioluminescent Indicators for Imaging Neural Activities. ACS Chemical Neuroscience 9, 639–650. [DOI] [PubMed] [Google Scholar]
- Wang G, Wyskiel DR, Yang W, Wang Y, Milbern LC, Lalanne T, Jiang X, Shen Y, Sun Q-Q, and Zhu JJ (2015). An optogenetics- and imaging-assisted simultaneous multiple patch-clamp recordings system for decoding complex neural circuits. Nature protocols 10, 397–412. [DOI] [PMC free article] [PubMed] [Google Scholar]
- Wang H, Jing M, and Li Y (2018b). Lighting up the brain: genetically encoded fluorescent sensors for imaging neurotransmitters and neuromodulators. Curr Opin Neurobiol 50, 171–178. [DOI] [PMC free article] [PubMed] [Google Scholar]
- Watson CJ, Venton BJ, and Kennedy RT (2006). In Vivo Measurements of Neurotransmitters by Microdialysis Sampling. Analytical Chemistry 78, 1391–1399. [DOI] [PubMed] [Google Scholar]
- Yang T, and Shah NM (2016). Molecular and neural control of sexually dimorphic social behaviors. Current Opinion in Neurobiology 38, 89–95. [DOI] [PMC free article] [PubMed] [Google Scholar]
- Yao Y, Li X, Zhang B, Yin C, Liu Y, Chen W, Zeng S, and Du J (2016). Visual Cue-Discriminative Dopaminergic Control of Visuomotor Transformation and Behavior Selection. Neuron 89, 598–612. [DOI] [PubMed] [Google Scholar]
- Yizhar O, Fenno LE, Prigge M, Schneider F, Davidson TJ, O’Shea DJ, Sohal VS, Goshen I, Finkelstein J, Paz JT, et al. (2011). Neocortical excitation/inhibition balance in information processing and social dysfunction. Nature 477, 171. [DOI] [PMC free article] [PubMed] [Google Scholar]
- Yusa K, Zhou L, Li MA, Bradley A, and Craig NL (2011). A hyperactive piggyBac transposase for mammalian applications. Proceedings of the National Academy of Sciences of the United States of America 108, 1531–1536. [DOI] [PMC free article] [PubMed] [Google Scholar]
- Zhang L, Zhang P, Wang G, Zhang H, Zhang Y, Yu Y, Zhang M, Xiao J, Crespo P, Hell JW, et al. (2018). Ras and Rap signal bidirectional synaptic plasticity via distinct subcellular microdomains. Neuron 98, 783–800. [DOI] [PMC free article] [PubMed] [Google Scholar]
- Zhao Y, Araki S, Wu J, Teramoto T, Chang Y-F, Nakano M, Abdelfattah AS, Fujiwara M, Ishihara T, Nagai T, et al. (2011). An Expanded Palette of Genetically Encoded Ca(2+) Indicators. Science (New York, NY) 333, 1888–1891. [DOI] [PMC free article] [PubMed] [Google Scholar]
- Zhou Z, and Misler S (1995). Amperometric detection of stimulus-induced quantal release of catecholamines from cultured superior cervical ganglion neurons. Proceedings of the National Academy of Sciences 92, 6938. [DOI] [PMC free article] [PubMed] [Google Scholar]
- Zimmerman BG (1981). Adrenergic Facilitation by Angiotensin: Does it Serve a Physiological Function? Clinical Science 60, 343. [DOI] [PubMed] [Google Scholar]
- Zou P, Zhao Y, Douglass AD, Hochbaum DR, Brinks D, Werley CA, Harrison DJ, Campbell RE, and Cohen AE (2014). Bright and fast multicoloured voltage reporters via electrochromic FRET. Nat Commun 5, 4625. [DOI] [PMC free article] [PubMed] [Google Scholar]
Associated Data
This section collects any data citations, data availability statements, or supplementary materials included in this article.
Supplementary Materials
Table S1. PCR primers, related to STAR Methods.
Data Availability Statement
The custom-written MATLAB programs using in this study will be provided upon request to the corresponding author.